2020 09 04 Threshold plots - WojciechMigda/TruRL GitHub Wiki
Run parameters:
Episodes: 1000
max_episode_steps: 200
TsetliniClassifierBitwise({
        "threshold": <#####>,
        "s": <#####>,
        "number_of_regressor_clauses": 3200,
        "number_of_states": 127,
        "boost_true_positive_feedback": 1,
        "random_state": 1,
        "n_jobs": 2,
        "clause_output_tile_size": 16,
        "weighted": true,
        "verbose": false
    })
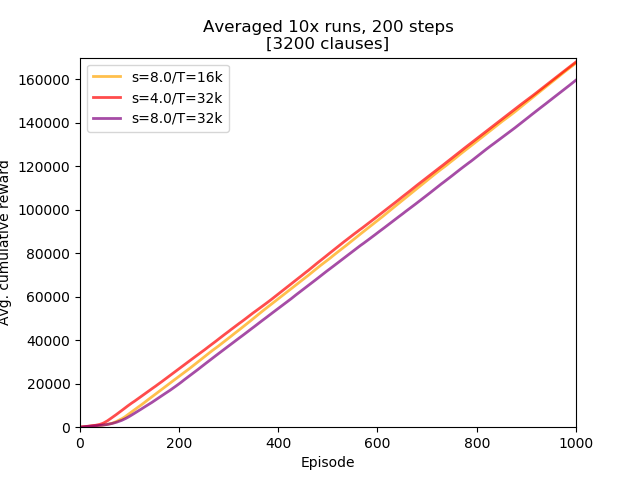
Three sets of specificity/Threshold were examined: s=8.0/T=16k, s=4.0/T=32k, and s=8.0/T=32k.
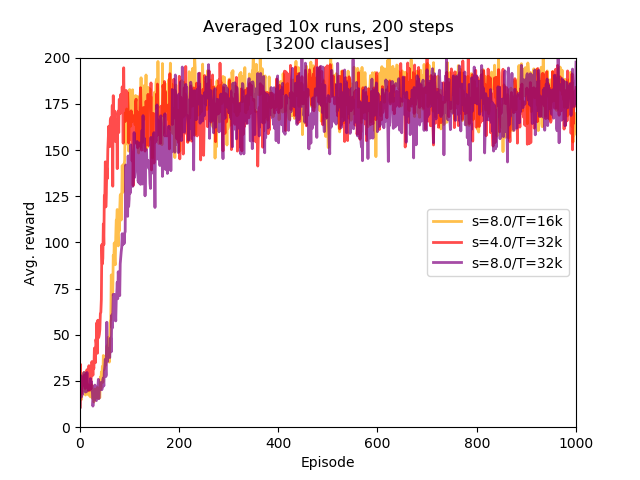
Conclusions:
- when specificity and Threshold are optimized in isolation they give learning results that are better when optimal specificity and optimal Threshold are used together,
steps_200_sT.py
#!/usr/bin/python3
# -*- coding: utf-8 -*-

import plac
import numpy as np
import pandas as pd


def main():
    df = pd.read_csv('steps_200_sT.csv', header=None, names=['s=8.0/T=16k', 's=4.0/T=32k', 's=8.0/T=32k'])

    import matplotlib.pyplot as plt

    plt.figure()

    lw = 2

    plt.plot(df.index + 1, df['s=8.0/T=16k'], lw=lw, color='orange', alpha=0.7, label='s=8.0/T=16k')
    plt.plot(df.index + 1, df['s=4.0/T=32k'], lw=lw, color='red', alpha=0.7, label='s=4.0/T=32k')
    plt.plot(df.index + 1, df['s=8.0/T=32k'], lw=lw, color='purple', alpha=0.7, label='s=8.0/T=32k')

    plt.xlabel("Episode")
    plt.ylabel("Avg. reward")

    plt.xlim(1, 1000)
    plt.ylim(0, 200)

    plt.title("Averaged 10x runs, 200 steps\n[3200 clauses]")
    plt.legend(loc='center right')

    plt.show()
    return 0


if __name__ == '__main__':
    plac.call(main)
steps_200_sT_AUC.py
#!/usr/bin/python3
# -*- coding: utf-8 -*-

import plac
import numpy as np
import pandas as pd


def main():
    df = pd.read_csv('steps_200_sT.csv', header=None, names=['s=8.0/T=16k', 's=4.0/T=32k', 's=8.0/T=32k'])

    df = df.cumsum(axis=0)

    import matplotlib.pyplot as plt

    plt.figure()

    lw = 2

    plt.plot(df.index + 1, df['s=8.0/T=16k'], lw=lw, color='orange', alpha=0.7, label='s=8.0/T=16k')
    plt.plot(df.index + 1, df['s=4.0/T=32k'], lw=lw, color='red', alpha=0.7, label='s=4.0/T=32k')
    plt.plot(df.index + 1, df['s=8.0/T=32k'], lw=lw, color='purple', alpha=0.7, label='s=8.0/T=32k')

    plt.xlabel("Episode")
    plt.ylabel("Avg. cumulative reward")

    plt.xlim(1, 1000)
    plt.ylim(0, 170000)

    plt.title("Averaged 10x runs, 200 steps\n[3200 clauses]")
    plt.legend(loc='upper left')

    plt.show()
    return 0


if __name__ == '__main__':
plac.call(main)Location: /experiments/2020-09-04_step200_sT
Logs were created by running /experiments/run.sh script (invocation parameters hardcoded inside). Logs were transformed into CSV file with averaged runs by executing /experiments/run_csv.py:
../run_csv.py steps_200_sT.csv run_test4.log run_test7.log run_test6.log
7130da6490e801ce9f65f839367420ecf3d83cf9
- specificity plots for Threshold of 32000