Rowin proces - Vuurvos1/dataweek GitHub Wiki
Getting to know each other
So when we tried to make teams, Sam and I knew each other from the first year and we were searching for a visual student that could help us with this project and a few minutes later Jeffrey asked us if he could join us and we agreed to form a team. After we decided that we agreed to make a call on our team's channel.
After we called each other we made a plan to figure out what our theme would be, we decided to stick with the colors of Amsterdam, but after we had a call for feedback, the teacher did not really understand why we went for our theme, and he decided to go for another theme that is pretty easy to go with so we changed the theme to public transport.
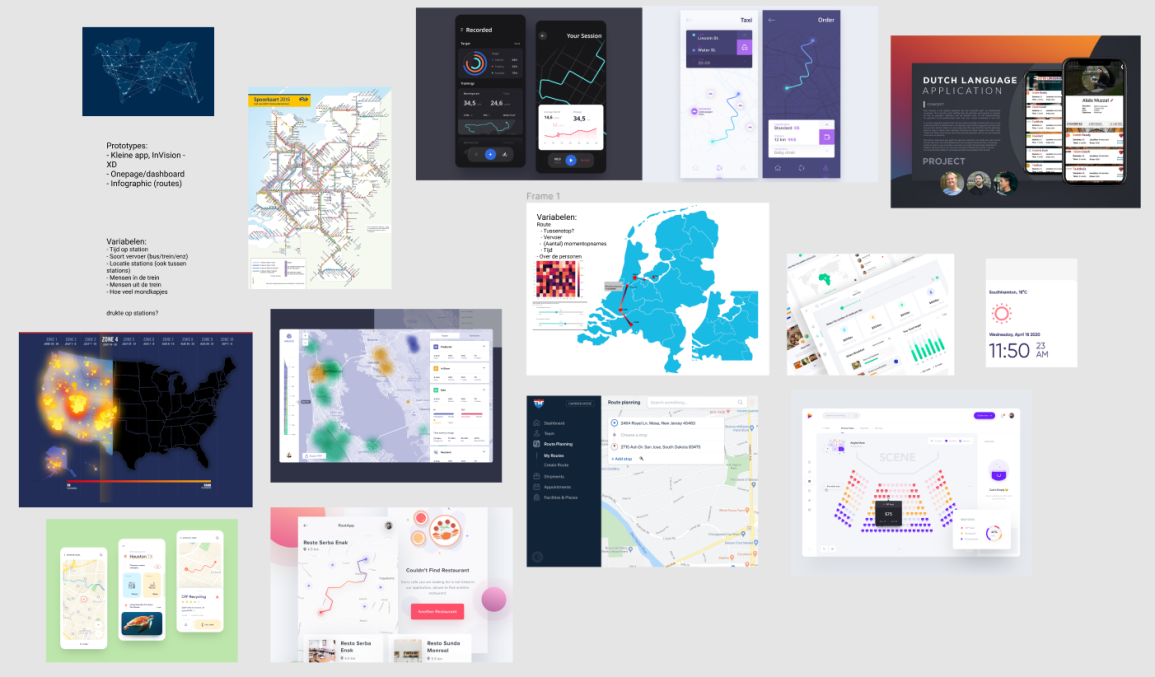
Making moodboards
Sam made a figma link so that we all could exchange out ideas on paper, this was a great tool for us because everyone could link and share images that were really usefull to use.
Teamwork and getting the data
So after we managed to get a theme we then decided to meet each other at school, while we were traveling the idea was to write down the data that we needed.
- Tijd op station
- Locatie stations (ook tussen stations)
- Mensen in de trein
So when we met at school everyone had their data available for the developers to make it into a JSON file, while I was formatting the data into a JSON file, Sam & Jeffrey made decisions about the design that we wanted.
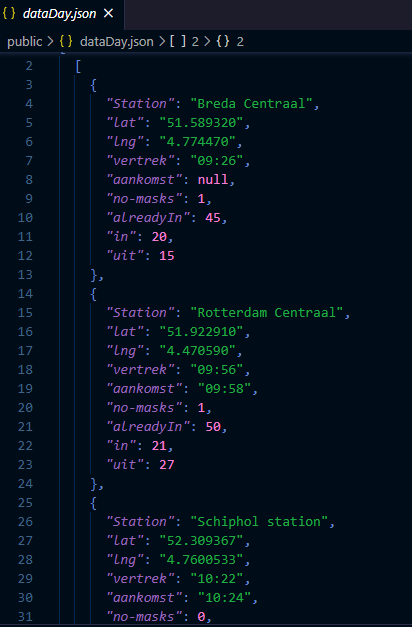
dataset from the morning
Click here for the full dataset
Going back home
To get more data we decided to write down the data from the way back home we discovered that the data changed from the day and night so we made another JSON file with this data called: night data.
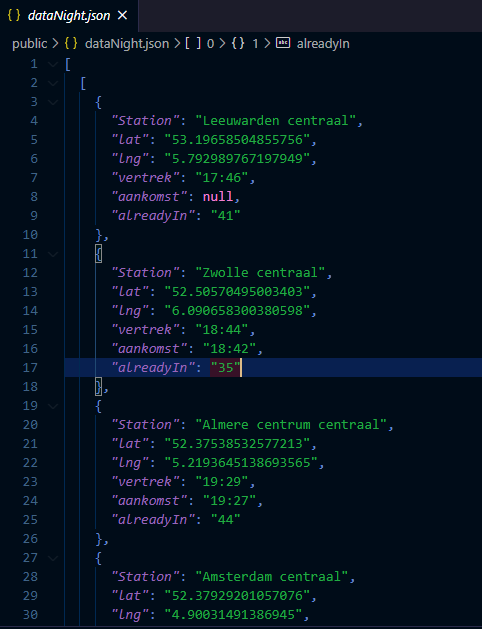
Dataset for night
Click here for the full dataset
Making the visualization
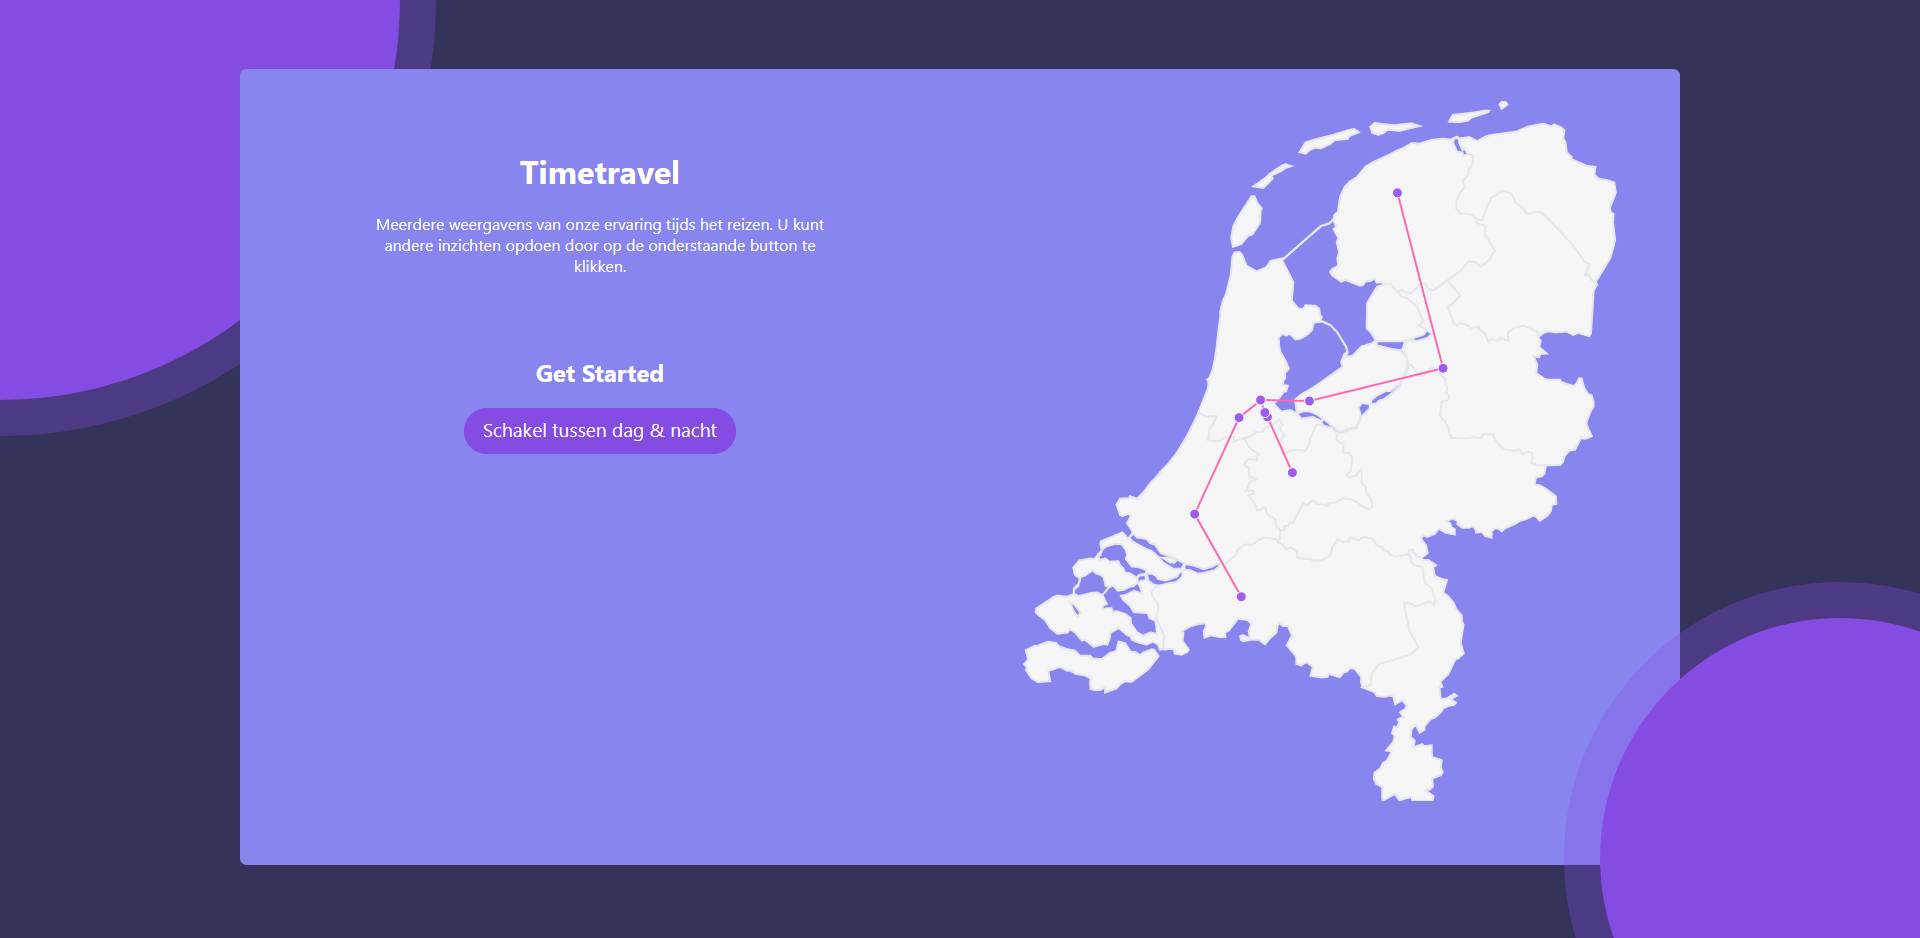
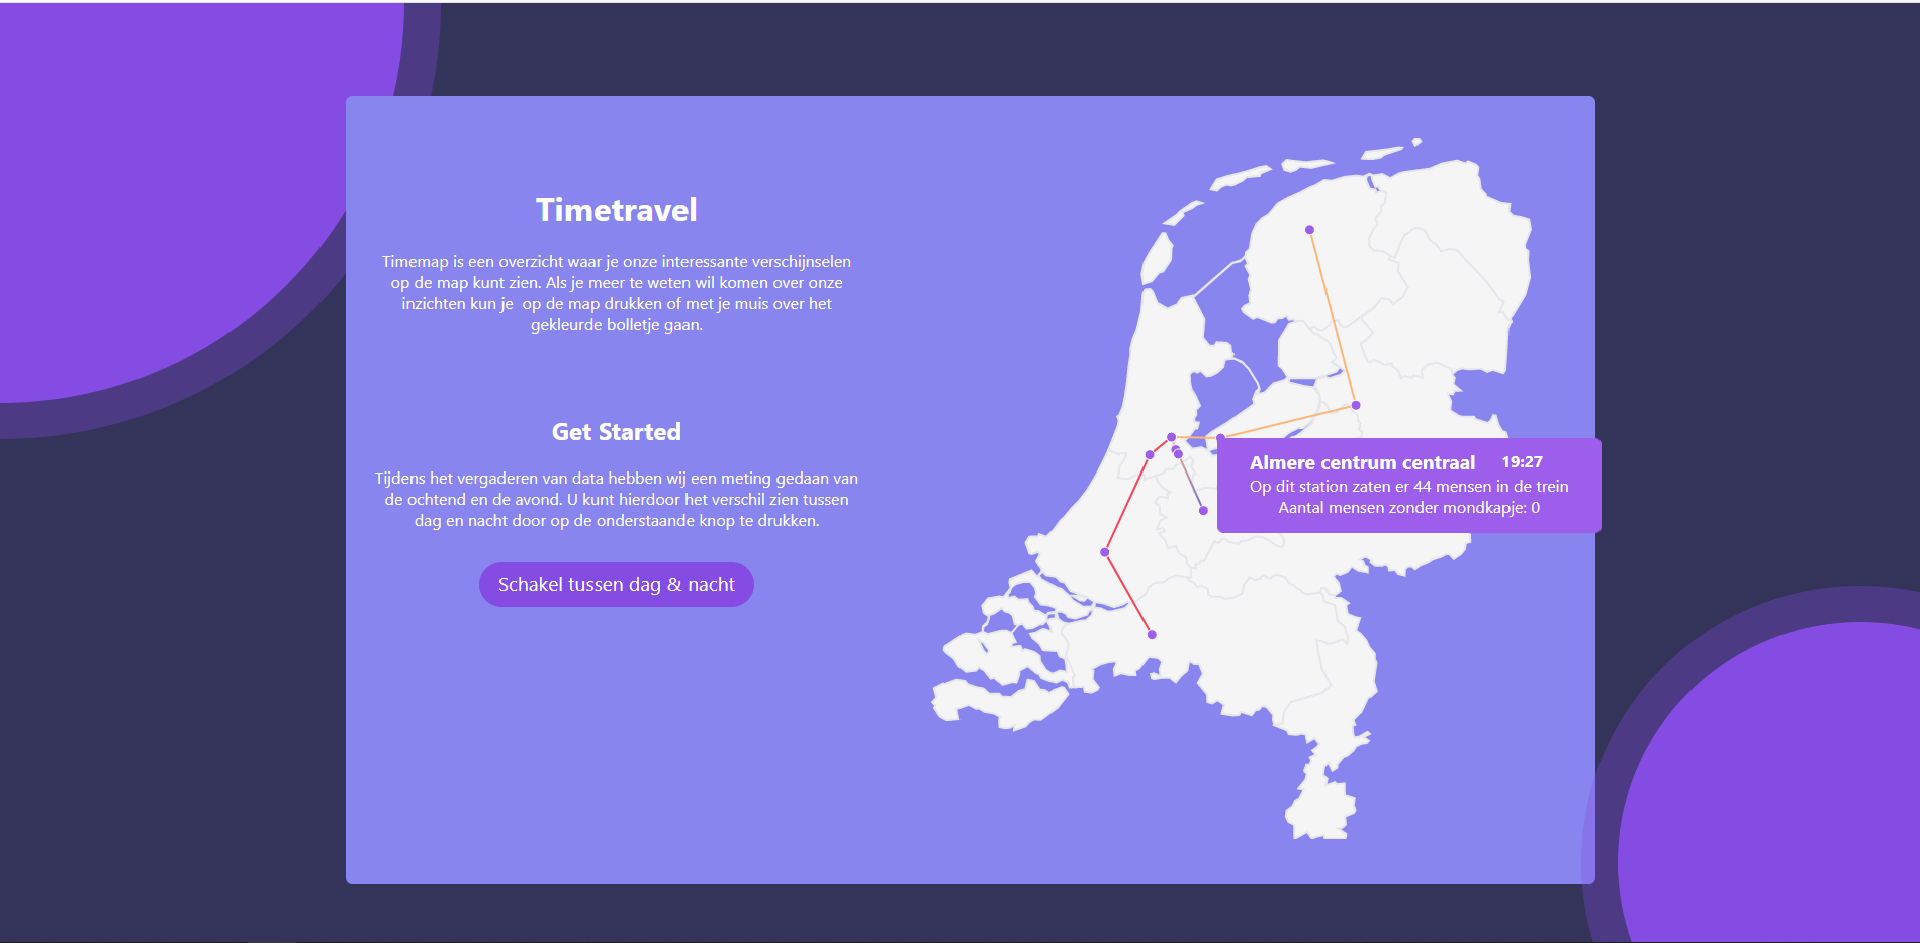
Sam and I were making a beginning at the visualization that we wanted from the design we started implementing methods such as making a map, plotting the map, zooming on click on the SVG path, and much more.
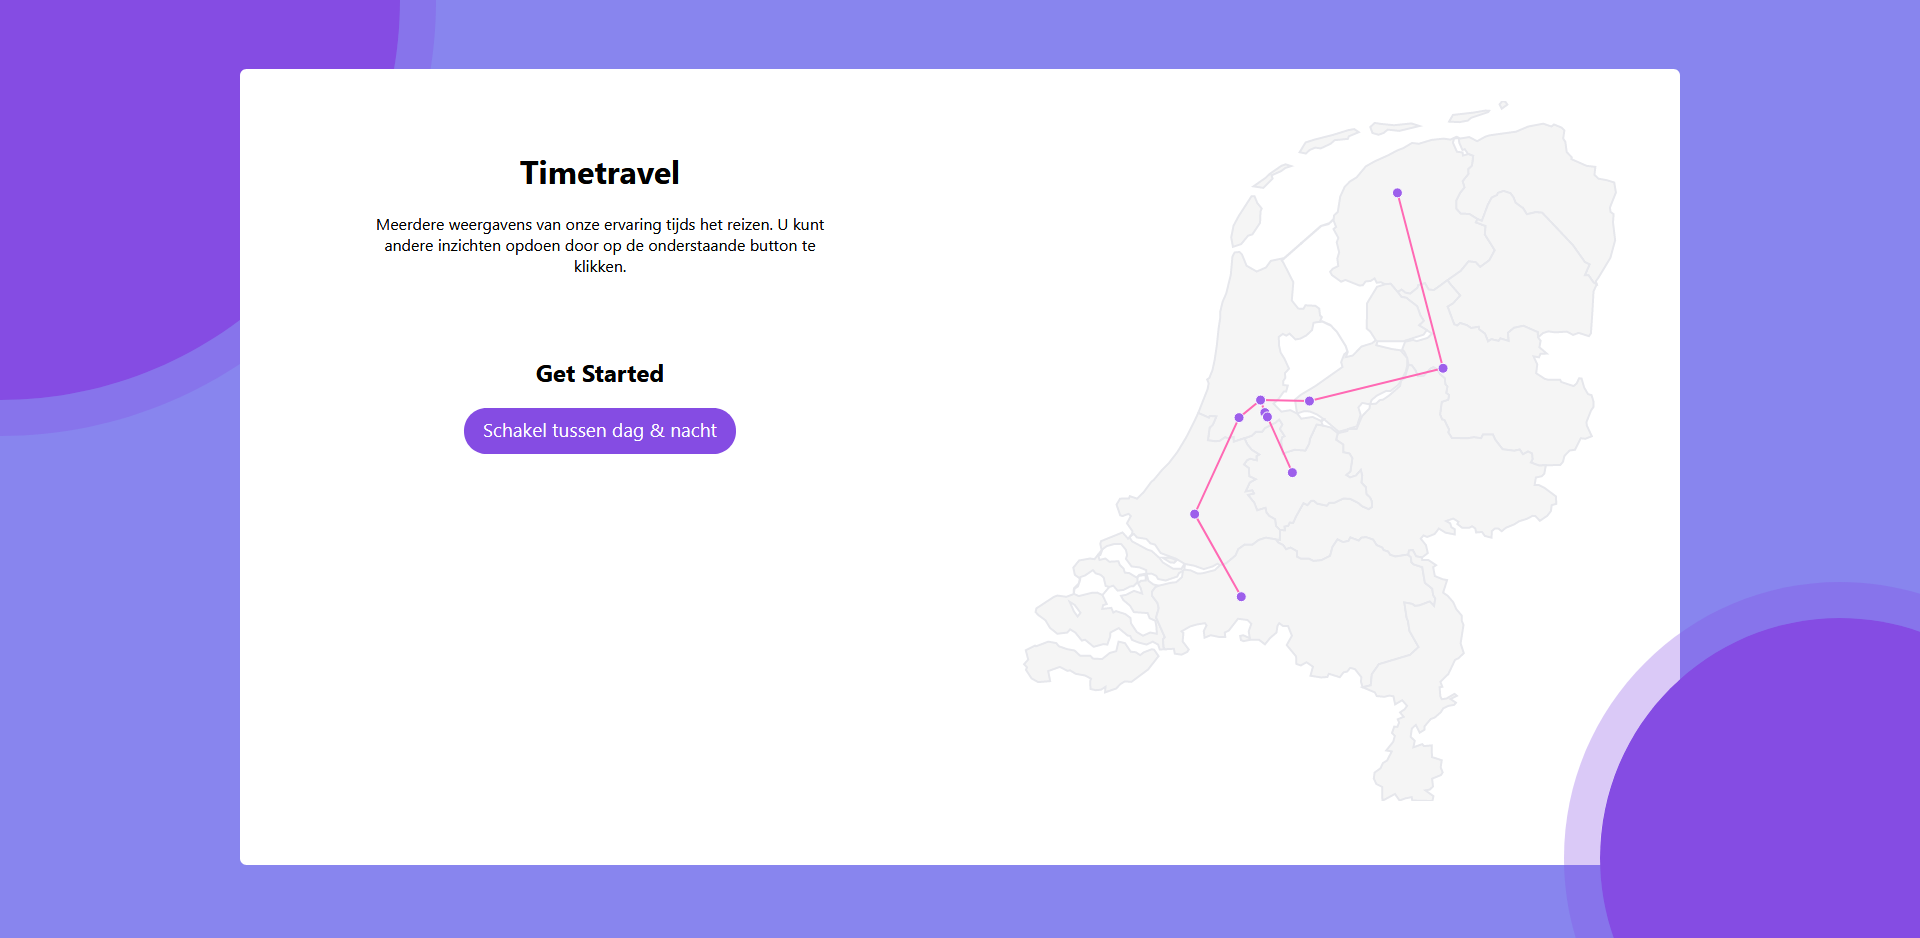
website in day mode
website in night mode
Hover state
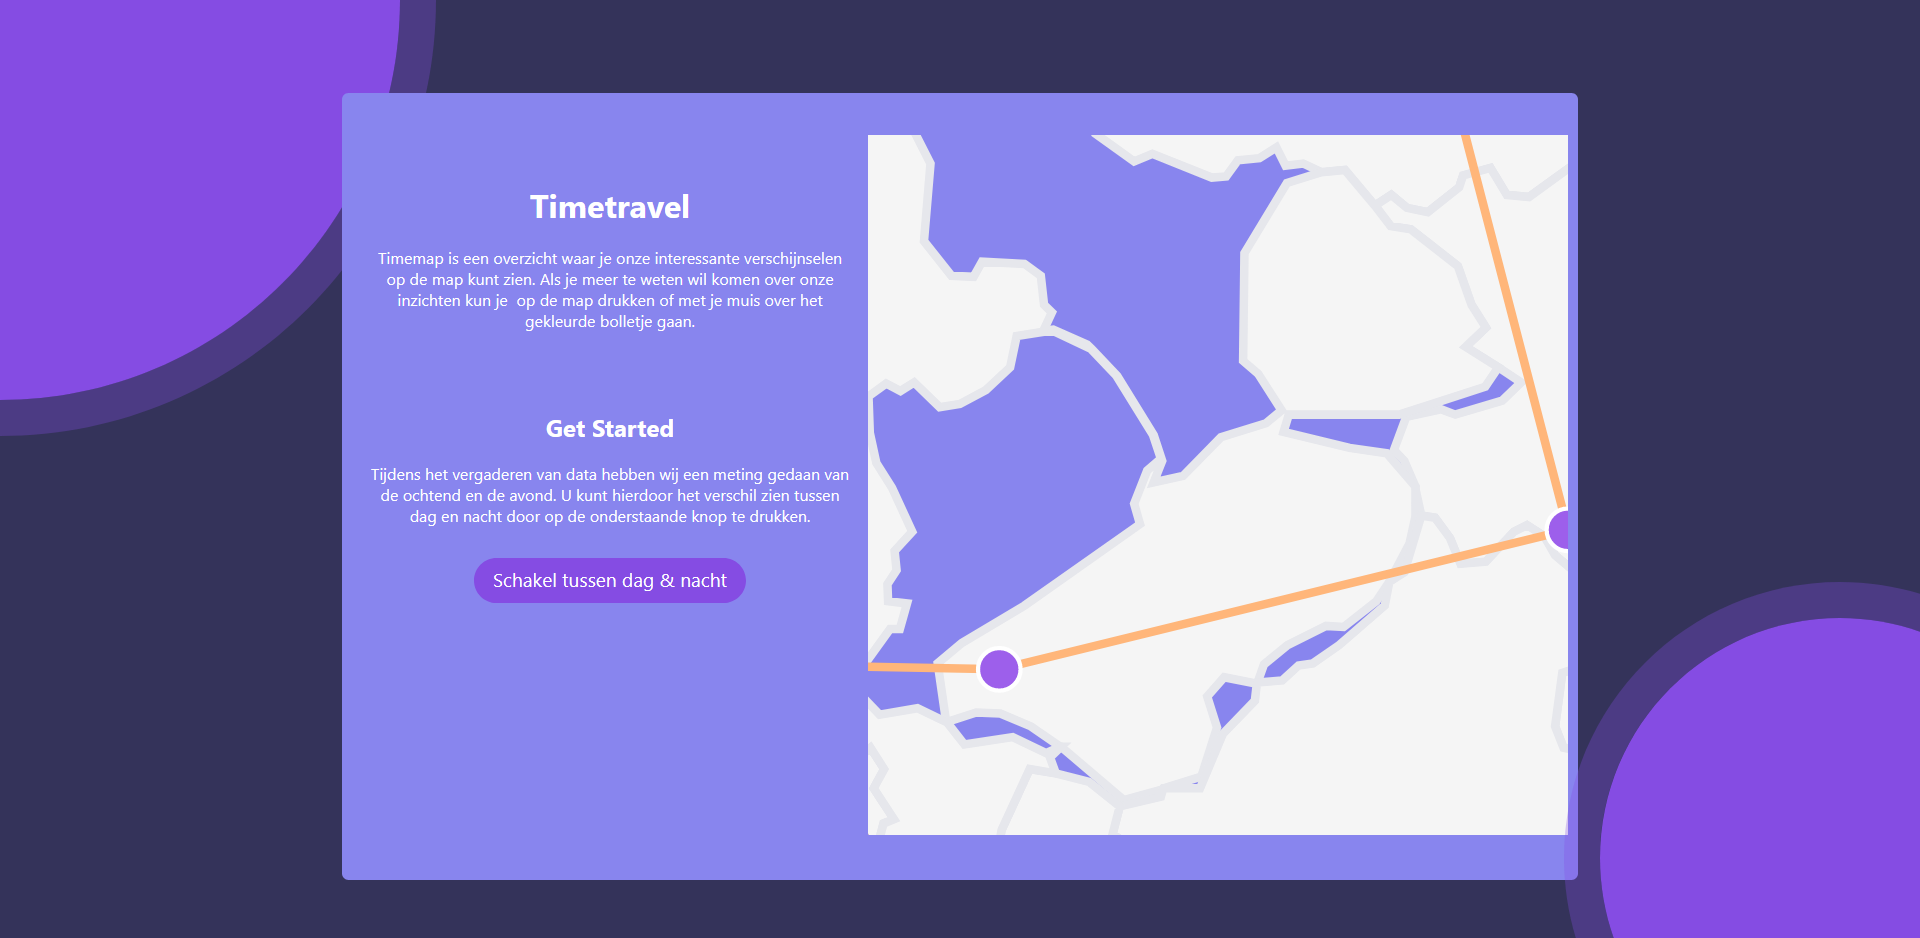
Zoom state