Optimize storage performance - VishalPatangay/My-devops-repo GitHub Wiki
What things do you need to consider to make sure that you're not introducing storage bottlenecks into your architecture?
Optimize virtual machine storage performance
Disk storage plays a critical role in the performance of your VMs. Selecting the right disk type for your application is an important decision.
When you build an infrastructure as a service (IaaS) workload, which type of disk should you use? There are four options:
Local SSD storage: Each virtual machine has a temporary disk that's backed by local SSD storage. Because this SSD is local to the virtual machine, the performance is high. But data could be lost during a maintenance event or a redeployment of the VM.
Standard storage HDD: This type of storage is spindle disk storage. It might fit well where your application isn't bound by inconsistent latency or lower levels of throughput. A dev/test workload where guaranteed performance isn't required is a great use case for this disk type.
Standard storage SSD: This SSD-backed storage has the low latency of an SSD, but with lower levels of throughput. A non-production web server is a good use case for this disk type.
Premium storage SSD: This SSD-backed storage is well suited for those workloads that are going into production and require the greatest reliability, demand consistent low latency, or need high levels of throughput and IOPS.
Optimize storage performance for your application
You've just learned how you can use different types of storage technologies to improve raw disk performance. You can also address the performance of access to data at the application layer.
Caching
A common approach to improve application performance is to integrate a caching layer between your application and your data store.
A cache typically stores data in memory and allows for fast retrieval. This data can be frequently accessed data, data that you specify from a database, or temporary data such as user state.
 Azure Cache for Redis is a caching service on Azure that stores data in memory. It's based on the open-source Redis cache and is a fully managed service offering by Microsoft.
# Polyglot persistence
Polyglot persistence is the use of different data storage technologies to handle your storage requirements.

Eventual consistency means that replica data stores eventually converge if there are no further writes. If a write is made to one of the data stores, reads from another data store might provide slightly out-of-date data. Eventual consistency enables higher scale because there's a low latency for reads and writes, instead of waiting to check if information is consistent across all stores.
Performance monitoring options in Azure
Azure Monitor
Azure Monitor provides a single management point for infrastructure-level logs and monitoring for most of your Azure services.

Application monitoring data: Data about the performance and functionality of the code you've written, regardless of its platform. Guest OS monitoring data: Data about the OS on which your application is running. This OS might be in Azure, another cloud, or on-premises. Azure resource monitoring data: Data about the operation of an Azure resource. Azure subscription monitoring data: Data about the operation and management of an Azure subscription, and data about the health and operation of Azure itself. Azure tenant monitoring data: Data about the operation of tenant-level Azure services, such as Azure Active Directory (Azure AD).
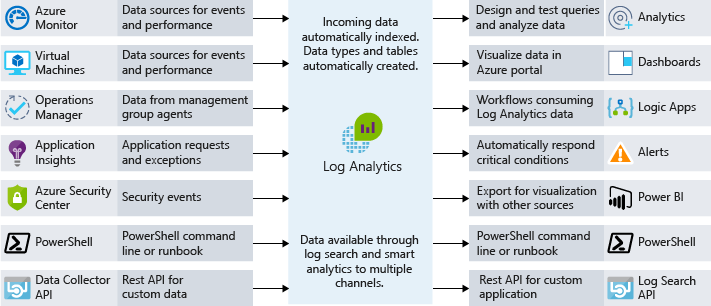
Log Analytics
This cross-source correlation can help you identify issues or performance problems that might not be evident when you look at logs or metrics individually. The following illustration shows how Log Analytics acts as a central hub for monitoring data.

Application performance management
Deep application issues are often tricky to track down. This type of scenario is when it can be beneficial to integrate telemetry into your application by using an application performance management (APM) solution. An APM solution helps you to track down low-level application performance and behavior. Telemetry can include individual page request times, exceptions within your application, and even custom metrics to track business logic.
You install a small instrumentation package in your application and then set up an Application Insights resource in the Azure portal. The instrumentation monitors your app and sends telemetry data to the portal.
Application Insights is a service to monitor availability, performance, and the use of web applications. For custom logs and metrics, you can use the HTTP Data Collector API to write data to Log Analytics from any REST API client or an Azure Logic App to write data from a custom workflow.