UsingVaa3D.wiki - Vaa3D/Vaa3D_Wiki GitHub Wiki
Content
Vaa3D is designed to have a very simple interface, and intuitive to use. Only the following two buttons are displayed when you launch Vaa3D (yet there is a main-window menu anyway). The long version of Vaa3D tutorial can be found here.
- File open: You can open files using this button. But in most cases you can also open them by just dragging-and-dropping to the main window or the 3D viewer, or clicking the respective menu buttons.
- Help: click the "information" (yellow i-button) at the left of the main window) to get a documented list of short-keys, mouse usage, etc.
The following are some frequently asked questions regarding Vaa3D usage. A long version of Vaa3D tutorial can be found in the Download page.
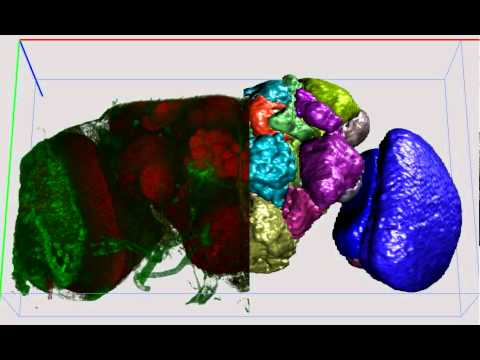
Click the “See in 3D” button or follow the main menu “Visualization”, or press “Ctrl-V” (.wiki-V for Mac), or “Shift-V” when you have an image open. Once the 3D viewer is displayed, you can press animation key “Ctrl/.wiki-A” to turn on/off the 3D rotation animation. While you are doing the animation, you can also use volume cut, surface cut, etc.
demo movie: different rendering modes
Just drag and drop the files into Vaa3D main window or an already opened 3D viewer. In the former case, a new 3D viewer will be opened for the file; in the latter case, the file will be opened in the existing 3D viewer and thus you can visualize the newly open data side-by-side with the existing data.
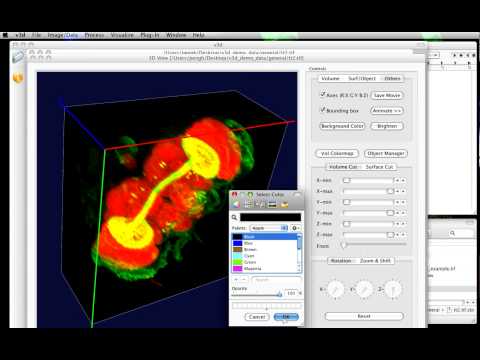
demo movie: 3D image/surface visualization
(see more demo movies at the Tutorial Movies page)
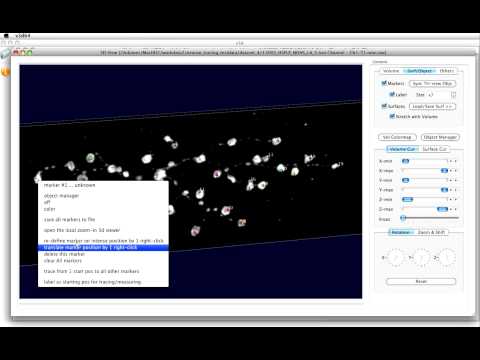
There are several modes to do that. Suppose you have a 3D viewer open, you can right click your mouse while you mouse is in the image area. You can choose from the pop-up menu which the method you’d like to use to pinpoint a 3D location.
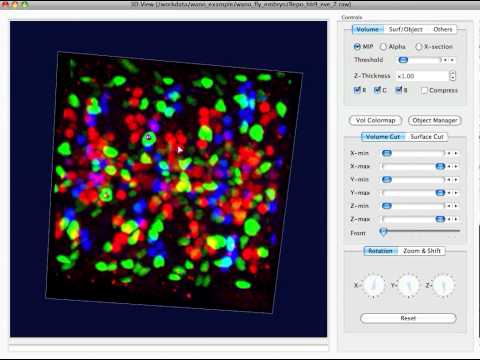
- If you choose one-right-click pinpointing, Vaa3D lets you continue doing so at multiple locations without stopping, - you can press “Esc” key to quit that mode. movie: one-click pinpointing When the image signal is not in the first (i.e. red) channel, but in the 2nd (green) or 3rd (blue) channel, you can press the number key ‘2’, ‘3’, while you are right-clicking the mouse, to specify which channel to use.
demo movie: one-click pinpointing
- If you choose two-right-click pinpointing, you will need to right click once the mouse at the target location while you are seeing it, and rotate the image a bit, and right-click the target location again.
demo movie: two-click 3D pinpointing
A marker will be placed at the location where you have pinpointed (of course you need to ensure the markers are visible).
On the other hand, you may also define markers in a tri-view window directly. Just right-click you mouse at the target location and press “Ctrl/.wiki-M” key. You can synchronize the markers display in the 3D viewer by selecting the “Surf/Object” tab in the 3D viewer and pressing the “Sync tri-view obis”.
Just follow the main menu “Data/Image”, “Process”, and “Plugins”. There are also 3D image analysis functions (e.g. neuron tracing) in the pop-up menus of the 3D viewer.
You can also write your plugin program for Vaa3D, - the simplest way is to revise from the plugin examples provided at this website and then compile (of course you need to set up QT and a proper C++ complier).
You can annotate/measure anywhere in the image by defining 3D landmarks or a 3D line or a 3D curve. To define landmarks, just press “M” key in tri-view window, or “Right-click” mouse on an image in the 3D viewer. To define a 3D line or a 3D curve, see detailed below.
If you want to annotate/measure the region information at a spatial location, you should first define a marker there. Once you have a marker, you can see various regional statistical information in the “Landmark Property” dialog (you can also change the shape and radius of the region and get the re-computed statistics right away). In the tri-view main window, you can access it by either double-click a marker and then follow the guide in the pop-up dialog, or use the landmark manager (from the main menu). In a 3D- viewer window, you can access the “Landmark property” dialog by right-clicking a marker and choose the first item in the pop-up menu. In the “Landmark property” dialog you can change the measurement channel, radius and shape of the surrounding measurement region of a marker and see the statistics (e.g. mean and std of a region, anisotropy of that region) right-away. You can also annotate (via text editing) the marker location. You can export the markers’ location and annotation, as well as the statistics, by either saving the respective landmarks into a plain text file (.marker file, which has the simple CSV - comma separated values - format), or export it as an .APO file (pointcloud file, also in the CSV format).
If you want to measure the intensity profile of image voxels along a 3D straight line, you can first define two 3D markers. Then you right-click the first point in the 3D viewer and from the pop-up menu choose “label as starting pos for tracing/measuring”; and then right-click the second point and from the pop-up menu choose “line profile from the starting pos”. Then you can see the line profile for separate color channels.
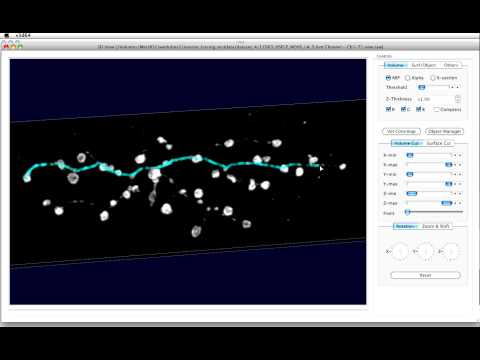
If you want to measure the intensity profile of image voxels along a 3D curve (or a polyline), you can use the Profiling tool developed for neuron segments. To do that, you can first draw a 3D curve using the Vaa3D-Neuron 2.0 function, by right clicking the image area in the 3D viewer, and from the pop-up menu choose “1-right-stroke to define a 3D curve” and then use the mouse to follow the image intensity and directly define a 3D curve in the 3D space. Or, you can use other neuron tracing methods (e.g. Vaa3D-Neuron 1.0 functions) or 3D curve drawing method (e.g. 2-right-stroke drawing), to define the 3D curved trajectory you want to profile. Once you have determined such a curve, you can right click it and from the pop-up menu select “neuron-segment intensity profile”. This can be seen in the last few frames of the Vaa3D Neuron 2.0 demo movie.
Follow the main menu and the “Export” menu, or the pop-up menu in the 3D viewer. The “Save” functions of course are context-sensitive, -- if you are working on different types of data (image or various surface objects), you will see different pop-up menus.
There are several ways in the Vaa3D-Neuron module to trace, visualize, and measure the morphology of the 3D structure of a neuron. There are also some built-in functions for comparing various neurons or geometrically transform them. If you are using Vaa3D-Neuron 1.0, you can following an instruction here one neuron-tracing test dataset (9M). You can watch a demo movie of Vaa3D-Neuron 1.0 tracing and editing. (Note: if you’d like to repeat this experiment, on some machines that may have different numerical precision of floating numbers, you may need to turn on the “full image” checkbox in the “Curve tracing parameters” dialog to ensure the entire image, but not only the “foreground” voxels - defined as whose intensity are above the mean intensity of the image, will be searched.)
If you are using the alpha-testing version of Vaa3D-Neuron 2.0, one additional feature is that you can use your computer mouse (or a tablet pen) to move over where you want to define the a curved structure in the neuron; Vaa3D can automatically use that information to produce a 3D reconstructed path (with all 3D XYZ information!). This function is called “paint-and-trace”, and is a semi-automatic method which is designed to trace the place in an image where only a human user is able to tell what is the signal and what is not. Combined with the automatic path finding and editing functions in Vaa3D-Neuron 1.0, Vaa3D-Neuron 2.0 is able to trace very complicated neuron structure in a fairly easy way.
Similar to the 3D pinpointing, when using the 1-stroke paint-and-trace function, if the image signal is not in the first (i.e. red) channel, but in the 2nd (green) or 3rd (blue) channel, you can press the number key ‘2’, ‘3’ to specify the channel to use.
demo movie: Vaa3D Neuron 1.0
demo movie: Vaa3D Neuron 2.0
Each time point should be a separate image stack (which should have the same dimensions and the same number of color channels); it will be better to make their file names have the convention like xxxxx_001.tif, xxxxx_002.tif, etc. They should be pre-converted to 8-bit data. Put all of them into a separate folder. Then choose the Vaa3D main menu “File -> Import -> Import general image series to an image stack”, or press “Ctrl/.wiki-I” key. Then choose one of the image in the folder, and you will see a pop-up dialog. Change the option of “Pack images in ‘Z’ dimension” to “Pack images in channel dimension”. Then you will open the image series as a single “stack” with many “channels”. Then you can open the 3D viewer for this stack (just press “Ctrl/.wiki-V” or use the respective menu/button). The time axis is displayed right below the 3D-view of the image in the 3D viewer. You can drag it forward or backward, or combine it with animation key “Ctrl/.wiki-A”, to see the 5D rendered time series.
There is a 5D_Stack_Converter plugin with the recent Vaa3D release. If you have imported an image series as “Pack images in ‘Z’ dimension”, you can use that plugin program to convert back and forth the 5D data.
You can find a simplified (indeed unfinished) User Manual below
Follow your intuition and feel free to ask when you cannot figure out a solution.In Vaa3D, indeed most functions are obvious, - thus if you use some image analysis software before, you can just follow your common-sense and do not really need much help. For example, in the tri-view, if you zoom-in the image, you can actually pan the image around, just like Google Map. Another function is that you can have dual-looking-glasses in a tri-view to help you much better check the image data. These functions are in a lot of situations are very useful, - yet because they are intuitive, thus I did not document them in details.
Feel free to send me an email if you have cannot find answers here to your questions.