How to Create SMR Displays - VATSIM-UK/UK-Sector-File GitHub Wiki
Intro
This guide applies to starting a new SMR from scratch, but a very similar process can be followed when updating exisiting SMRs, with the exception that an exisiting KMZ file should be included in the _data/SMR Files folder which can be updated. See also this page of the wiki.
Software Required
- Google Earth Pro
- KMZ to SCT converter - Suggest http://fsmine.dhis.org/euroscope/design/
- A good text editor - E.g. Notepad++ or similar
Drawing The Layout
Lines such as holding point bars reside in the [GEO] section of the Sector File and should be drawn using the path tool in Google Earth.
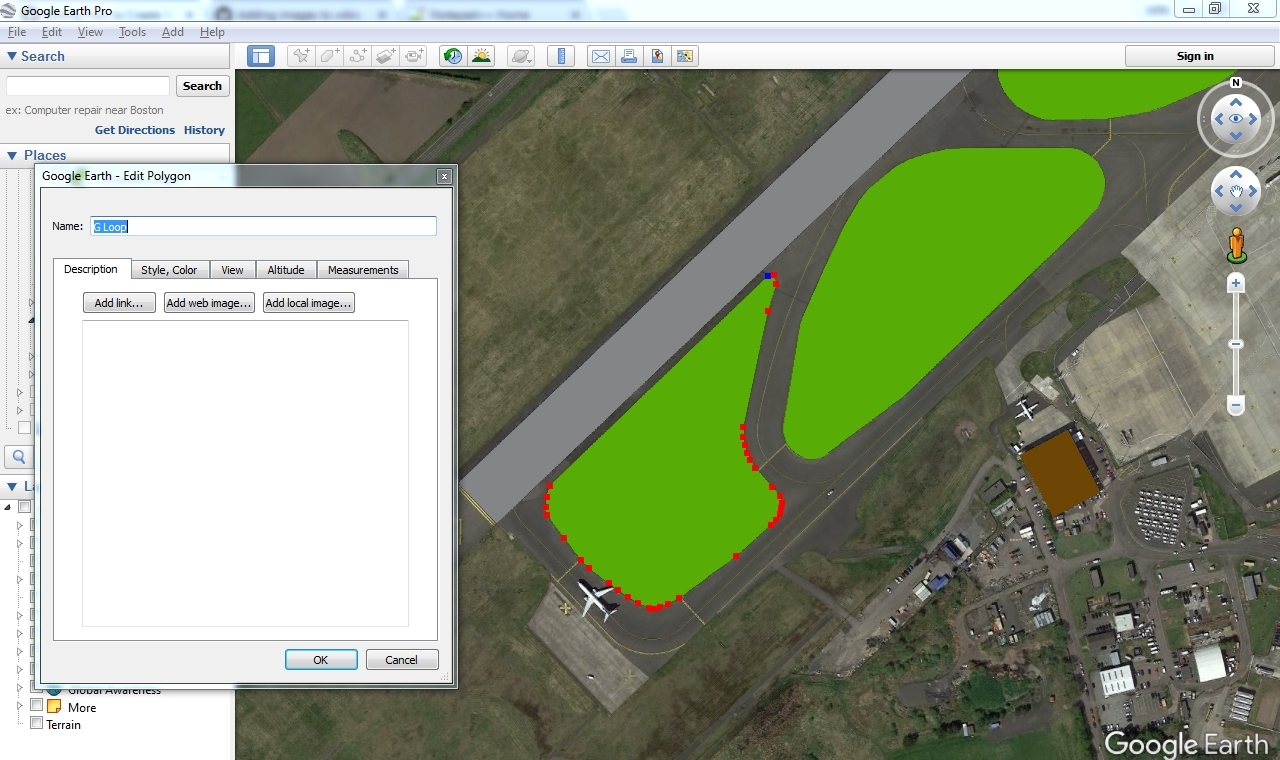
Blocks of colour such as areas of grass are drawn using Google Earth's polygon tool (as shown below) and will be included in the [REGIONS] section of the Sector File.
The drawings on Google Earth should include the following
- Aprons and Taxiways
- Grass Areas
- Revelant Buildings
- Disused Areas (as applicable)
- Holding Points
Using Image Overlays
Sometimes, the aerial image provided by Google isn't up to date, and will not reflect the current layout of the airfield. In these situations, you can use the image overlay tool in Google Earth to overlay a chart image to use as a template.
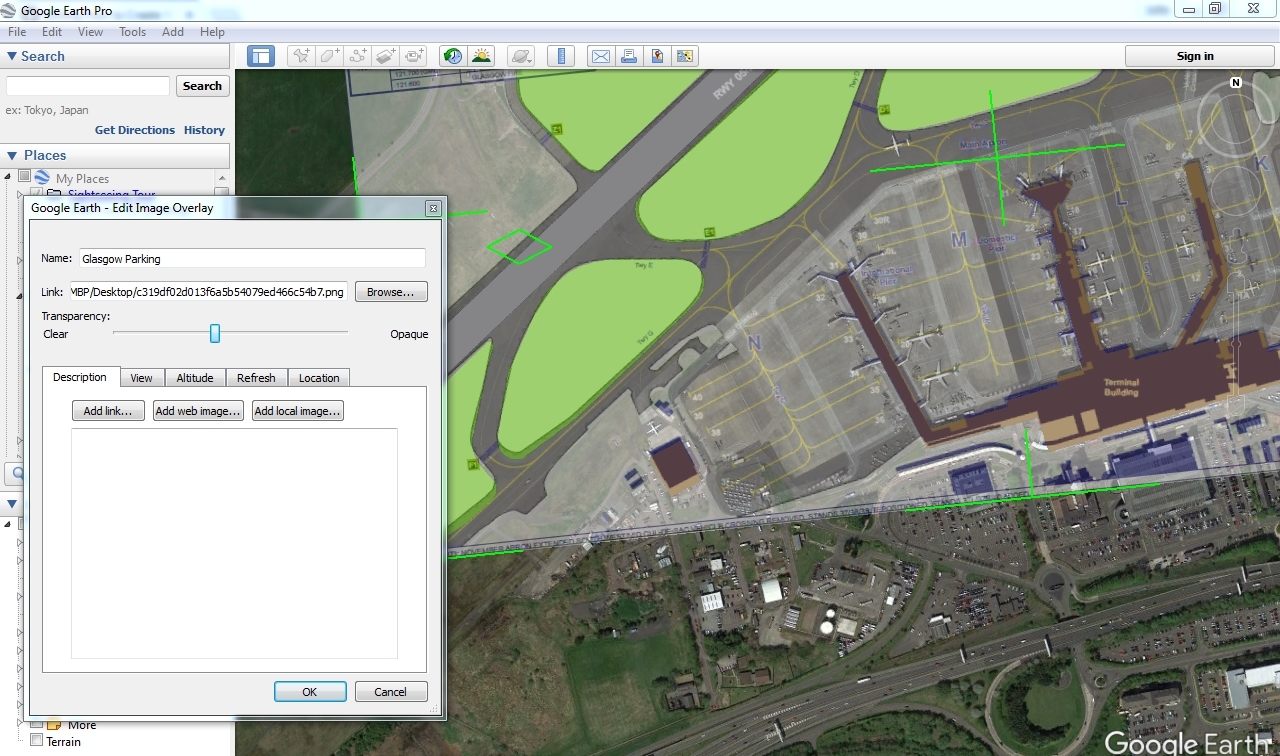
The image below shows a new, amended parking chart, overlaid on Glasgow. To get the chart as a usable image, use a tool such as https://pdfcandy.com/pdf-to-bmp.html to convert the Chart PDF from the upcoming AIP (or if resolution isn't as important taking a screenshot of the chart might be sufficient). To overlay it click Add then Image Overlay (alternatively press Ctrl + Shift + O). Lower the transparency and adjust until correctly oriented. Hold shift when you scale to preserve the aspect ratio. Use the runway, buildings and taxiways to align the chart as best as you can.
In the example below, cul-de-sac N has been extended to include stand 37.
Understanding EuroScope Draw Order
EuroScope reads the data from the Sector File sequentially and as such, will draw regions on top of one another. It is important to plan the order in which regions are drawn, to not only ensure that the data is displayed correctly, but if managed well, this will reduce the amount of data, reducing associated loading time.
The order for this particular SMR is:-
- Apron/Taxiway
- Runway
- Disused Areas
- Grass Areas
- Buildings
Therefore the first section in the [REGIONS] data will be the aprons, the last will be the buildings.
Converting KMZ to SCT
Once all areas have been completely drawn in Google Earth, they should be placed in a suitable folder structure and packaged as one KMZ file. If you use folders well, you can ensure the draw order is correct, and sort alphabetically within a folder (e.g. the holding points) saving having the order them manually later).
If the KMZ is in temporary places right click and Save to My Places. Once the KMZ is in My Places press right click again and Save Place As. Ensure you upload the KMZ into the appropriate folder in the _data/SMR Files folder so it can be developed upon when future changes are required.
The file can then be parsed by a converter to convert into the SCT format.
The output of the converter should then be checked, comments added and the relevant parts moved to the GEO and REGION files in the SMR folder for the airport.
Regions Data
The data for this should be placed in \Airports\[ICAO]\SMR\Regions.txt
The compiler will call for this data in the [REGIONS] Section
This data should be in the format of single coordinates. i.e. EuroScope will attempt to join any gaps, such that it will create a polygon.
The regions should begin with a commented line, describing the object, area or feature.
This should be followed by "REGIONNAME [Airport]" It is important to name all the region objects for a single SMR display the same so that it will display one option for the whole of an airfield.
The first line of coordinates should be prefixed by the colour definition e.g. "terminal". Colours are defined as explained here, and a list of pre-existing colours can be found in that file.
An example of one region object is shown below.
;Gama_Hangars
REGIONNAME Glasgow
terminal N055.52.18.009 W004.25.30.965
N055.52.17.533 W004.25.28.636
N055.52.20.992 W004.25.26.411
N055.52.21.486 W004.25.28.800
GEO Data
The data for this should be placed in \Airports\[ICAO]\SMR\Geo.txt
The compiler will call for this data in the [GEO] Section
This will generally only include lines for holding points, unless centrelines or stand lines appear on the real world SMR.
This data should be in the format of point to point (sets of) coordinates. i.e. EuroScope will draw a line from the first point, to the point on the same line
The coordinates should be followed by a colour definition e.g."smrYellow" and a comment (anything after a ;) to identify what the line shows. Comments can also be used to separate these into blocks, such as hold lines and stand lines, and each block should be in alphanumberic order.
For example:
EGPF Glasgow                  S999.00.00.000 E999.00.00.000 S999.00.00.000 E999.00.00.000
;Holding points
N055.52.42.599 W004.25.07.090 N055.52.42.631 W004.25.06.005 smrYellow ;A1
N055.52.39.081 W004.25.09.844 N055.52.38.628 W004.25.09.177 smrYellow ;A2
N055.52.16.535 W004.25.40.292 N055.52.16.304 W004.25.39.186 smrYellow ;A3
N055.52.36.299 W004.25.19.012 N055.52.36.625 W004.25.17.074 smrYellow ;B1
Labels
The data for this should be placed in \Airports\[ICAO]\SMR\Labels.txt
The compiler will call for this data in the [LABELS] Section
The data should be either taken from the associated textual data (e.g for stand positions) or can be created using the .sline command in EuroScope to provide an uncluttered display (e.g. for Holding Point labels).
The text you wish to display should be at the start of the line with quote marks ("") surrounding it, followed by the coordinates, followed by a colour defintion such as standHold.
Again commented blocks should be used where appropriate and the labels placed in alphanumeric order within blocks, for example:
;Holding Points
"A1" N054.39.47.986 W006.11.50.773 standHold
"A2" N054.39.48.474 W006.11.57.580 standHold
"A3" N054.39.41.214 W006.12.25.046 standHold
"B" N054.39.32.855 W006.12.51.062 standHold
Testing and Common Problems
To test your work as you go, use of the compiler locally is encouraged, as explained in detail here. Once compiled, use the OPEN SCT menu to load your new Sector File, then re-open the ASR view you were using to test your display.
-
If you create a new label that doesn't already exist in the pack you will need to tell euroscope to display it: Click
Other Set->Display Settings ...-> ExpandFree Text-> TickSCT2. -
If changes made to the REGION or GEO files don't show up make sure that your ASR file isn't pointing to an old sector file: Open the ASR file you are using and remove reference to the old sector file. Re open the ASR in euroscope. For example the generic smr
UK\Data\ASR\FID\Generic SMR.asrshould look like this at the top:
DisplayTypeName:SMR radar display
DisplayTypeNeedRadarContent:0
DisplayTypeGeoReferenced:1
SECTORFILE:
SECTORTITLE:
Help
Help is provided on the VATSIM UK Discord and VATSIM UK Community Forums . So if you have any questions or are struggling with anything, put a topic up in the forum or a message in the #sector-file-development channel on Discord and someone will help!