reportbuilder - Unity-Technologies/unity-ads GitHub Wiki
/*
Title: Using the Report Builder
Sort: 9
*/
This article provides a comprehensive look at each setting for your campaigns.
- Working with Dashboards
- Working with Data Cubes
- Working with dimensions
- Working with Measure metrics
- Examples and tips
Report Builder is an easy-to-use drag and drop reporting tool available from the Acquire dashboard. Use the Report Builder’s data visualizations to:
- Analyze performance metrics and gain deeper insights into your campaign data.
- Visualize data through your preferred chart options.
- Troubleshoot campaign performance.
- Filter data in ways that provide actionable insights.
- Compare based on single or multiple dimensions.
Use Report Builder as a standalone tool, or to supplement your own business intelligence tools, including data you collect using Unity’s Advertiser Statistics API.
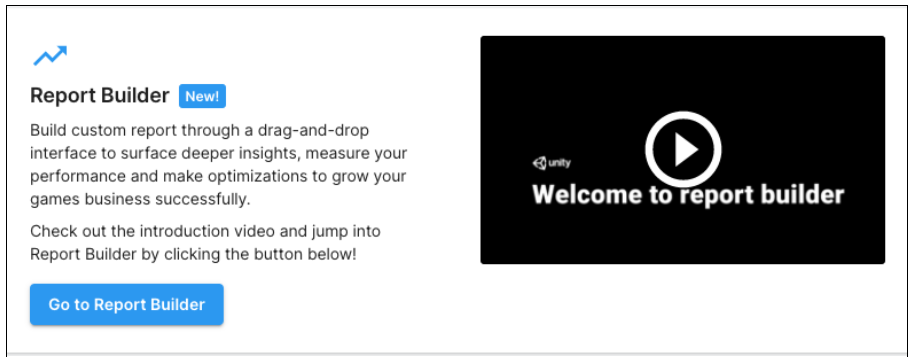
- Click Reporting from the Acquire dashboard left menu. Acquire dashboard.
- In the Report Builder section, play the video for a brief introduction, then click Go to Report Builder.
The Report Builder landing page displays two sections: Data Cubes and Dashboards.
- Data Cubes provide granular report filtering, so that you can drill down and easily modify what is displayed.
- Dashboards provide holistic overviews of campaign performance.
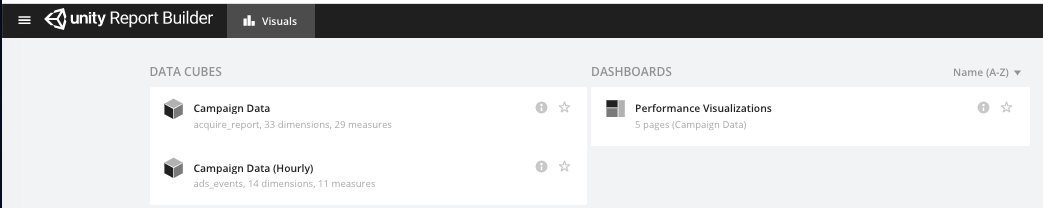
Dashboards provide a comprehensive view of your campaigns, while data cubes let you drill down or filter over 35 dimensions and over a dozen metrics.
To start with a big picture view, click Performance Visualizations under Dashboards.
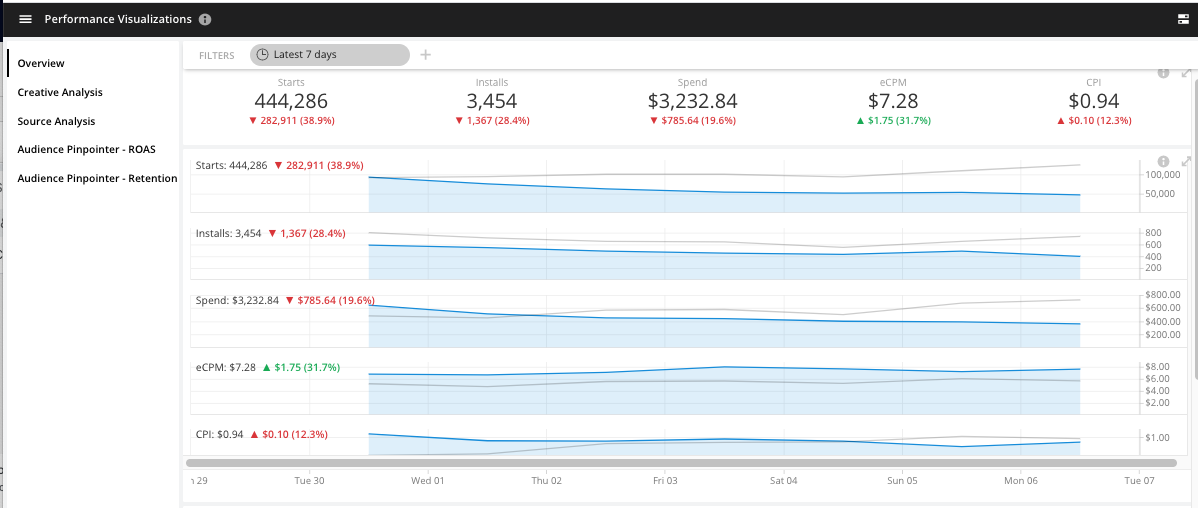
The first dashboard you will see is the Overview. Under each value, a positive or negative value reflects the difference between this and the last similar period. To help you spot trends, positive values appear green with an up-arrow, while negative values appear red with a down-arrow.
The top section provides an overview of your cumulative campaign performance over the specified time period (the default is Latest 7 days). The overview tracks the following metrics:
- Starts: The number of times a user viewed your ad. Starts are commonly called impressions.
- Installs: The number of times an install was attributed to your ads.
- Spend: The total budget spent in this period, based on number of installs and cost per install.
- eCPM: Effective cost per mille is the estimated cost per 1,000 impressions shown.
- CPI: Cost per install.
- CVR (Installs/Starts): Conversion rate is the total number of installs divided by the number of starts or impressions.
You can change the dashboard, time period, and other filters.

- Use the left menu to choose a performance visualization.
- Click Latest 7 days to select from a list of choices for filtering the time period shown.
- Click the + icon to select from a list of dimensions to filter by.
Click the settings icon in the upper-right corner to configure time zone, update frequency, and caching options.

- Set the timezone for the period of the data displayed.
- Set how often the data refreshes. You can click the refresh icon at any time to manually update the data.
- Set whether to enable caching.
- Click View Essence to see the programmatic expression of your data filters.
As you scroll through the performance dashboards, you’ll see additional tables. Click the double-arrow icon to expand any of the Performance Overview sections. This will switch you to Data Cube mode, where you can drill down further.
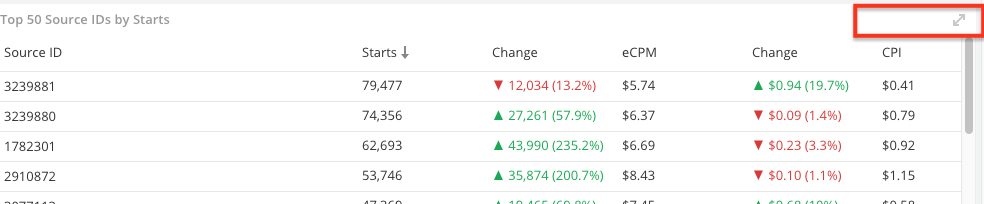
The green or red value beneath each metric shows the positive or negative delta (change) from a similar period, as both a total number and a percentage.
For example, the image below shows the number of Starts for your campaigns in the last 7 days, compared to the previous 7-day period.

In this case, your ads were viewed over 3 million times, representing a 646,256 (or 24.1%) increase from the number of times your ads were viewed in the previous 7-day period. For more information, see the section about comparisons.
To build custom reports, choose the Data Cube you want.

Data Cubes allow you to explore and visualize data from different angles, customizing metrics, chart types, dimensions, and displays.
When you open a Data Cube, a list of dimensions appears in the left column.

Add dimensions as building blocks for your reports. Use the FILTER field to restrict the range of data that appears in the report, and the SHOW field to specify what data fields appears in the report.
Note: A dimension can appear in both the FILTER and SHOW bar.
Example: Suppose you want to study a portion of the countries your campaign runs in. Drag the country dimension to the FILTER bar, then select the countries you want to include. Then, to see the countries listed as a column header, and to be able to sort by them, drag "country" to the SHOW bar.
To apply dimensions to your report either:
- drag the dimension from the left panel to the + symbol in the FILTER or SHOW bar.

- highlight a dimension in the left panel, then use the context menu to select Filter or Show. The Add button also allows you to sort how the data appears, and limit what appears.
When you drag a dimension to the FILTER bar, a popup appears:

This image shows a report that displays only iOS data, and only data from the last 30 days. The table that appears will list results according to OS version.
For more about refining filter results, see Using filters.

- Move dimensions on the SHOW bar into the order in which you want to display results.
- After you drag a dimension to the SHOW bar, the display will change to reflect this new field.
| **Dimension** | **Description** |
| Time | The time period for which to display data. |
| Campaign Billing Type | Can be either CPI (cost per install) with Android campaigns or CPM (cost per impression) with iOS campaigns. |
| Campaign Goal | The bid type of the campaign (e.g. standard CPI, ROAS, or Retention). This is the same as the Campaign Type. |
| Campaign ID | The unique identifier of individual campaigns. |
| Campaign Name | The names of included campaigns. |
| Campaign Set ID | The unique numerical identifier of the app plus platform combination. |
| Campaign Set Name | The name of the app plus platform combination. |
| Connection Type | The connection to the internet (WIFI or Cellular). |
| COPPA | Indicates whether the source app’s target audience is under 13 years old in the United States in accordance with COPPA compliance. |
| Country | The user’s country. |
| Creative Pack ID | The unique identifier of the creative pack (including ad format and end card). |
| Creative Pack Name | The name of the creative pack, which is the content of your ad campaign. |
| Creative Type | The type of creative (video, playable, or video & playable end card). |
| Device Language | The language settings of the device. |
| Device Manufacturer | The manufacturer of the device. |
| Device Orientation | The screen orientation of the device (portrait or landscape). |
| Device Type | The specific device type where the ad serves (both Android and iOS). Please note that data for Android devices is available from March 7th, 2022 onwards. |
| Limited Ad Tracking (iOS) | The LAT setting of the device (enabled or disabled). |
| Organization ID | Unique identifier of the account Organization. |
| OS Version | The device’s operating system version. |
| Platform | The user’s platform (Android or iOS). |
| Reach Extension | The source of the user. Either Unity or Exchanges. |
| ROAS type | The type of ROAS campaign. This can be either ad revenue, in-app purchases, or both. Note: Use this dimension in tandem with the Campaign goal - ROAS dimension to filter out possible null values. |
| Screen density (Android) | How many pixels appear within a constant area of the display. See [Android pixel size documentation](https://developer.android.com/training/multiscreen/screendensities) . |
| Screen Size (Android) | Amount of physical space available for displaying an interface. See [Android screen size documentation](https://developer.android.com/training/multiscreen/screensizes) . |
| SKAD Conversion Value | A single number between 0 and 63. This is sent by an app after it is installed, included in the SKAdNetwork postback sent to the advertising network responsible for the app install or app reinstall. |
| SKAD Enabled | True for devices that support Apple's SKAdNetwork. This field will give you better visibility into traffic that is coming from SKAd. |
| Source App ID | The alpha-numeric identifier of the app that displayed your ad. |
| Source Bids Enabled | Indicates whether the source bidding feature is enabled. |
| Source Category | The app store category of the app that displayed your ad. |
| Target CPI | The targeted cost per install (tCPI). |
| Target Game ID | The unique identifier of the target (advertised app). |
| Target Game Name | The target (advertised app) name. |
| Target Game Category | The app store category of the game or app being advertised. |
| Target Store ID | The identifier of the app listing on the Google Play or Apple App store. |
| Video Orientation | The screen orientation of the creative (portrait or landscape). |
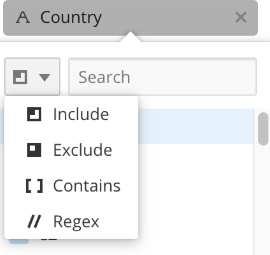
Apply filters to your data to gain powerful insight into campaign performance. You can apply filters to any dimensions. To refine a filter, drag a dimension to the + symbol on the FILTER field, then click to open its context menu.
Apply parameters using the following operations:
| **Operation** | **Description** | **Example** |
| Include | Use this operation to include the selected dimension parameters in your report. Anything not checked is excluded from the report for the corresponding dimension. | To isolate campaign data for Android users:
|
| Exclude | Use this operation to exclude the selected dimension parameters from your report. Anything not checked is included in the report for the corresponding dimension. | To isolate campaign data for users that are not in the U.S.:
|
| Contains | Use this operation to include any dimension parameters containing a partial string. | To isolate campaign data for users that are running some version of the iOS 13 operating system:
|
| Regex | Use this operation to specify custom or compound parameters to include in your report. Some common examples include fuzzy matches, grouping, and "or" statements.
For more information, see section on regular expressions. |
To isolate campaign data for three specific target games:
|
Report Builder filters support regular expressions, or sequences of characters that define a search pattern. To apply regex operations to a filter dimension, select Regex from the operations dropdown that appears when you click a dimension on the FILTER BAR.
Regex arguments are case- and space-sensitive. For more information about how to use them, read the following example and regular expressions.
Note: If you see null, 00000000, or similar values in the reporting output, this indicates that Unity cannot show the correct value.
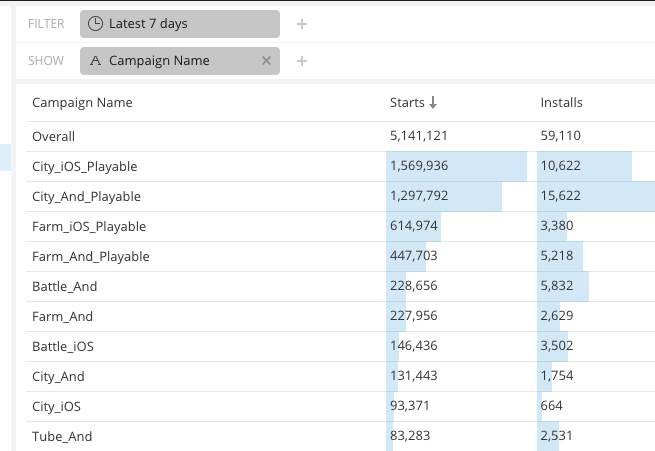
Suppose you have a default report view that displays all data from all campaigns within the last 7 days, and you would like to see specific campaigns.
First, drag Campaign Name from the DIMENSIONS panel to the SHOW field:
What if you want to study only those campaigns with the words Farm or City? To do this, add a filter for Campaign Name, using the **Regex **option, with the text "Farm|City":
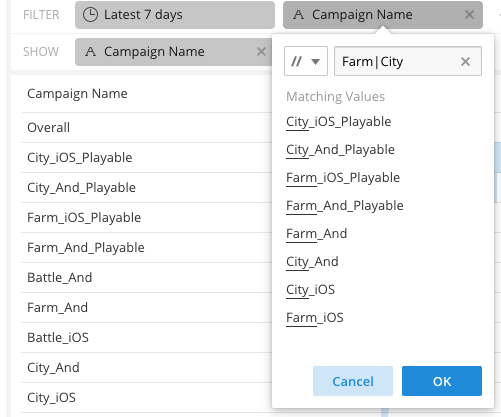
When you press OK, only those campaign names that contain the specified text will appear.
The right panel displays the MEASURE settings. Click the overflow options icon to compare or filter by individual metrics, and the drop-down menu to select which metrics to apply.
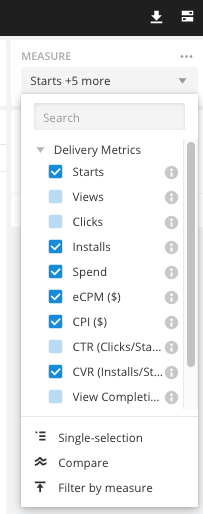
You can apply the following metrics to your measure panel.
| **Metric** | **Description** |
| Starts | Start (Impression) is fired when the ad starts |
| Views | The number of times people watched the entire ad |
| Clicks | The number of times people clicked on the button to install a game. |
| Installs | The number of times people actually installed an app. |
| Install Rate (Installs/Clicks) | The number of installs divided by the number of clicks. |
| Spend | Budget spent based on number of installs and cost per install |
| eCPM (effective cost per mille) | Estimated cost per 1,000 impressions. |
| CPI ($) | Cost per Install. |
| CTR (Clicks Starts) | Clickthrough rate, or the number of times users clicked the install link divided by the number of impressions. |
| CVR (Installs/Starts) | Conversion rate, or the number of installs divided by the number of impressions. |
| View Completion Rate | The number of views divided by the number of starts. |
| SKAdNetwork CPI | Cost per install in Apple's SKAdNetwork. |
| SKAdNetwork Installs | The number of times people clicked on the button to install a game in Apple's SKAdNetwork. |
| SKAdNetwork CVR | Conversion rate, or the number of installs divided by the number of impressions in Apple's SKAdNetwork. |
| SKAdNetwork Install Rate (SKAd Installs/Clicks) | The number of installs divided by the number of clicks in Apple's SKAdNetwork. |
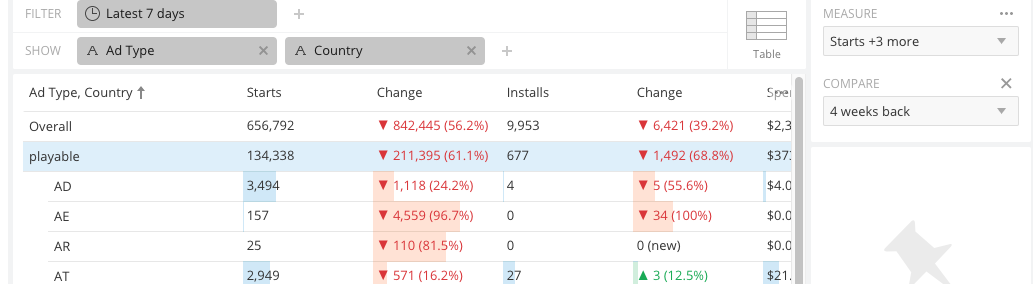
Click COMPARE to see changes from different timeframes. This can help you drill down and understand performance impact.
Use this feature to spot trends. Red and green indicators show if the change is positive (green) or negative (red), so that you can see performance at a glance.

As you add or subtract dimensions, Report Builder may automatically change to a chart type that might work better for your data. You can change back, or choose another chart type, by clicking the data visualization indicator. As you change chart types, Report Builder may prompt you to add or subtract dimensions.
To see the different charts available, click the current chart type.

When you change chart types, Report Builder guides you to add additional dimensions as needed.
| Name | Limitations and rules |
| Overall | This needs a Measure value but can be used with just a time filter and no dimension. |
| Table | At least one Dimension |
| Grid | Exactly two Dimensions |
| Line Chart | Requires a time dimension. |
| Area Stack | Requires a time dimension. |
| Bar Chart | Flexible, but you might want to limit this to dimensions with few types. |
| Sunburst | Flexible, but you might want to limit this to dimensions with few types. |
| Heatmap | Requires two dimensions. |
| Treemap | Flexible. |
| Sankey | Requires two dimensions. |
| Bubble Chart | Requires two dimensions. |
| Cross Tab | At least two dimensions. |
| Geo Marks Geo Shades | These are not in use at this time. |
Problem: Keeping your game and creatives backwards-compatible (meaning they work on older levels of operating systems) can be expensive. Is it worth it to keep supporting older systems? Suppose you have this question about iOS devices.
Here are two ways you can find out.
The Big Picture Method
- Using **My Campaigns, **show all OS Versions from the past 30 days by selecting these filters:

To narrow this to iOS, drag platform over to FILTER, then click to select iOS:

- Click the top of the column that you think will help you get your answer. You can sort it up or down:

In the table, you can quickly glance to see the various OS’s in use. This is useful, but doesn’t give you the information you want at a glance.

Click the Installs table header. If Installs shows an up arrow, you will see the data sorted with least used operating systems on the top.

To see this information in a way that works for you, experiment with different charts and settings, such as Tree Map. Consider limiting results to the top 5.
Using the Filter and the Show settings, you can create a table like this:

As you skim through this page, you notice that video ads that are served in Australia are performing especially well:

Click on the row labeled video to see more information about this, then click Select.

By narrowing what you are looking at to AU and video, the filters at the top also change.

But this doesn’t tell you enough. Drag Campaign Name from the DIMENSIONS list to the SHOW bar.
Click and sort by headings to discover which ad is helping AU perform so well. Then you can apply that knowledge to other campaigns:

If you see more than you need to see, you can limit what is displayed. For example, if you only want to see the top 10 countries in a chart, click a **SHOW **dimension and set the Limit to narrow the elements shown:

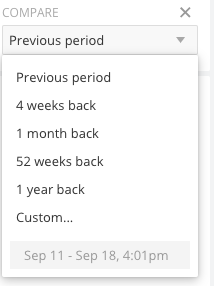
To see what installs and eCPM were the previous quarter, click the ellipsis and select Compare.


To choose the value that matches the current time filter, select Previous period.

Click Reset to remove all filters except the time period.
Report Builder will give you powerful insights. Please reach out to support if you need help using it or you need more information.