week05 01 four components - UX-UI-Design-Lab/DesignAesthetics3 GitHub Wiki
agenda:
- more drawings (polygons, bezier curves)
- activity: assemblage of four+ components
- Q&A, troubleshooting
polygon
we will explore how to draw polygon by using beginShape() and endShape()
You will put vertices and they will be connected as a shape.
https://p5js.org/reference/#/p5/beginShape
- can you draw a pentagon?
map
let's assign one of the vertex with mouse position. You will find that the mouse-following vertex can change the shape in the unexpected way. -- To limit the change as you want, you can use map().
If I want to make the vertex only from 100 - 200 by mapping mouseY's movement from 0 - height:
let mapY = map(mouseY, 0, height, 100, 200);
regular polygon (equilateral + equiangular)
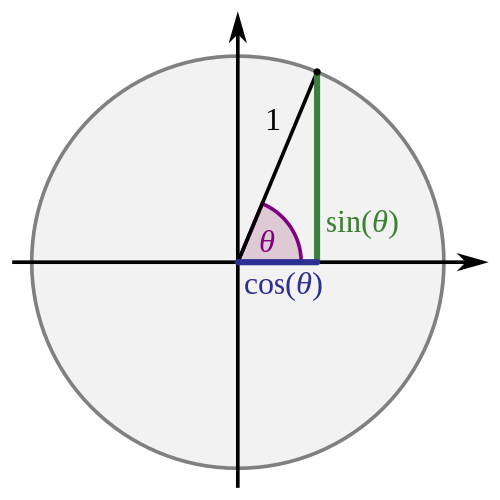
we can use FOR and rotation to make a regular polygon. a bit of trigonometry helps.

  let polygon = 5;
  let radius = mouseX - width / 2;
  let angle = 2 * PI / polygon;      // or TAU for 2*PI or TWO_PI

  translate(width/2, height/2);

  beginShape();
  for (var i = 0; i <= polygon; i++) {
     var x = cos(angle * i) * radius;
     var y = sin(angle * i) * radius;
     vertex(x, y);
   }
  endShape();
It can help us to draw a star! Can you try? HINT: you will draw the second vertex between the original vertices.
bézier curve
It is a relatively new technique to draw a curve (initially suggested to draw the car-body-curve design, in 1960s). it uses two lines (or four control points) to find the smooth path.
https://en.wikipedia.org/wiki/B%C3%A9zier_curve https://en.wikipedia.org/wiki/Spline_(mathematics)
we will draw a bezier curve, add mouse interaction, and place the text to follow the curve.
https://p5js.org/reference/#/p5/bezierPoint
curve
Comparing to Bézier, curve is connecting the end point of two lines (interpolate = estimate the in-between coordinates). You will see the difference when we apply the same anchors from bezier to curve.
activity: composition
I want you to sketch the cover page of the portfolio (the presentation of your works in this course).
- you will decide which works you want to show (# of works, assignments and/or activities)
- divide the canvas (full width + height) and decide which space would be link to each work
- place your name and course info
IF again + function
We will test IF condition, whether different zone can activate different look&feel.
hypertext
We will create hypertext to link to the assignments.