Semi Blind Testing Template - TravelingRobot/NAI_Community_Research GitHub Wiki
- You want to find out which preset is the best for you?
- You would like to know whether the attribute-style is more effective for the lorebook than prose?
- You wish to test if you prefer Krake or Euterpe?
We humans have an unconscious tendency to judge things in a way that supports our prior beliefs (aka confirmation bias). This makes it tricky to compare anything related to text gen (methods, models, presets etc.) without falling prey to the various types of observer bias.
One method to avoid those tendencies is to rate outputs from different test conditions (for example, outputs from different models) so that
- You do not know from what test condition the output originates
- You rate enough outputs that you have sufficient statistical proof to be sure that any difference that you see between test conditions is not just due to chance.
To make this possible for people with no or minimal statistical education, I created a Google Sheets template that automatizes parts of this process for you:
NAI Semi-Blind Testing Template
First, you want to decide what test conditions you want to actually compare and what you want to test. Be clear about your test conditions and the rating you would like to compare those on.
Example:
Do I like the Output Quality of Krake better than Euterpe?
You also should be clear of the standardized test procedure that you intend to use. How will you generate the output that you want to rate? The procedure for this should be the same for all test conditions (differing only in the aspects that define the test condition).
Example:
I will provide only an ATTG of [ Genre: fantasy ] in memory in an otherwise empty prompt. For each output, I will do 3 generations with an output length of 600 characters for Krake and Euterpe using their respective default preset. I will later rate these outputs on output quality from 1 to 5.
Decide on your what? Okay, those are statistical concepts, sorry about those. If you would rather not think too hard on those, I recommend just going with significance level = .1 and power = .8 and move on to d).
If you are interested in more details, click below
Details on significance level and power.
Okay, so later you will be testing if any difference you found could represent something real or if is probably just due to chance. Significance settles your criteria for this testing.Significance level denotes the amount of proof you want to have for a difference before you assume it is something "real" and just not due to chance. In dubio pro… no difference. Unless we have significant proof that there is a difference, we will assume that anything we found was just due to random variation of the AI. When do we have significant proof? Well, that is determined by the significance level (duh). The lower the significance level, the more proof we need for a difference until we assume it represents something beyond pure chance.
0.05 is a level commonly used in many fields of science. But for our purposes that might be a bit overkill in most cases.
0.1 is what I would recommend for applied low-stakes situations like NAI, where occasionally being wrong isn't super bad. You'll sometimes think you have found a difference when there actually isn't one, but it will only happen 1 out of 10 times.
Technically speaking, the significance level is what frequency of doing a Type I error you are okay with. Type I error means you are assuming that a result is due to a real effect when there actually isn't one. With a significance level of 0.1 you accept a chance of 10% of thinking you found a difference even though there really isn't one, and you are just looking at pure randomness.
Power determines your ability to find a difference, if there actually is one. It is the opposite of a type II error. Type II error means erroneously assuming there is no effect when there actually is one. (This is a nice illustration of type 1 versus type 2).
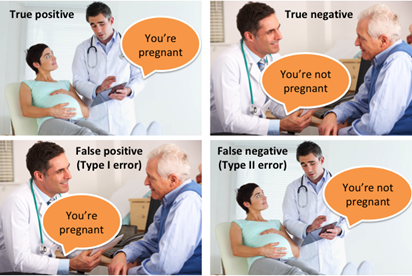
A Power of 0.8 is commonly used in many scientific fields. It means you have a chance of 80% to find an effect if there actually is one.
You want to decide beforehand how many outputs you want to collect and rate. To make an informed guess here, you need to consider the size of difference you would like to be able to detect, your significance level, your power, and the number of test conditions you would like to compare. If you are fine with only detecting large differences (potentially missing smaller ones), you can use the following table as a rough guideline and move on:
| Test conditions | Outputs per condition (MINIMUM!) |
|---|---|
| 2 | 21 (42 total) |
| 3 | 31 (93 total) |
| 4 | 36 (144 total) |
| 5 | 40 (200 total) |
(This gives a sufficient sample size for detecting a large effect with sig. level = .1, power = .8, even when correcting for multiple testing with Bonferroni)
If you want more details on how to plan your sample size, click below.
Details on determining sample size
The table above gives the minimum sample size for detecting a large difference with significance level = .1 and power = .8. Large difference refers to what would be considered a large effect in the behavioral sciences (like psychology). I have no clue if that type of difference would actually be "large" in effect for AI text gen. It might end up meaning "massive" or "just about noticeable in everyday use". But since probably nobody really knows, it is the best educated guess I can make. I suspect that "small" differences will mostly not be noticeable in practice and "medium" might not be super relevant either, but I might be wrong.
Anyway, below are more tables with the minimum number of required outputs for different effect sizes. You'll notice that for detecting smaller or medium differences, you will need considerably more ratings. But maybe we'll get there one day if different people share their data, and we combine things…:
| Test conditions | Small difference | Medium difference | Large difference |
|---|---|---|---|
| 2 | 325 (650 total) | 53 (106 total) | 21 (42 total) |
| 3 | 465 (1395 total) | 76 (228 total) | 31 (93 total) |
| 4 | 548 (2192 total) | 89 (356 total) | 36 (144 total) |
| 5 | 614 (2456 total) | 100 (500 total) | 40 (200 total) |
| Test conditions | Small difference | Medium difference | Large difference |
|---|---|---|---|
| 2 | 412 (824 total) | 67 (134 total) | 27 (54 total) |
| 3 | 548 (1644 total) | 89 (267 total) | 36 (108 total) |
| 4 | 641 (2564 total) | 105 (420 total) | 42 (168 total) |
| 5 | 700 (3500 total) | 114 (570 total) | 46 (230 total) |
Too lazy to do more of those right now, but if you are interested in any other combination of significance level and power, just let me know via discord (my user ID is in the footer).
Time to collect them outputs! Go make a copy of the template, so you can edit it, and start generating some outputs. Outputs can be generated manually or with nrt. Record each output in tab 1 - Collect Outputs. Note down the test condition for each output and copy-paste the output itself.
Careful when pasting in the actual output! If you paste directly into the cell, line breaks will be interpreted as belonging to the next cell, which is bad.

Don't do this!
Instead, paste it into the upper edit window, where line breaks are allowed.

Here is where you want to paste.
Try not to read the output you are copy-pasting. You don't want to know what conditions each output comes from, remember?
You are done with this step when you have recorded your previously determined number of outputs.
Move on to the tab 2 - Rate Outputs. You will see all outputs shuffled. The condition for each output is hidden now, so unless you have outstanding memory, you mostly shouldn't know what output comes from where. Start rating each output on the measure you are interested in. A rating of 1 to 5 usually has enough resolution, but you can use whatever range of scores you like.
You are done with this step once you have rated all your outputs
Time for tab 3 - Results.
Change the significance level if you want something else than 0.1.
This tab allows up to 3 tests, if you want more just write down the value under p and redo the steps for the remaining tests.
For each test you want to do, pick the conditions you would like to compare with the dropdown under Categories to compare.
If you are only doing one single comparison between two testing condition, that is it – read the result under Conclusion. This will tell you which condition had the higher scores, if this difference is likely due to chance or might actually represent something real, and how big that effect is.
If you are doing more than one comparison, there are a few extra steps. Note down the values that appear under p for each test. Then head over to this link. Fill in your p-values and hit calculate.

Below the input field, you will see 'corrected probabilities'. Note those down. Head back to the sheet and fill those in into the field for corrected p. Now you can read the results under Conclusion.
Congrats! You ran a semi-blinded study and applied statistical analysis on the data. Only thing left to do is heading over to the NAI discord and reporting your results in #community-research.
Progress of current study:
(finished: 11-Apr-2022 14:28 GMT+1)
Data collection of current study finished!
Data can be accessed here
Write-up can be found here
Want to contribute? Message me on Discord! (TravelingRobot#4142)