Instructions for VLDB 2022 Demo - Texera/texera GitHub Wiki
Texera is an open-source system that supports collaborative data analytics at scale using Web-based workflows. This page includes instructions on how to install the system and do a simple workflow, and how to utilize Texera's shared editing and execution capabilities do real-time collaborative data analytics.
1. Install packages:
- Install
Java JDK 8 or 11 (Java Development Kit)(recommend:adoptopenjdk) for running the backend engine of Texera and set JAVA_HOME in your path. - Install
sbtfor building the project, check https://www.scala-sbt.org/1.x/docs/Setup.html. We recommend usingsdkmanto install sbt if you are using Java 8. Sbt installed using brew has problem with Java 8, as documented here. - Install
Git.
- On Windows, install the software from https://gitforwindows.org/
- On Mac and Linux, see https://git-scm.com/book/en/v2/Getting-Started-Installing-Git
- Install
Node.jsandnpm(Install an LTS version instead of the latest. Currently it’s version 16.x)
https://nodejs.org/en/. Use NVM to install NodeJS because it avoids permission issues when using node. - Install
yarnpackage manager: https://classic.yarnpkg.com/en/docs/install/
2. Clone the Texera project:
- Open a command line and navigate to a directory where you want to install the Texera project.
On windows,
Git Bashis available after installing git. - Clone the project from GitHub by executing
git clone https://github.com/Texera/texera.git
3. Start Texera:
-
Open a command line and navigate to the cloned repository. If you are on Windows, you need to use Git Bash as a Linux bash shell in order to run shell scripts.
-
Navigate to the
coredirectory
cd core
Then build the project.
./scripts/build.sh
Depending on your environment, it may take a few minutes (around 2 minutes to 6 minutes).
- Start the Texera Web server. In the
coredirectory:
./scripts/server.sh
Wait until you see the message org.eclipse.jetty.server.Server: Started
- Start the Texera worker process. Open a new terminal window. In the
coredirectory:
./scripts/worker.sh
Wait until you see the message ---------Now we have 1 nodes in the cluster---------
Note: (if ./scripts/worker.sh gives a "permission denied error", just do chmod 755 scripts/worker.sh to grant an execute permission to the file).
- Open a browser and access
http://localhost:8080.
4. Use Texera:
Web UI Overview
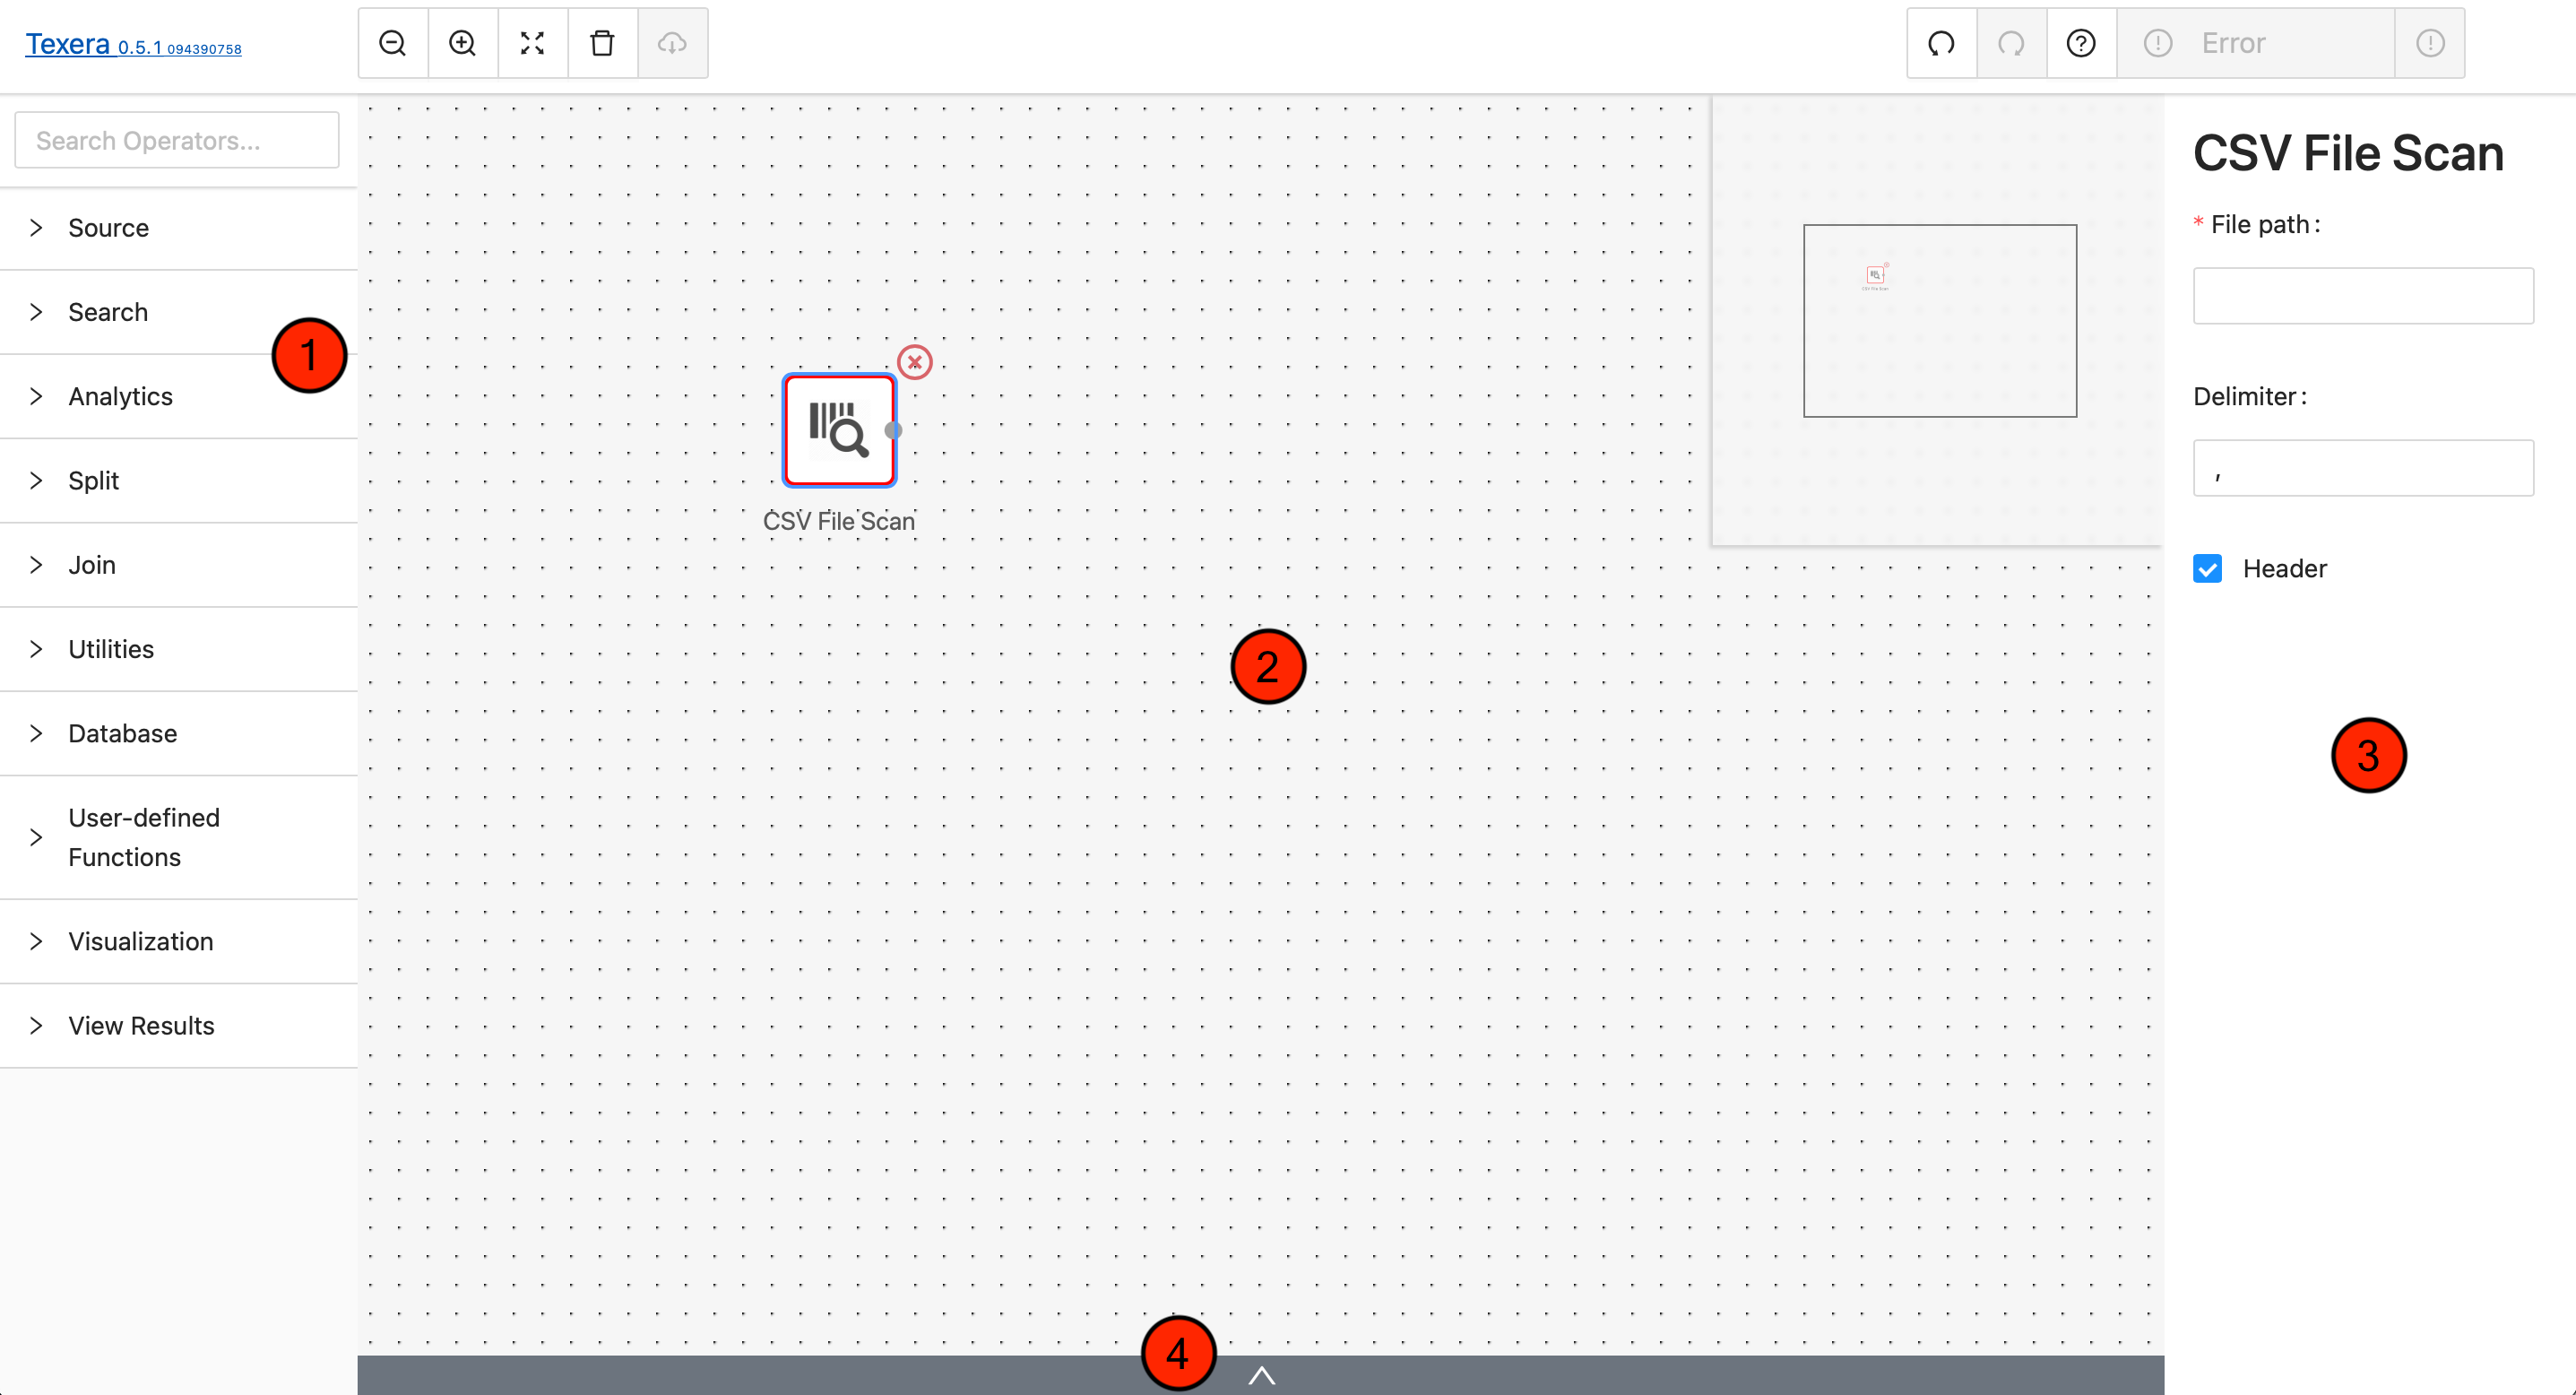
-
Operator Library/Menu:
It is separated into multiple dropdown menus based on the operator type, e.g., Source Operator, Search Operator, etc. You can drag and drop an operator from these dropdown menus onto the Workflow Canvas.
-
Workflow Canvas:
It is the main playground, where you can drag and drop Operators from the Operator Library onto it. Each operator is shown as a square box and connected with other operators with arrowed links which indicates the data flow.
-
Properties Editor Panel:
The panel will show up when you highlight a specific operator (by clicking on it) in the Workflow Canvas. You can customize the properties of the selected operator, for example, set the keyword for a filter. When the selected operator is configured correctly, a green ring will surround it; while a red ring usually indicates an error in configuration or connection to other operators.
-
Result Panel:
By default or when there is no result, it is hidden. You can click on the little UP arrow to expand this panel. When a workflow is finished running, the result panel will pop up with the data. You may slide up and down or left and right to view the data inside the panel.
Create the first workflow
The following are detailed instructions to create a workflow to analyze data from a csv file using the Texera system. More specifically, the workflow will calculate the average sales per item type for Europe from the CountrySalesData.csv (Make sure the downloaded file is in .csv file extension). The sales data has been downloaded from eforexcel.com and has 100 rows of data.
We will be creating a workflow on Texera Web UI to
- read the data from the file;
- filter the relevant data based on keywords;
- perform an aggregation.
1. Read Data
- Drag and drop the
CSV File Scanoperator from theSourceoperator type onto the Workflow Canvas. - Select the
CSV File Scanoperator on the Workflow Canvas. On the right-hand side, theProperties Editor Panelfor theCSV File Scanoperator should appear. - Fill in the absolute file path of the downloaded
CountrySalesData.csvfile on your OS. - The delimiter has been set to
,by default. - Check the
headeroption to indicate that the file has a header row at the top.
2. Filtering Using Regex
- Drag and drop a
Regular Expressionoperator from theSearchoperator type and place it to the right of theCSV File Scanoperator on the Workflow Canvas. - The two operators should get connected automatically (an arrow from
CSV File OperatortoRegular Expression). If not, please connect them manually by clicking and dragging on the grey dot of the first operator to the second operator. The connection signifies the flow of data from theCSV File Scanoperator to theRegular Expressionoperator. - Select the
Regular Expressionoperator on the Workflow Canvas. On the right-hand side, theProperties Editor Panelfor theRegular Expressionoperator should appear. - In the dropdown menu set the data column on which you want to perform the search. The
Regexproperty is the expression that you want to search. The column isRegionand regex isEurope.
3. Aggregation
- Drag and drop an
Aggregateoperator from theUtilitiestype onto the Workflow Canvas and connect it to theRegular Expressionoperator. - On the properties panel for the
Aggregateoperator, set theAggregation Functiontoaverage. - In the dropdown menu below, set the data column to be averaged as
Units Sold. - In the input box of
Result Attribute, give the name of the aggregated value. For example, let's useunits-sold-per-type. - We are doing the averaging per item-type. Hence, click the
+underGroup By Keysand typeItem Type.
4. View Result
- Drag and drop a
View Resultsoperator from theView Resultstype onto the Workflow Canvas and connect it to theAggregateoperator as the end of the workflow.
5. Run the workflow
Notice that the Run button now is enabled (because the workflow is complete). Click it to run the workflow. The results will appear in the Result Panel. Some green status messages will be labeled on the operators to indicate the process of the execution.
If the user accidentally closes the browser, the system will automatically save the workflow and load it when the user visits the same site.
In case the workflow doesn't work as expected, you can try to "Refresh" the page, and click the "Run" button again.
5. Enable Shared Editing and Shared Execution
User system needs to be enabled for the two features mentioned in our demo paper to be available. First follow this guide to enable user dashboard. Shared Execution will be automatically enabled once the user dashboard is enabled.
To enable shared editing mentioned in the demo paper, modify core/new-gui/src/environments/environment.default.ts and change workflowCollabEnabled: false into workflowCollabEnabled: true.