Reports Logs - TestlumFramework/Testlum GitHub Wiki
Logs
Testlum has informative and easy to read logs.
Each tag has a unique display structure in the logs, due to the individual approach and visualization of tags in the logs.
Uniqueness of logs:
- Ease of perception
- Table structure
- Step by step analysis of the execution of each step of the scenario
- Detailed analysis of the execution of each tag
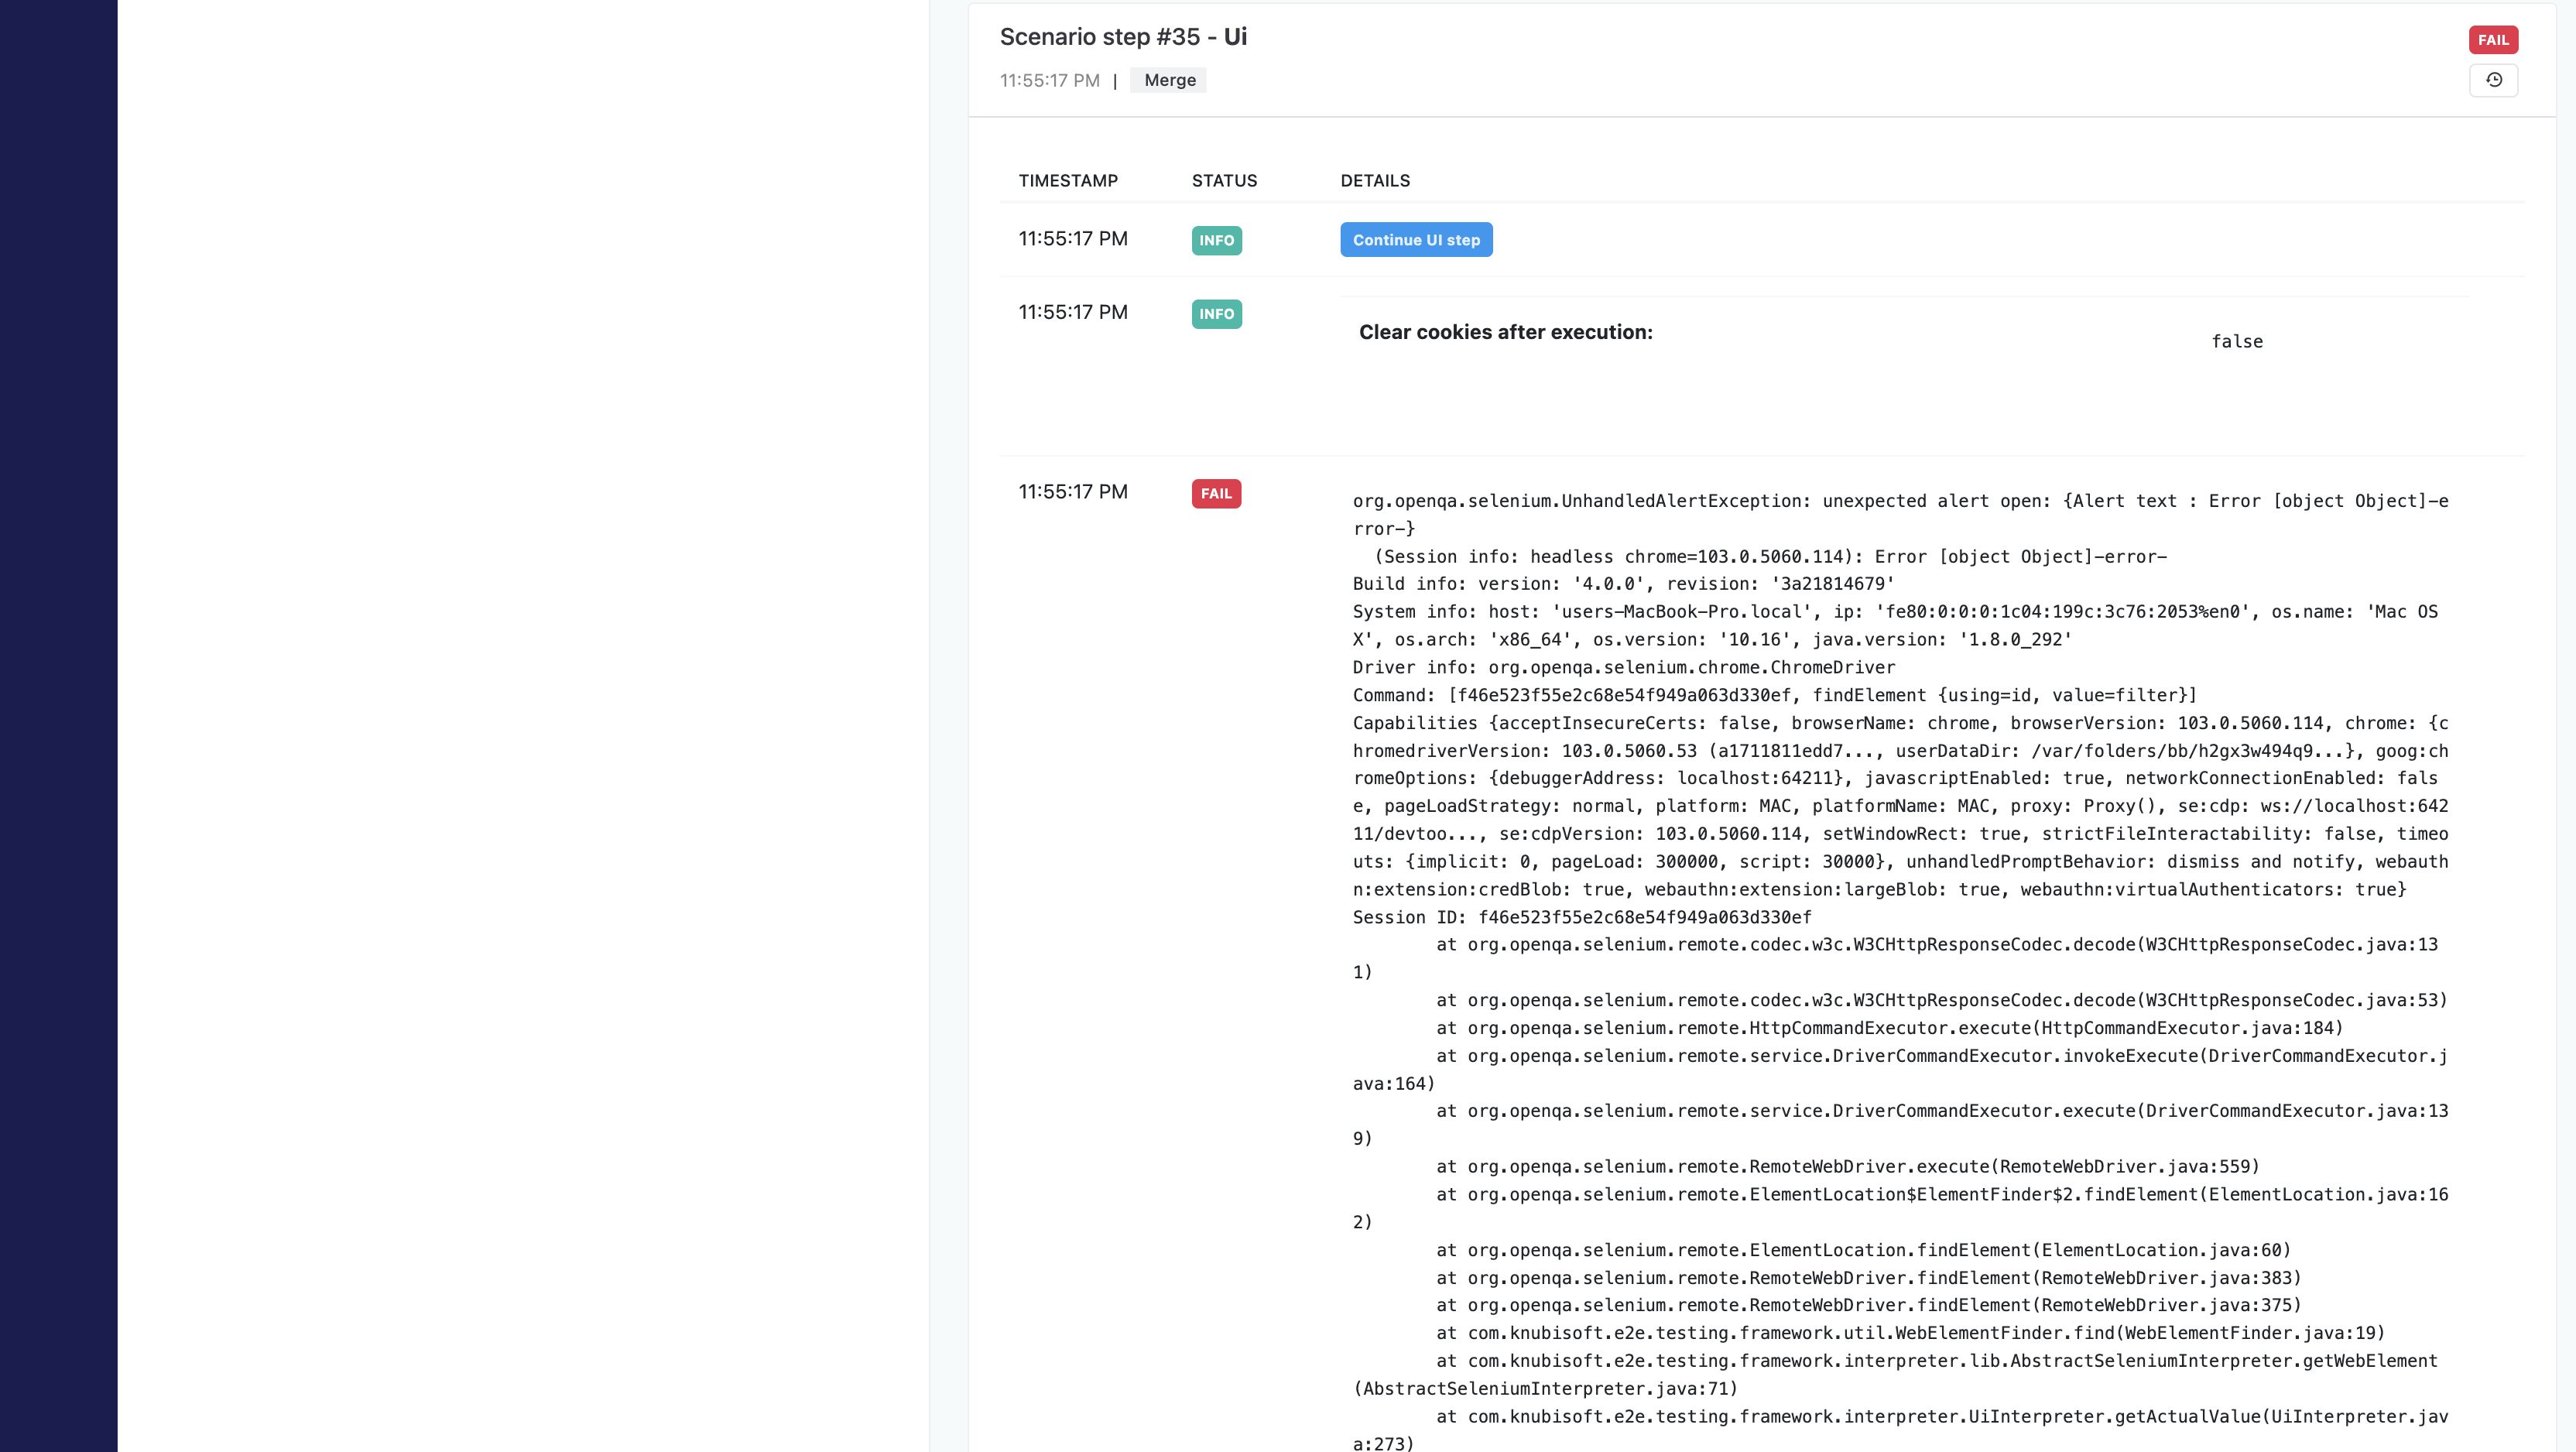
- Informative output of exceptions
- Displaying the overall result of passing scenarios
WEB Log's Structure
An example of tags display:
click
wait
input
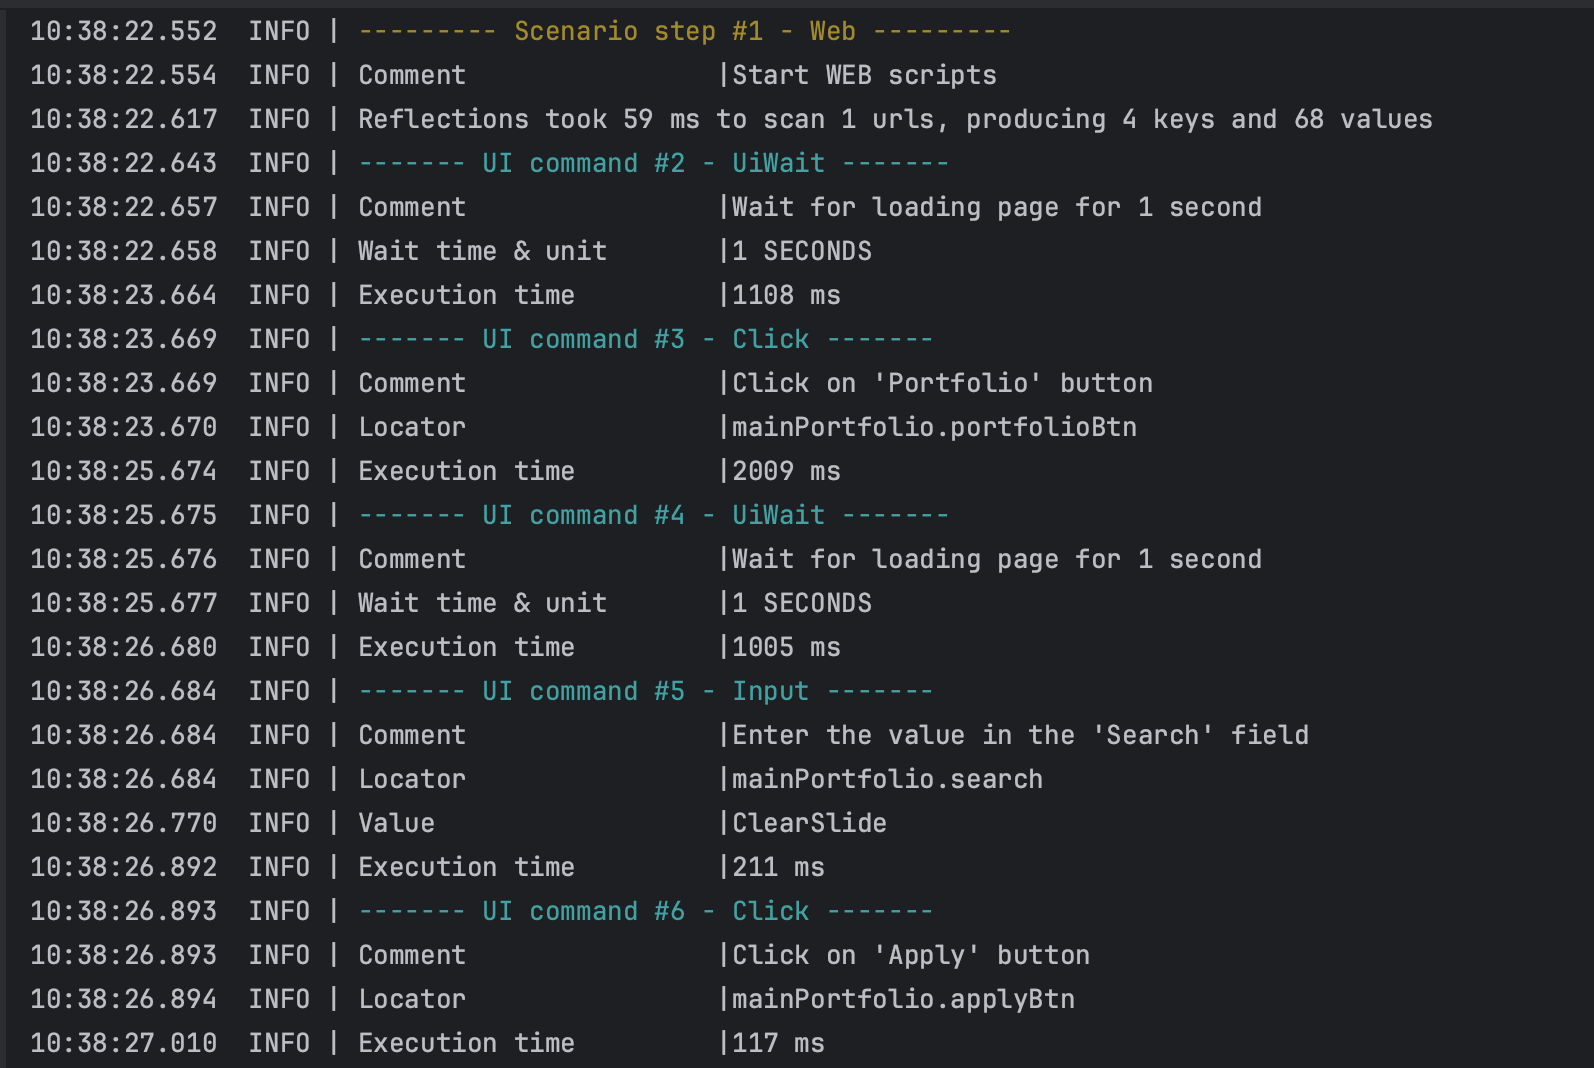
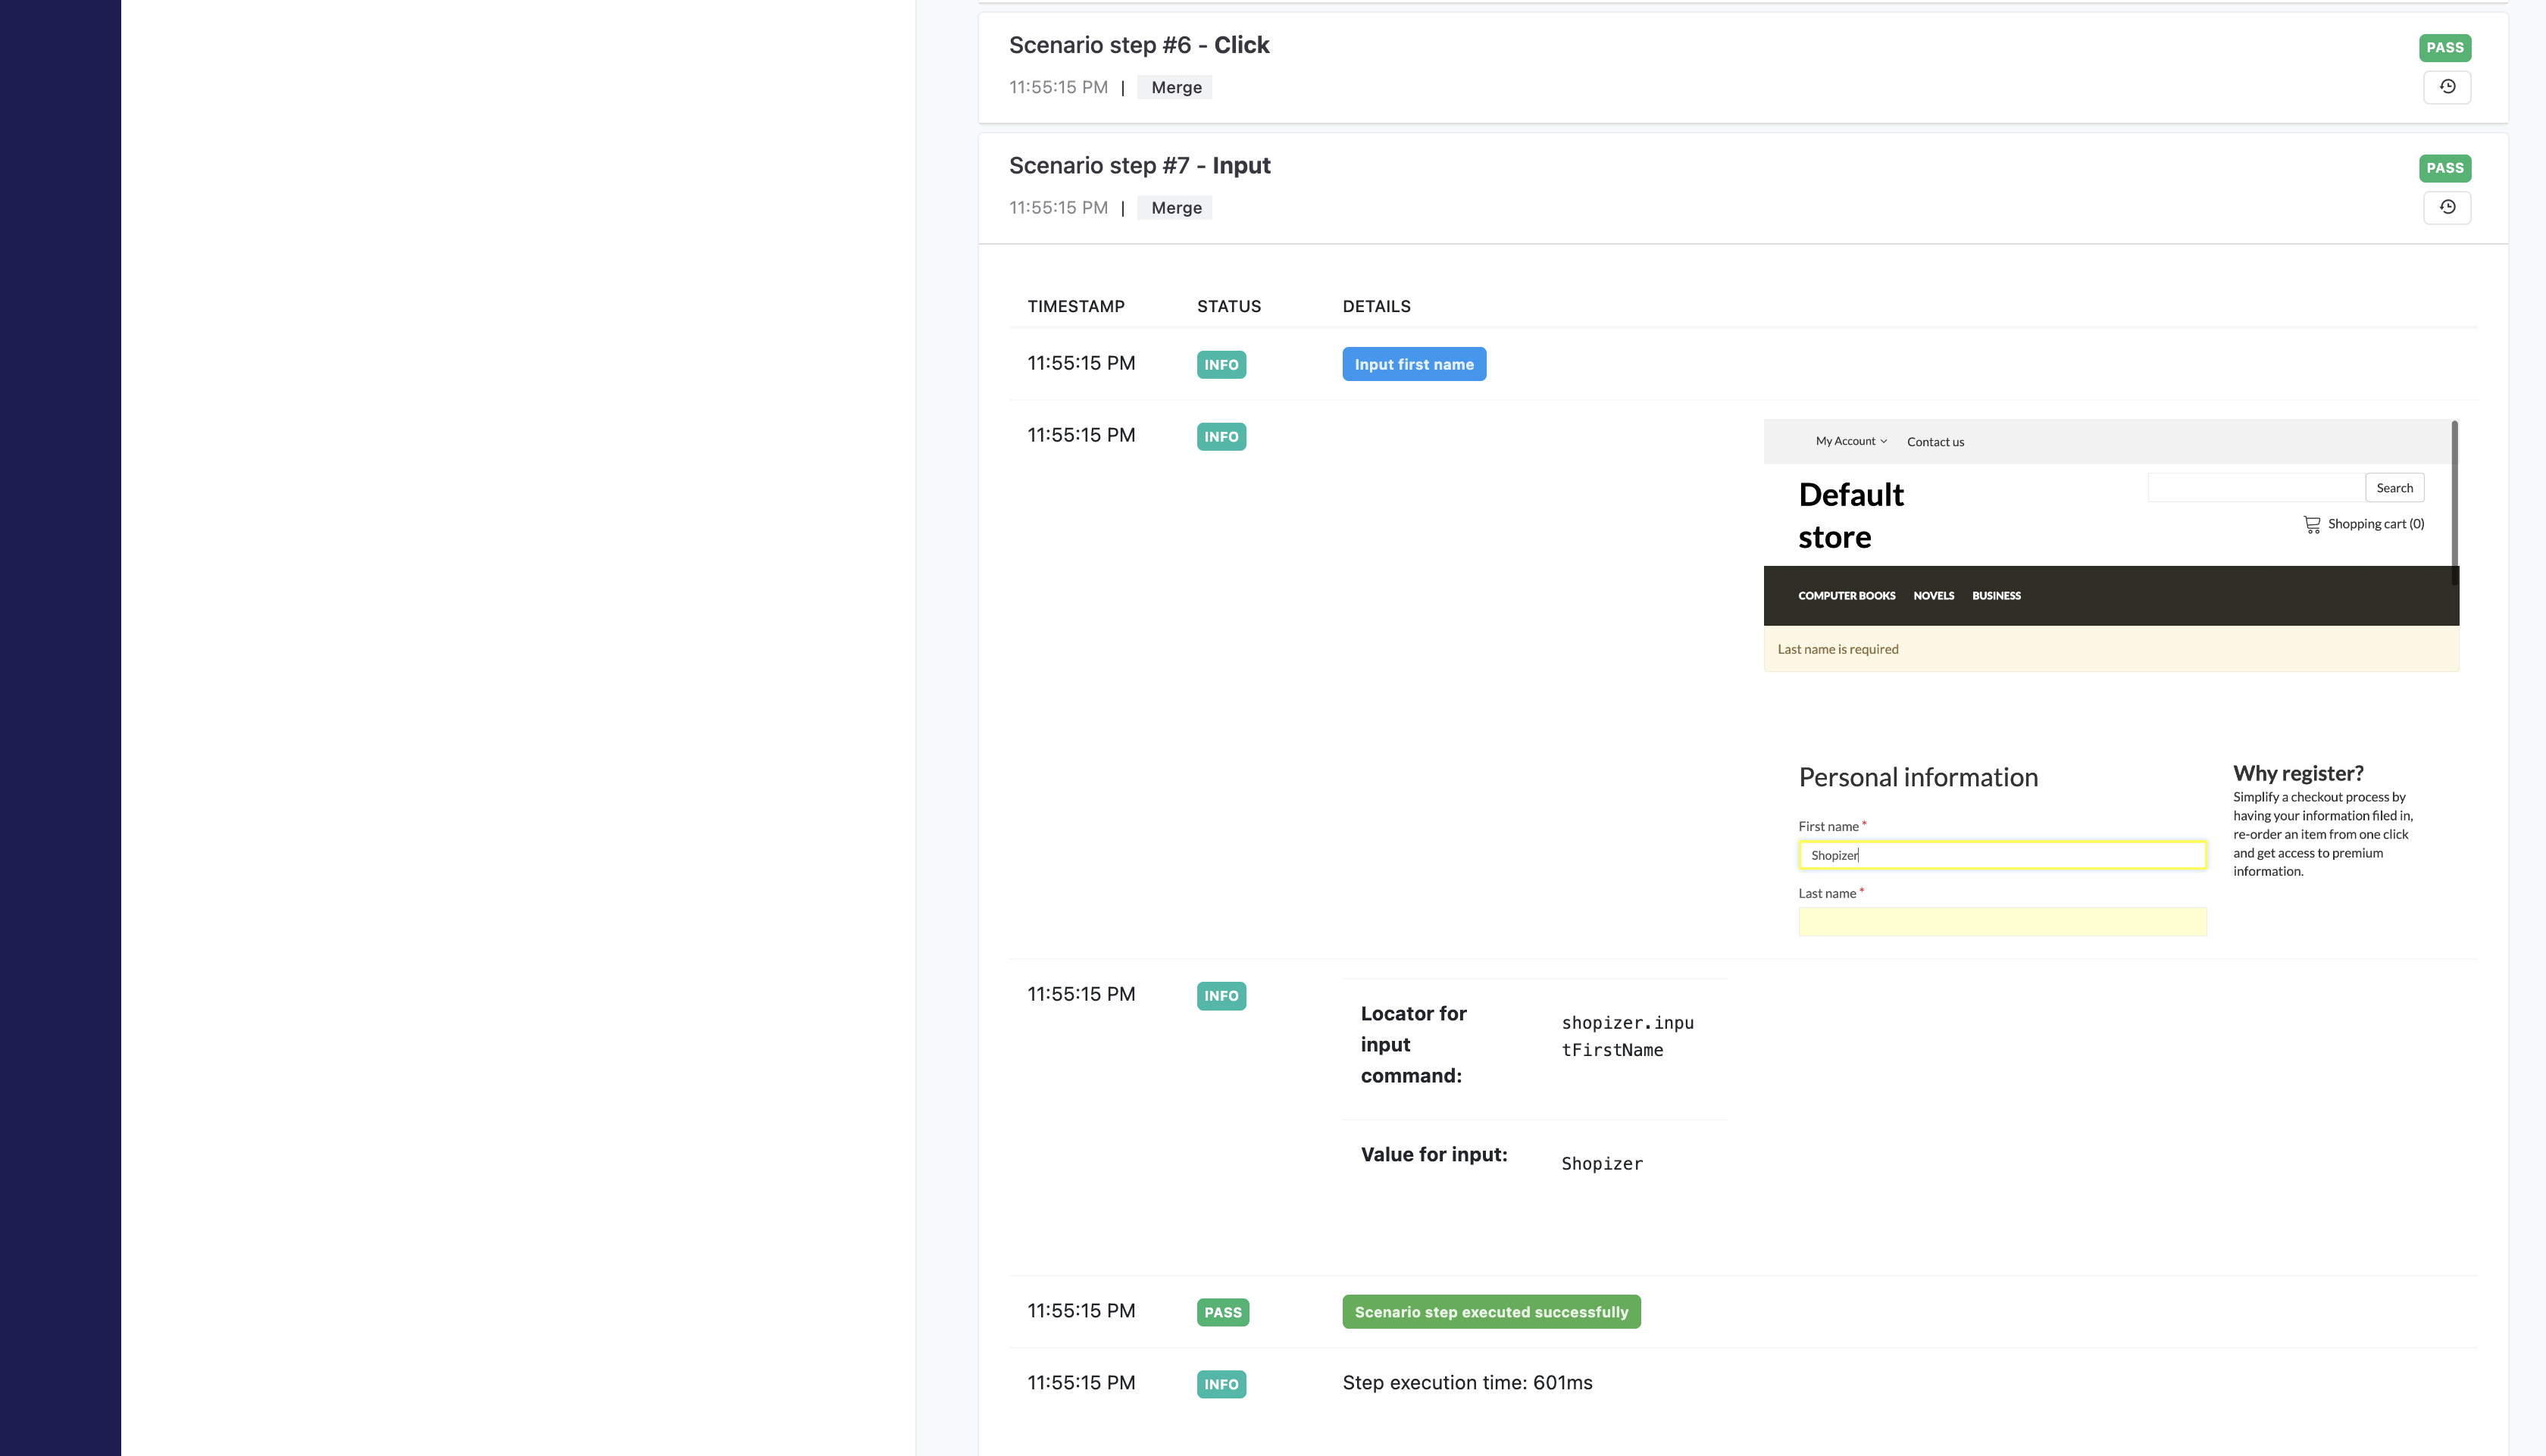
In these logs, we can see all the specific steps in passing our test scenarios, with a display of the transmitted and used data.
In the
clickcommand we see:
Comment- a unique parameter for each tag that describes the action of the step.Locator- passed WEB interaction element, with folder name, and unique element name.Execution time- a unique value for each tag that prints the execution time of each command.
In the
waitcommand we see:
Comment- a unique parameter for each tag that describes the action of the step.wait time & unit- a time for which the scenario pauses the passage of the scenario to perform a certain function that requires a wait.Execution time- a unique value for each tag that prints the execution time of each command.
In the
inputcommand we see:
Comment- a unique parameter for each tag that describes the action of the step.Locator- passed WEB interaction element, with folder name, and unique element name.Value- output of the passed value.Execution time- a unique value for each tag that prints the execution time of each command.
This structure allows you to quickly find errors in the test scenarios, and see the display of high-quality logs.
HTTP Log's Structure
An example of displaying a
httprequest:

In the
httpcommand we see:
Comment- a unique parameter for each tag that describes the action of the step.Alias- the unique name of the API we are interacting with.Method- display of the http method used.Endpoint- used endpoint.Body- display of the transmitted request body.Statuscode - API response code.Execution time- a unique value for each tag that prints the execution time of each command.
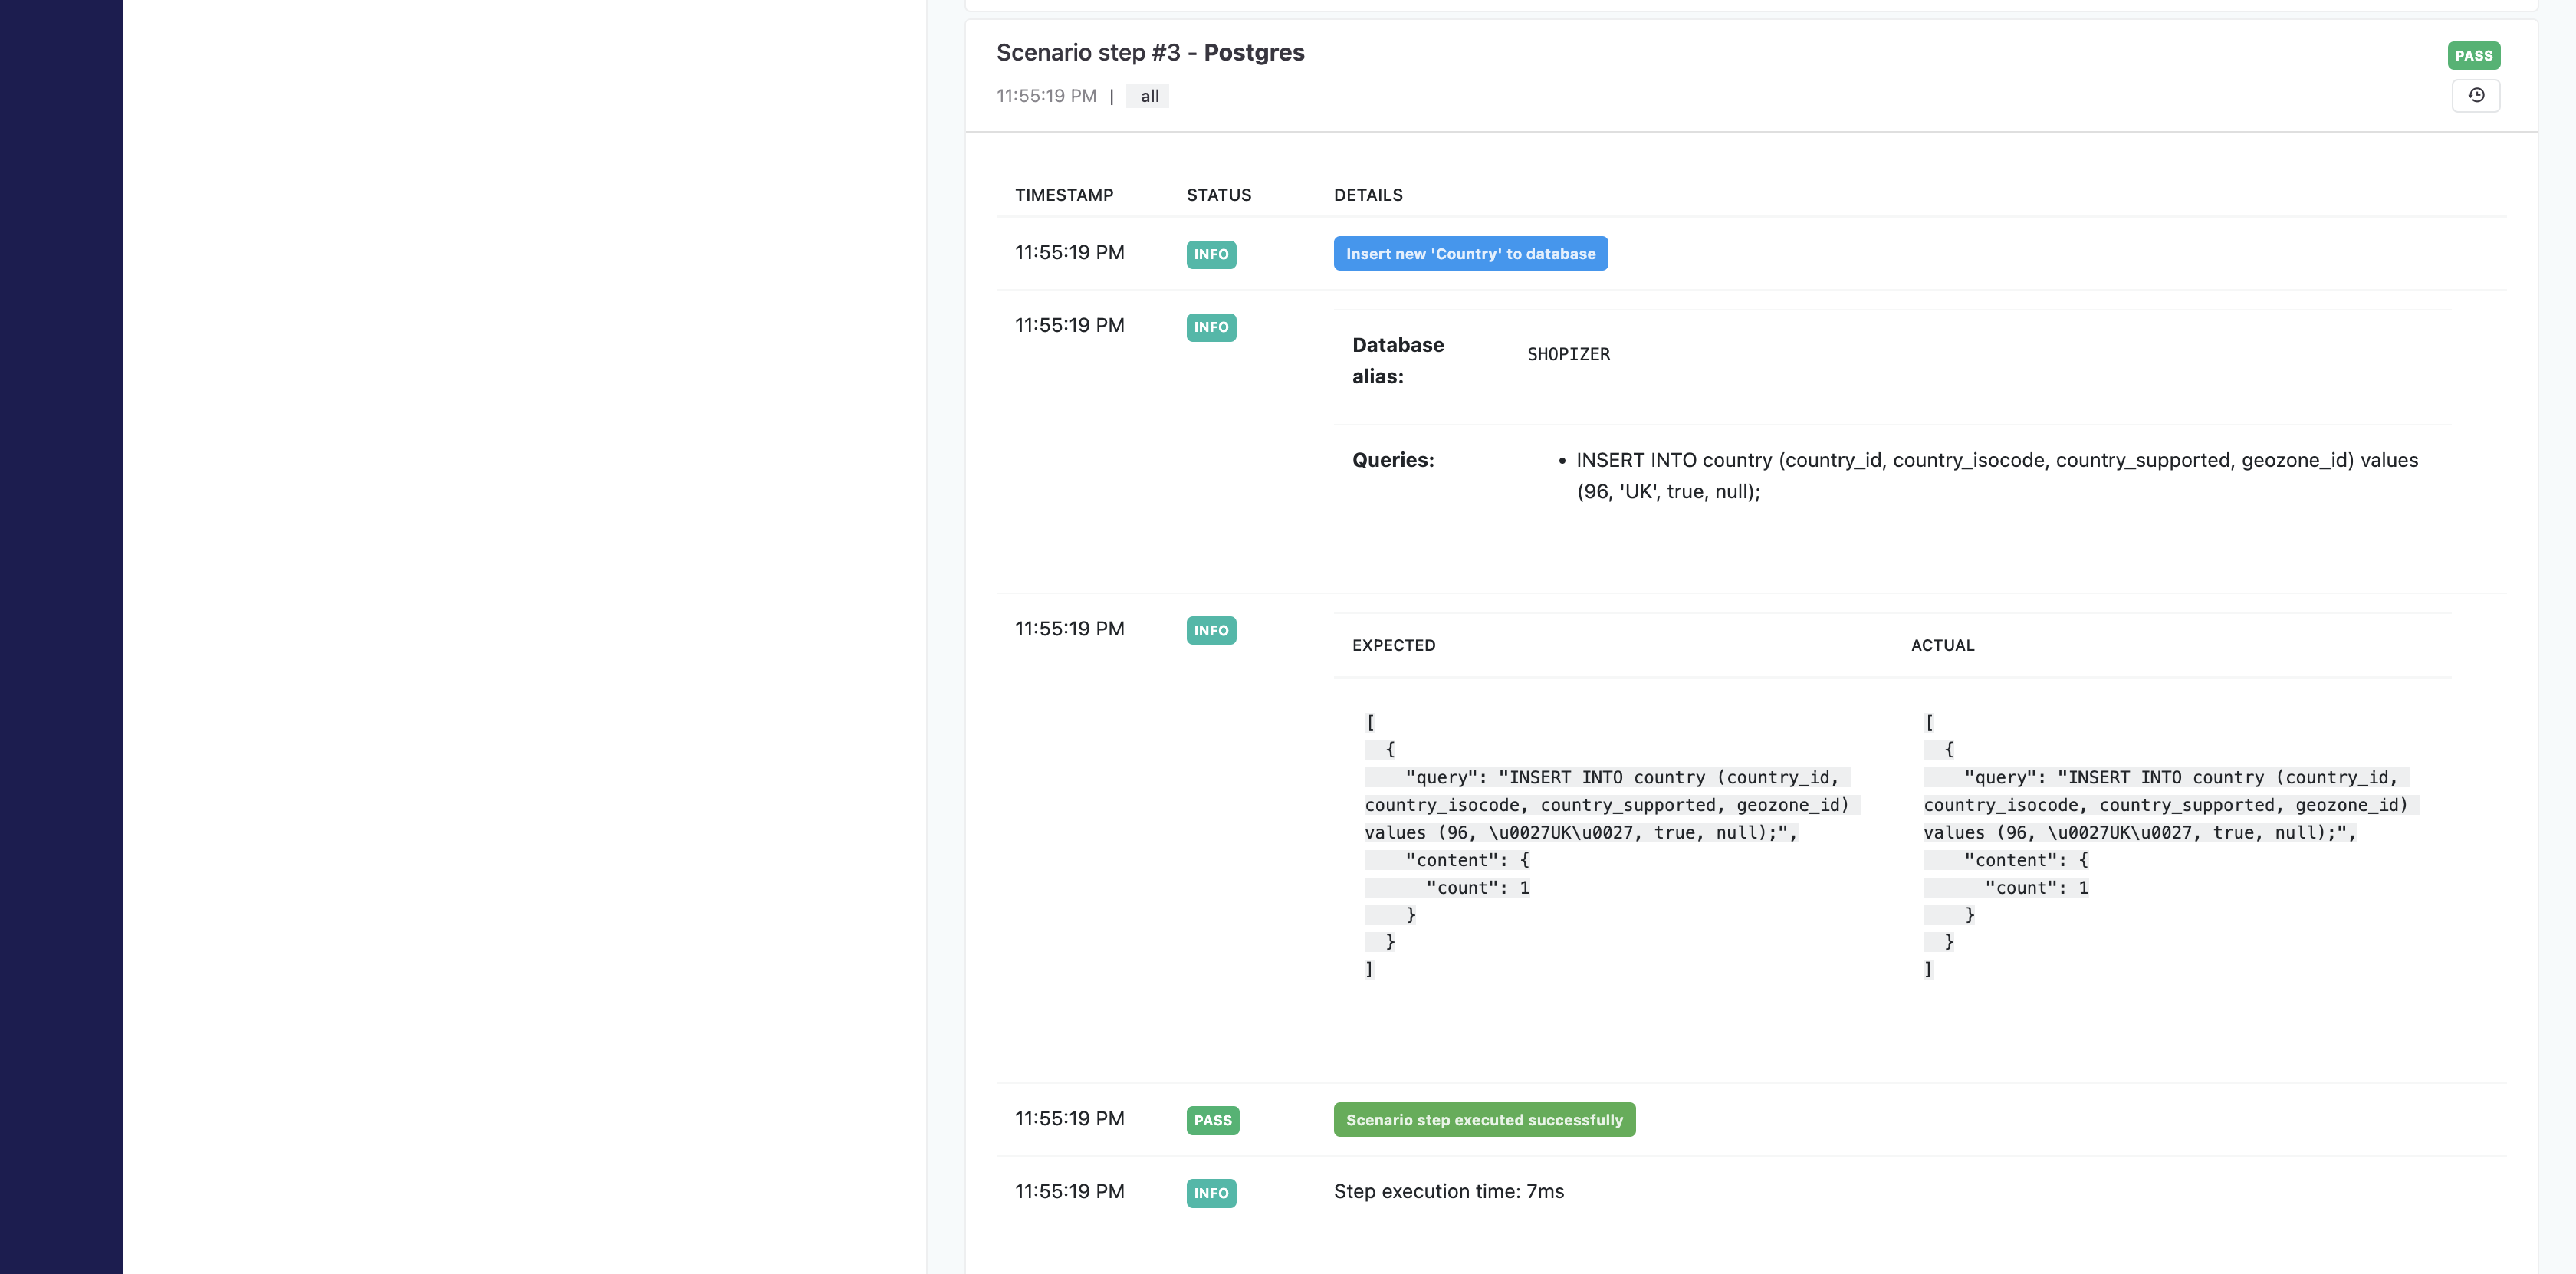
DB Log's Structure
An example of displaying a
postgresrequest:
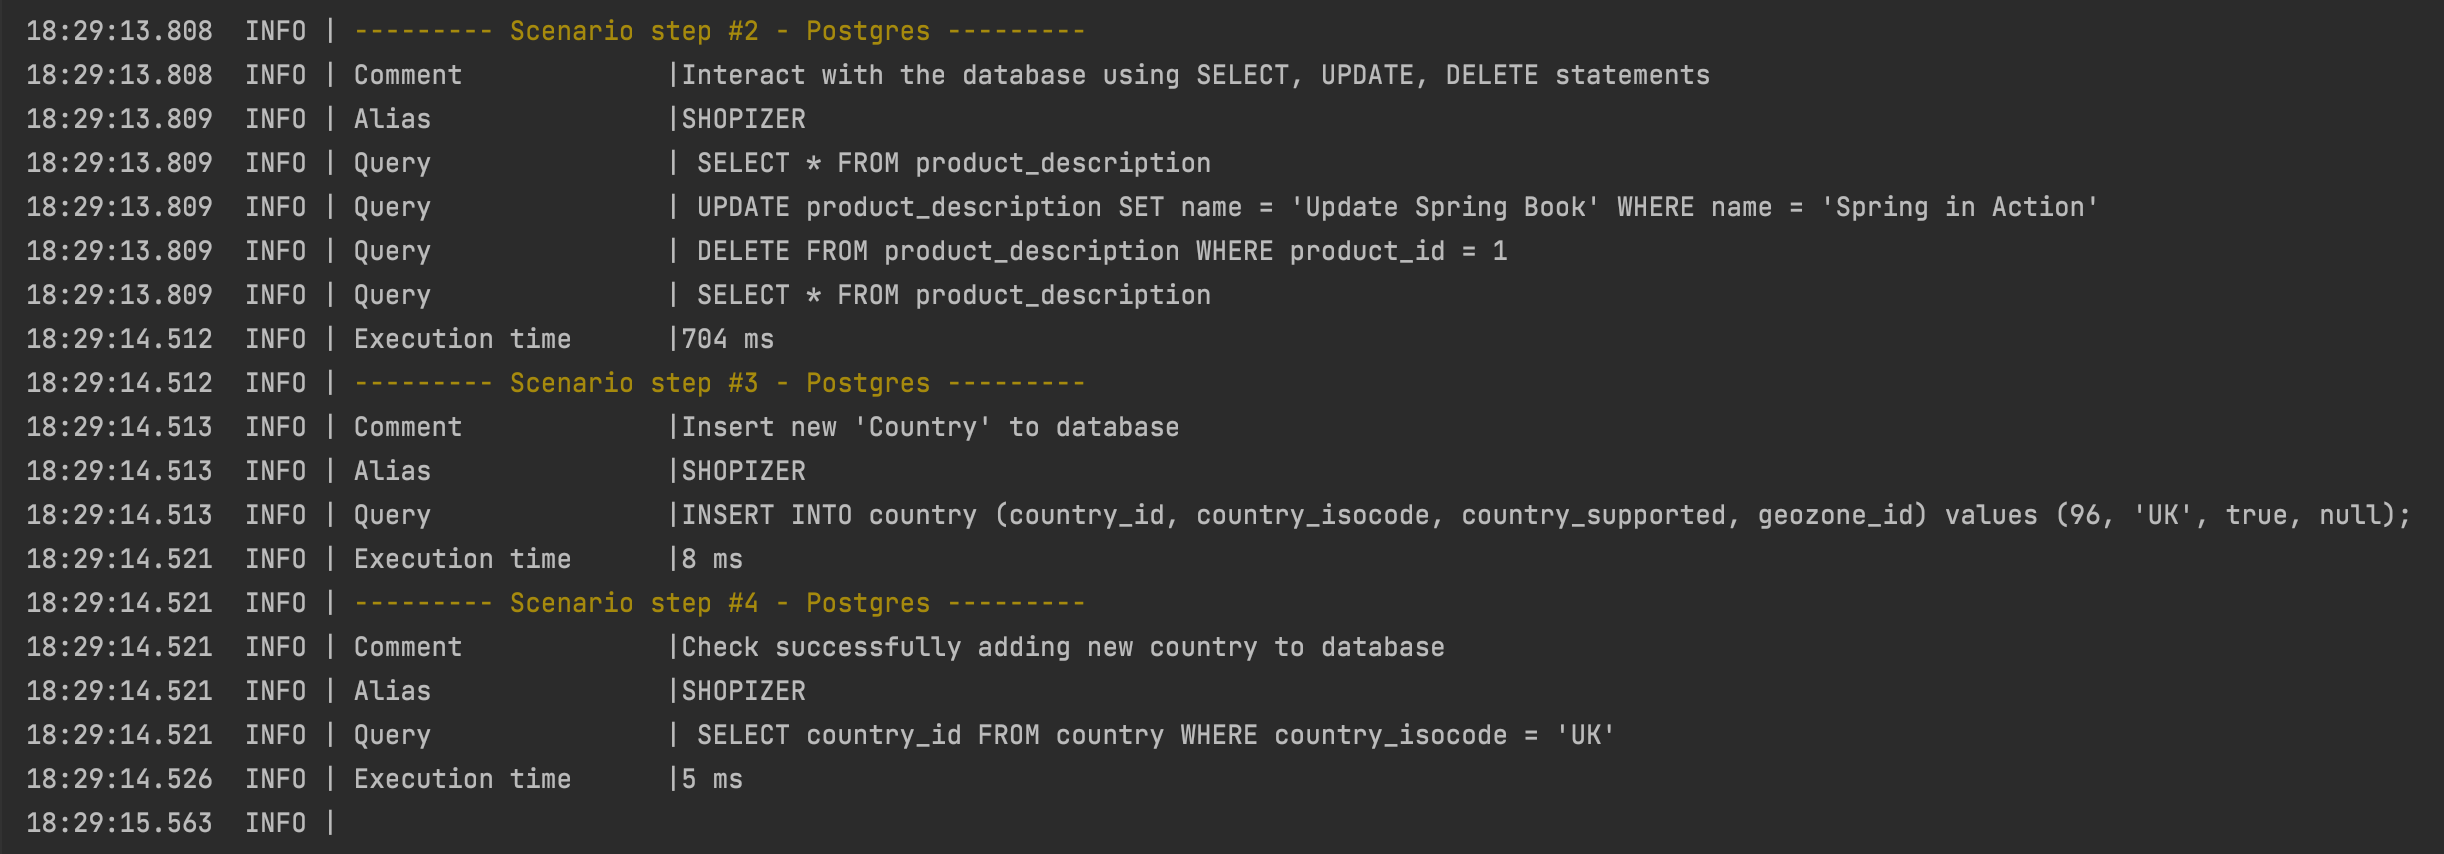
In the
postgrescommand we see:
Comment- a unique parameter for each tag that describes the action of the step.Alias- unique alias of the database we are interacting with.Query- database queries.Execution time- a unique value for each tag that prints the execution time of each command.
Reports
Reports Features
- Convenient dashboard with graphs of the results of passing test scenarios
- Using the Reporting Tool locally and on the server
- Step-by-step analysis of each step of the test script
- Full stacktrace of each step
- Access to view screenshots of each step
- Availability for the entire development team
Using the Reporting Tool locally and on the server
Testlum gives you the ability to view the passing statistics of your test scenarios:
- Locally
- On the server
To set up Reporting Tool configurations:
- Configure
reportsection inglobal-config.xml<report> <extentReports projectName="mega-test-app" onlyFailedScenarios="false"> <htmlReportGenerator enabled="true"/> <klovServerReportGenerator enabled="false"> <mongoDB host="localhost" port="27016"/> <klovServer url="http://localhost:1010"/> </klovServerReportGenerator> </extentReports> </report>
| Tag | Attribute(s) | Required | Default | Description |
|---|---|---|---|---|
<extentReports> |
projectName |
true | - | Indicating a name of the project |
<htmlReportGenerator> |
enabled |
true | - | Turning on/Turning off the local HTML report (true | false) |
<klovServerReportGenerator> |
enabled |
true | - | Turning on/Turning off the report on the server (true | false) |
<mongoDB> |
host, port
|
true |
localhost, 27017
|
Passing your host and port to generate the report on the server |
<klovServer> |
url |
true | http://localhost:1010 |
Indicating URL of the server for reports |
Local report generation
- To run a local html report, make sure that
<htmlReportGenerator enable="true"/>.- Run your test scenarios.
- Open the report folder.
- Open the generated report in the suggested browser:
Reports dashboard:
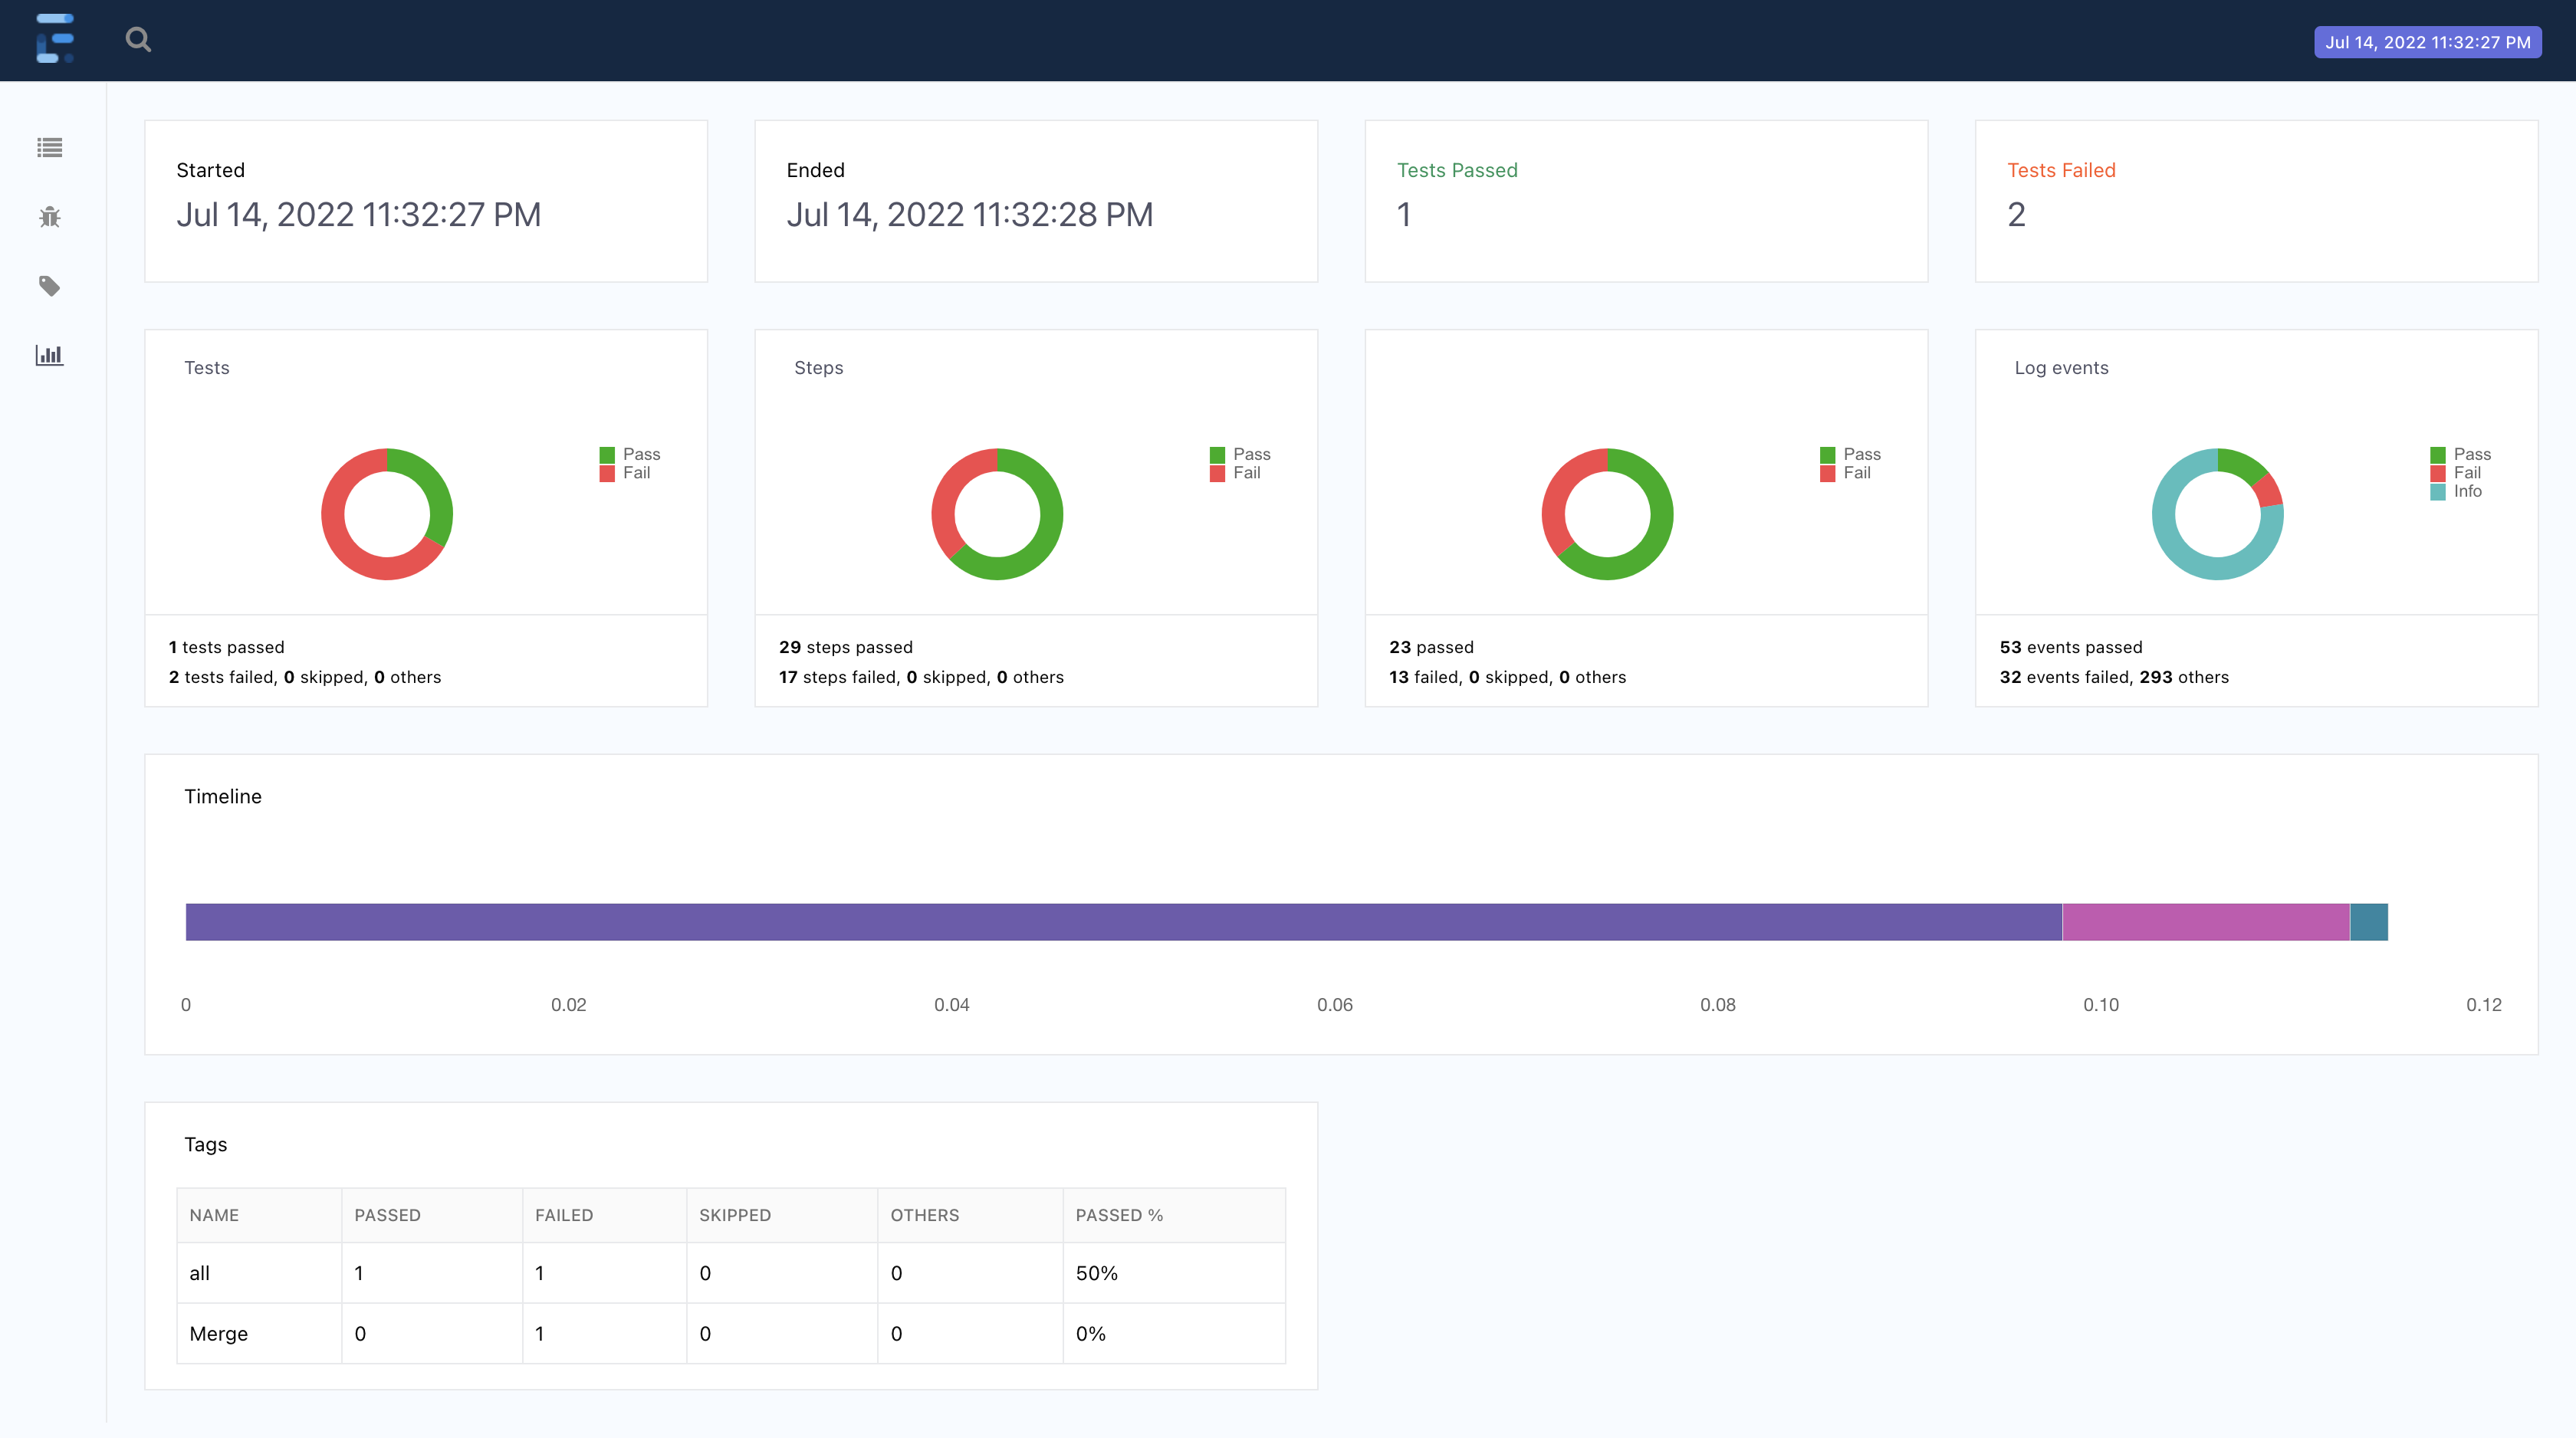
The report dashboard contains all the necessary information about the tests passed
- Number of running tests
- Time and launch date
- Test results
- Number of passed/failed steps
- Log events
- Timeline
- Tags
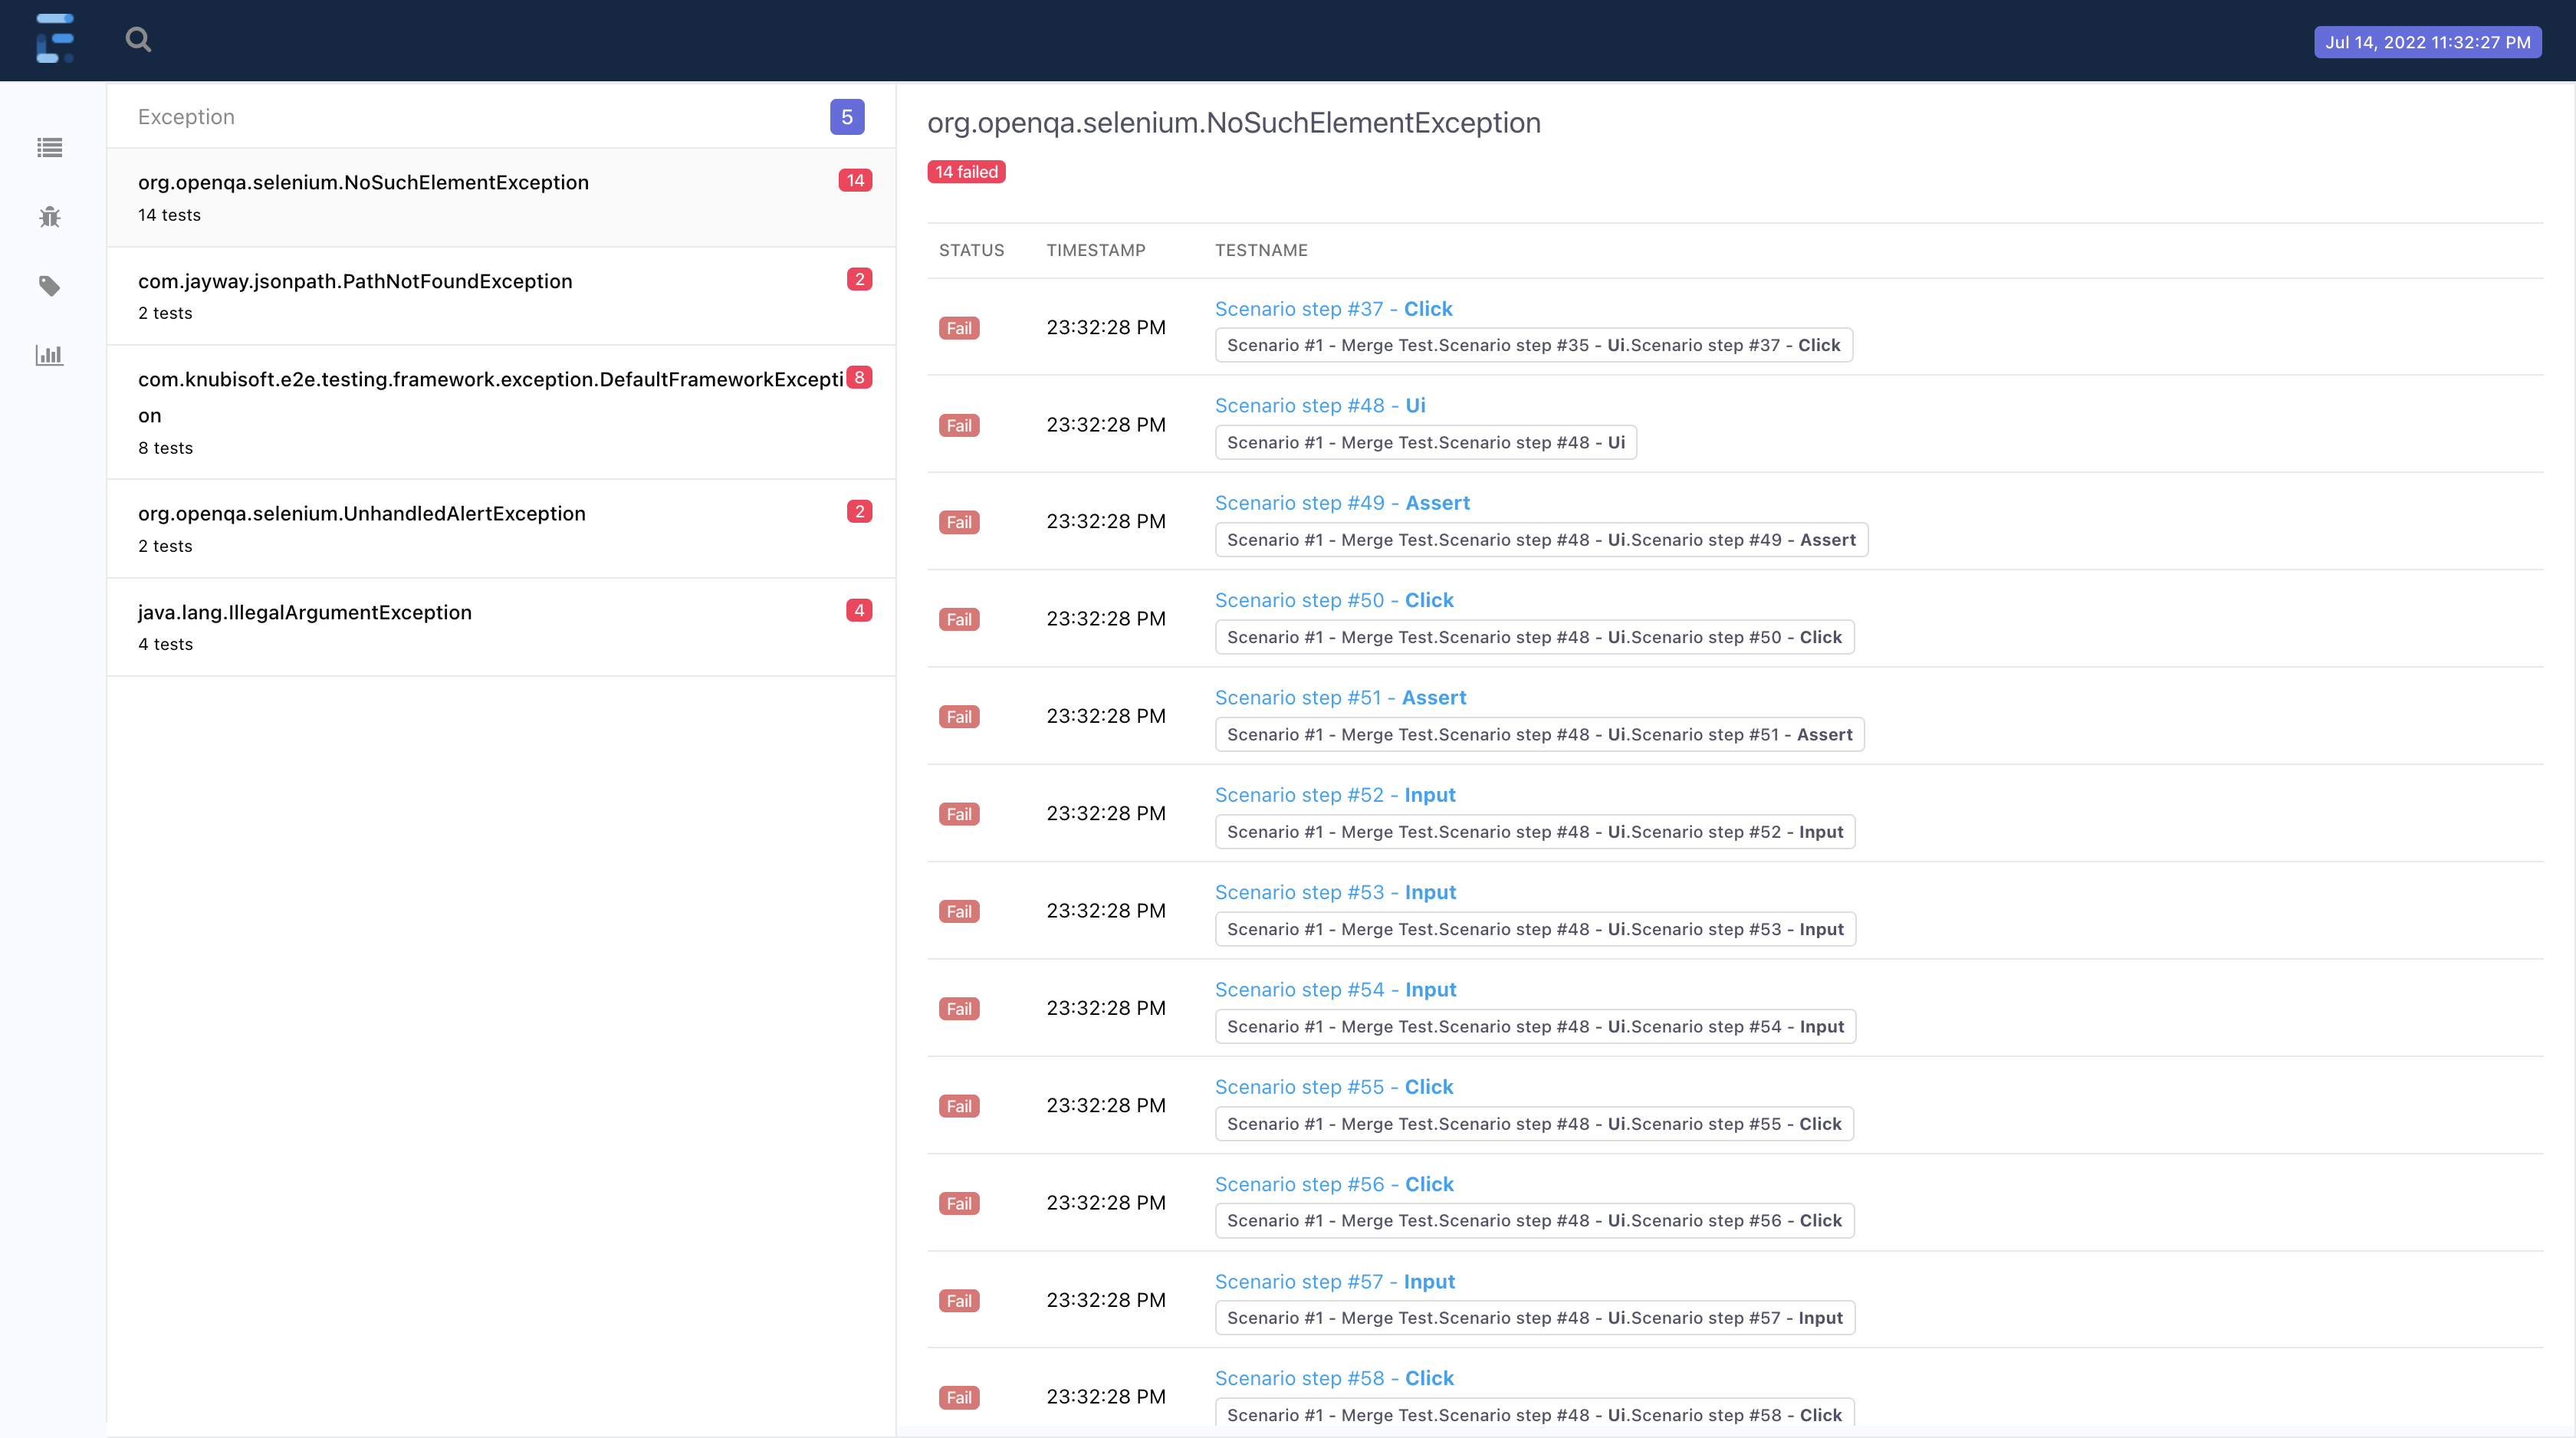
- Detailed report Exception
- Exceptions on each step of the test scenario
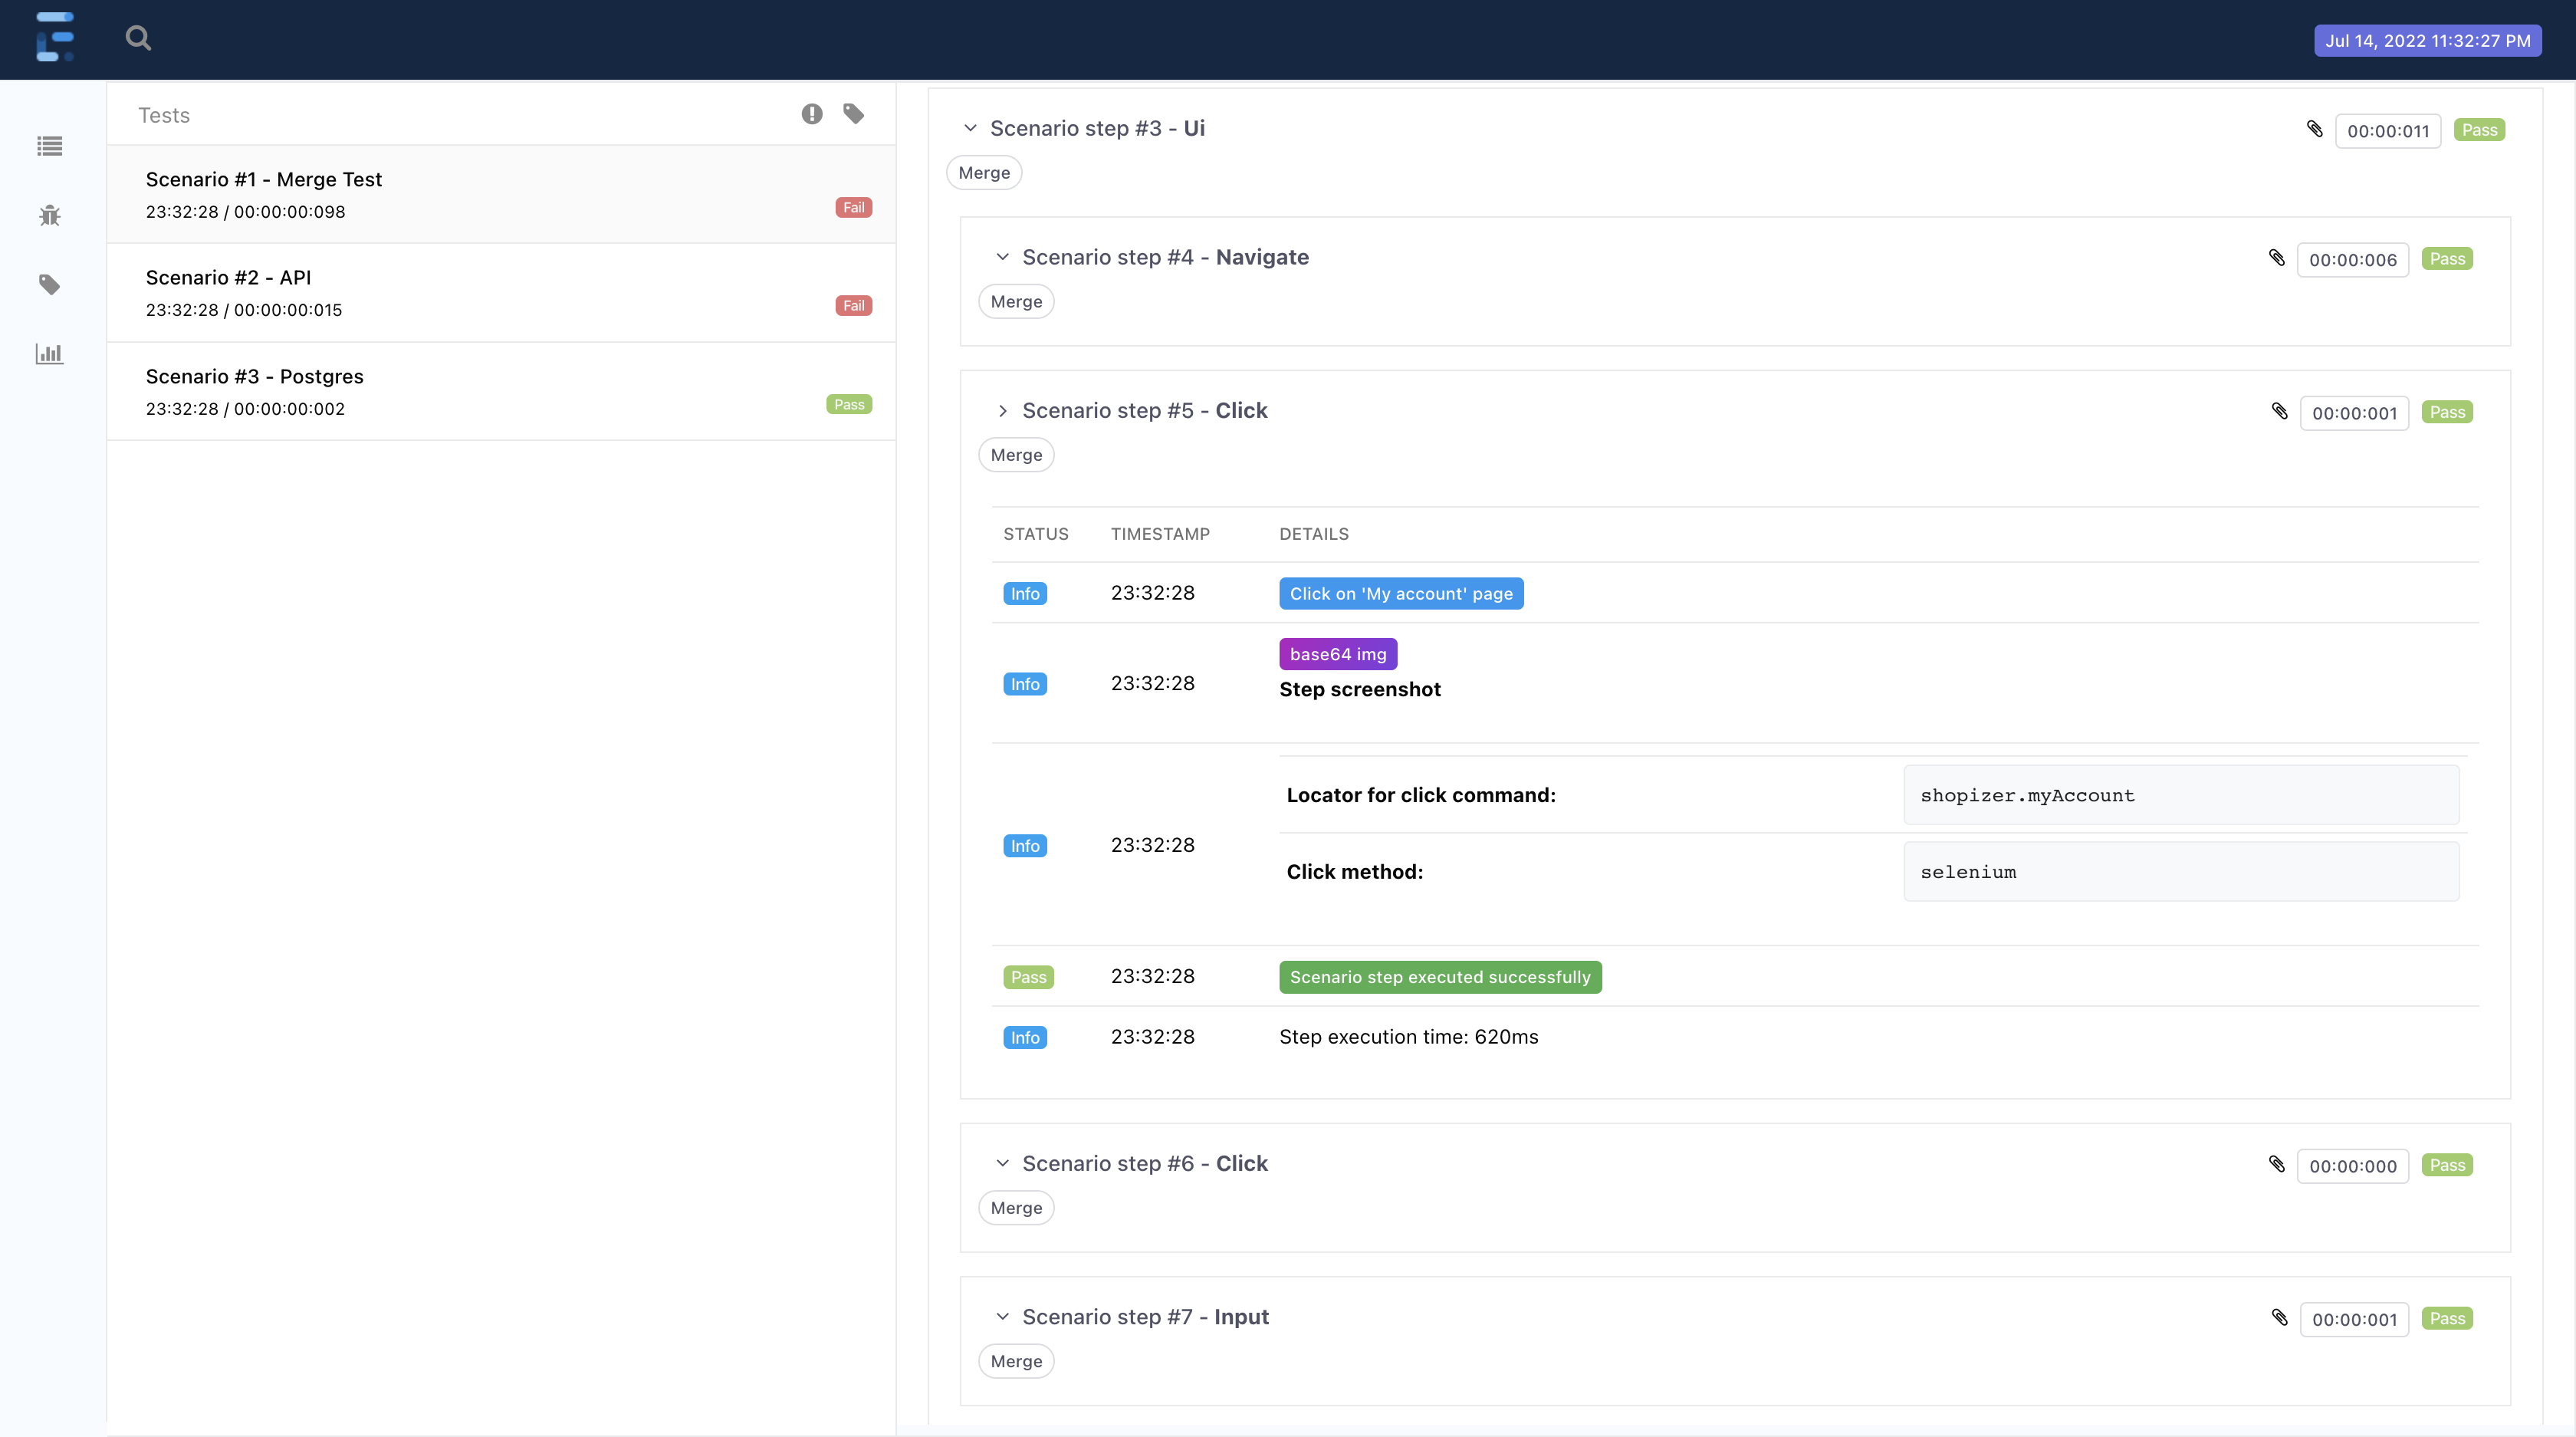
- Ability to view every step of the test scenario
- Opening the screenshots of each WEB step
Report generation on the server
To generate a report on the server, you must have a 'docker-compose-report.file' created and configured.
version: "3.4"
services:
  mongodb:
    image: mongo:5.0.9
    container_name: mongo_klov
    ports:
      - 27017:27017

  klov:
    image: anshooarora/klov:1.0.1
    container_name: klov
    environment:
      - SPRING_DATA_MONGODB_URI=mongodb://mongodb:27017
    ports:
      - 1010:80
    depends_on:
      - mongodb
Running a report
- To run a report on the server, make sure that
<klovServerReportGenerator enable="true">.- Run your docker-compose-report.file.
- Go to the specified host in global.config.file - inside the tag
<klovServer url="http://localhost:1010"/>.- Run the test scenarios.
Dashboard Server Report:
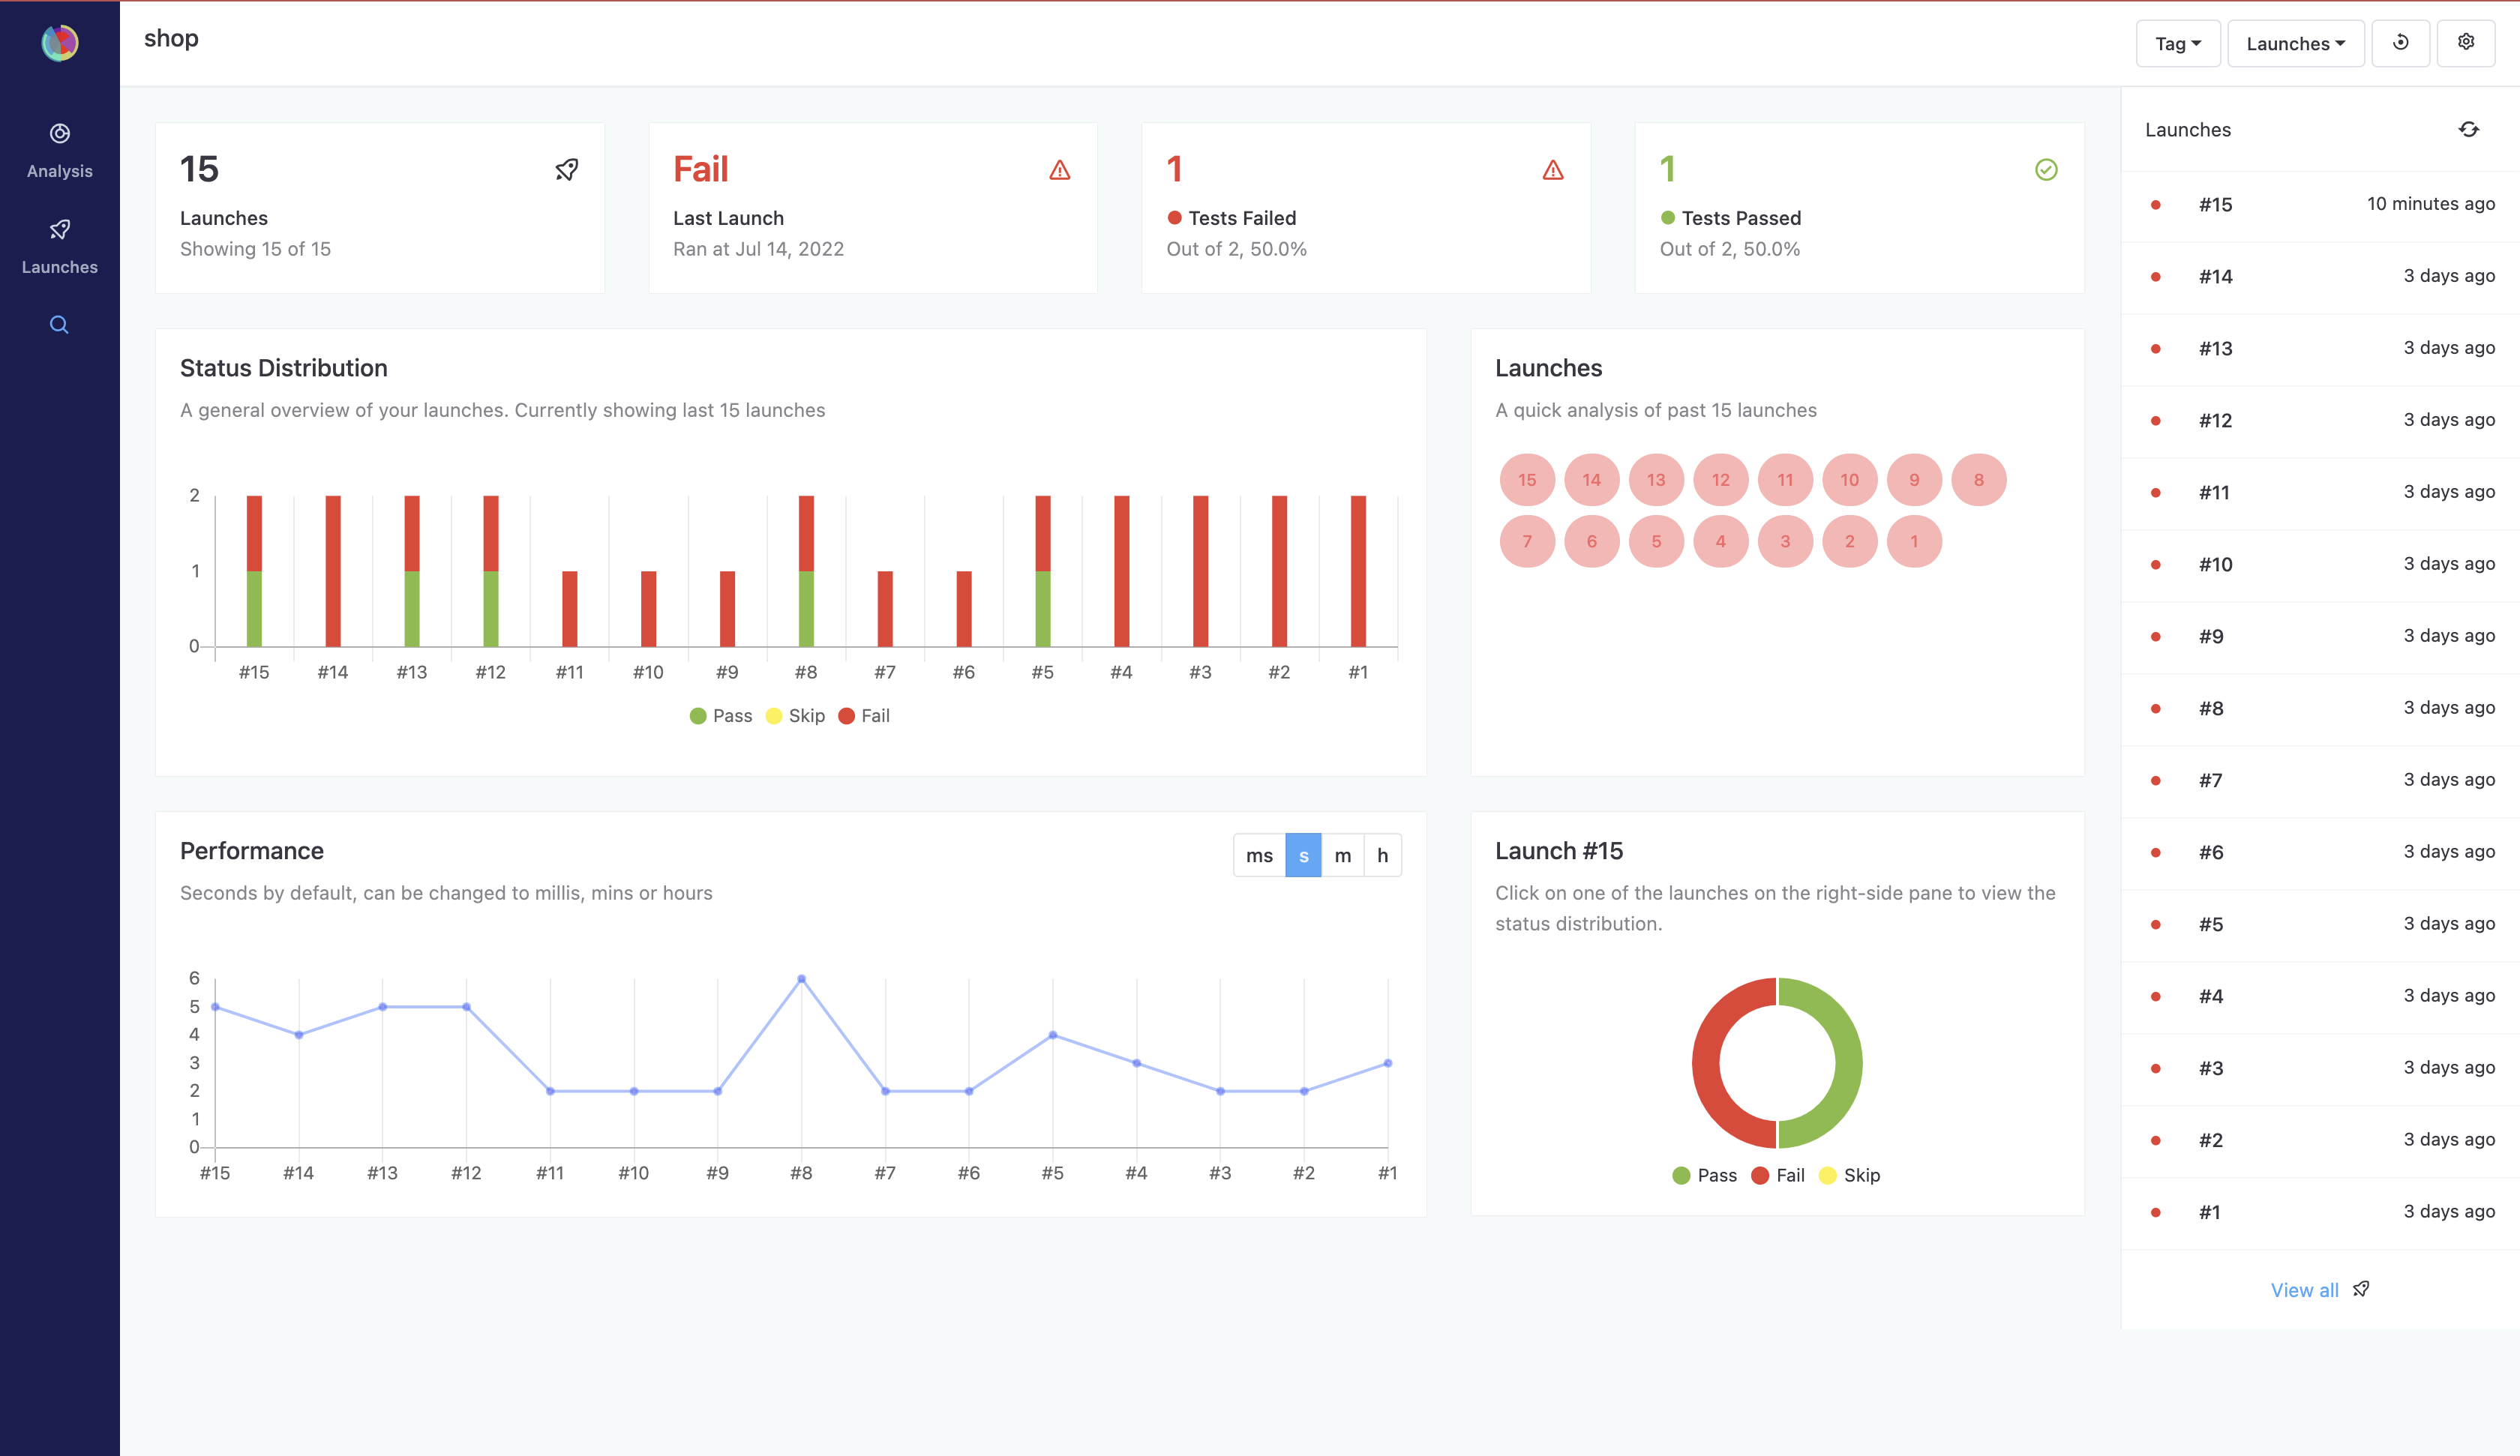
The dashboard page contains information about:
- Total number of runs
- Result of the last run
- Number of tests passed
- Number of failed tests
- A general overview of your runs in the form of a graph
- Performance graph
- Ability to sort all runs
- Ability to search for a specific test scenario
- Displaying all the runs:
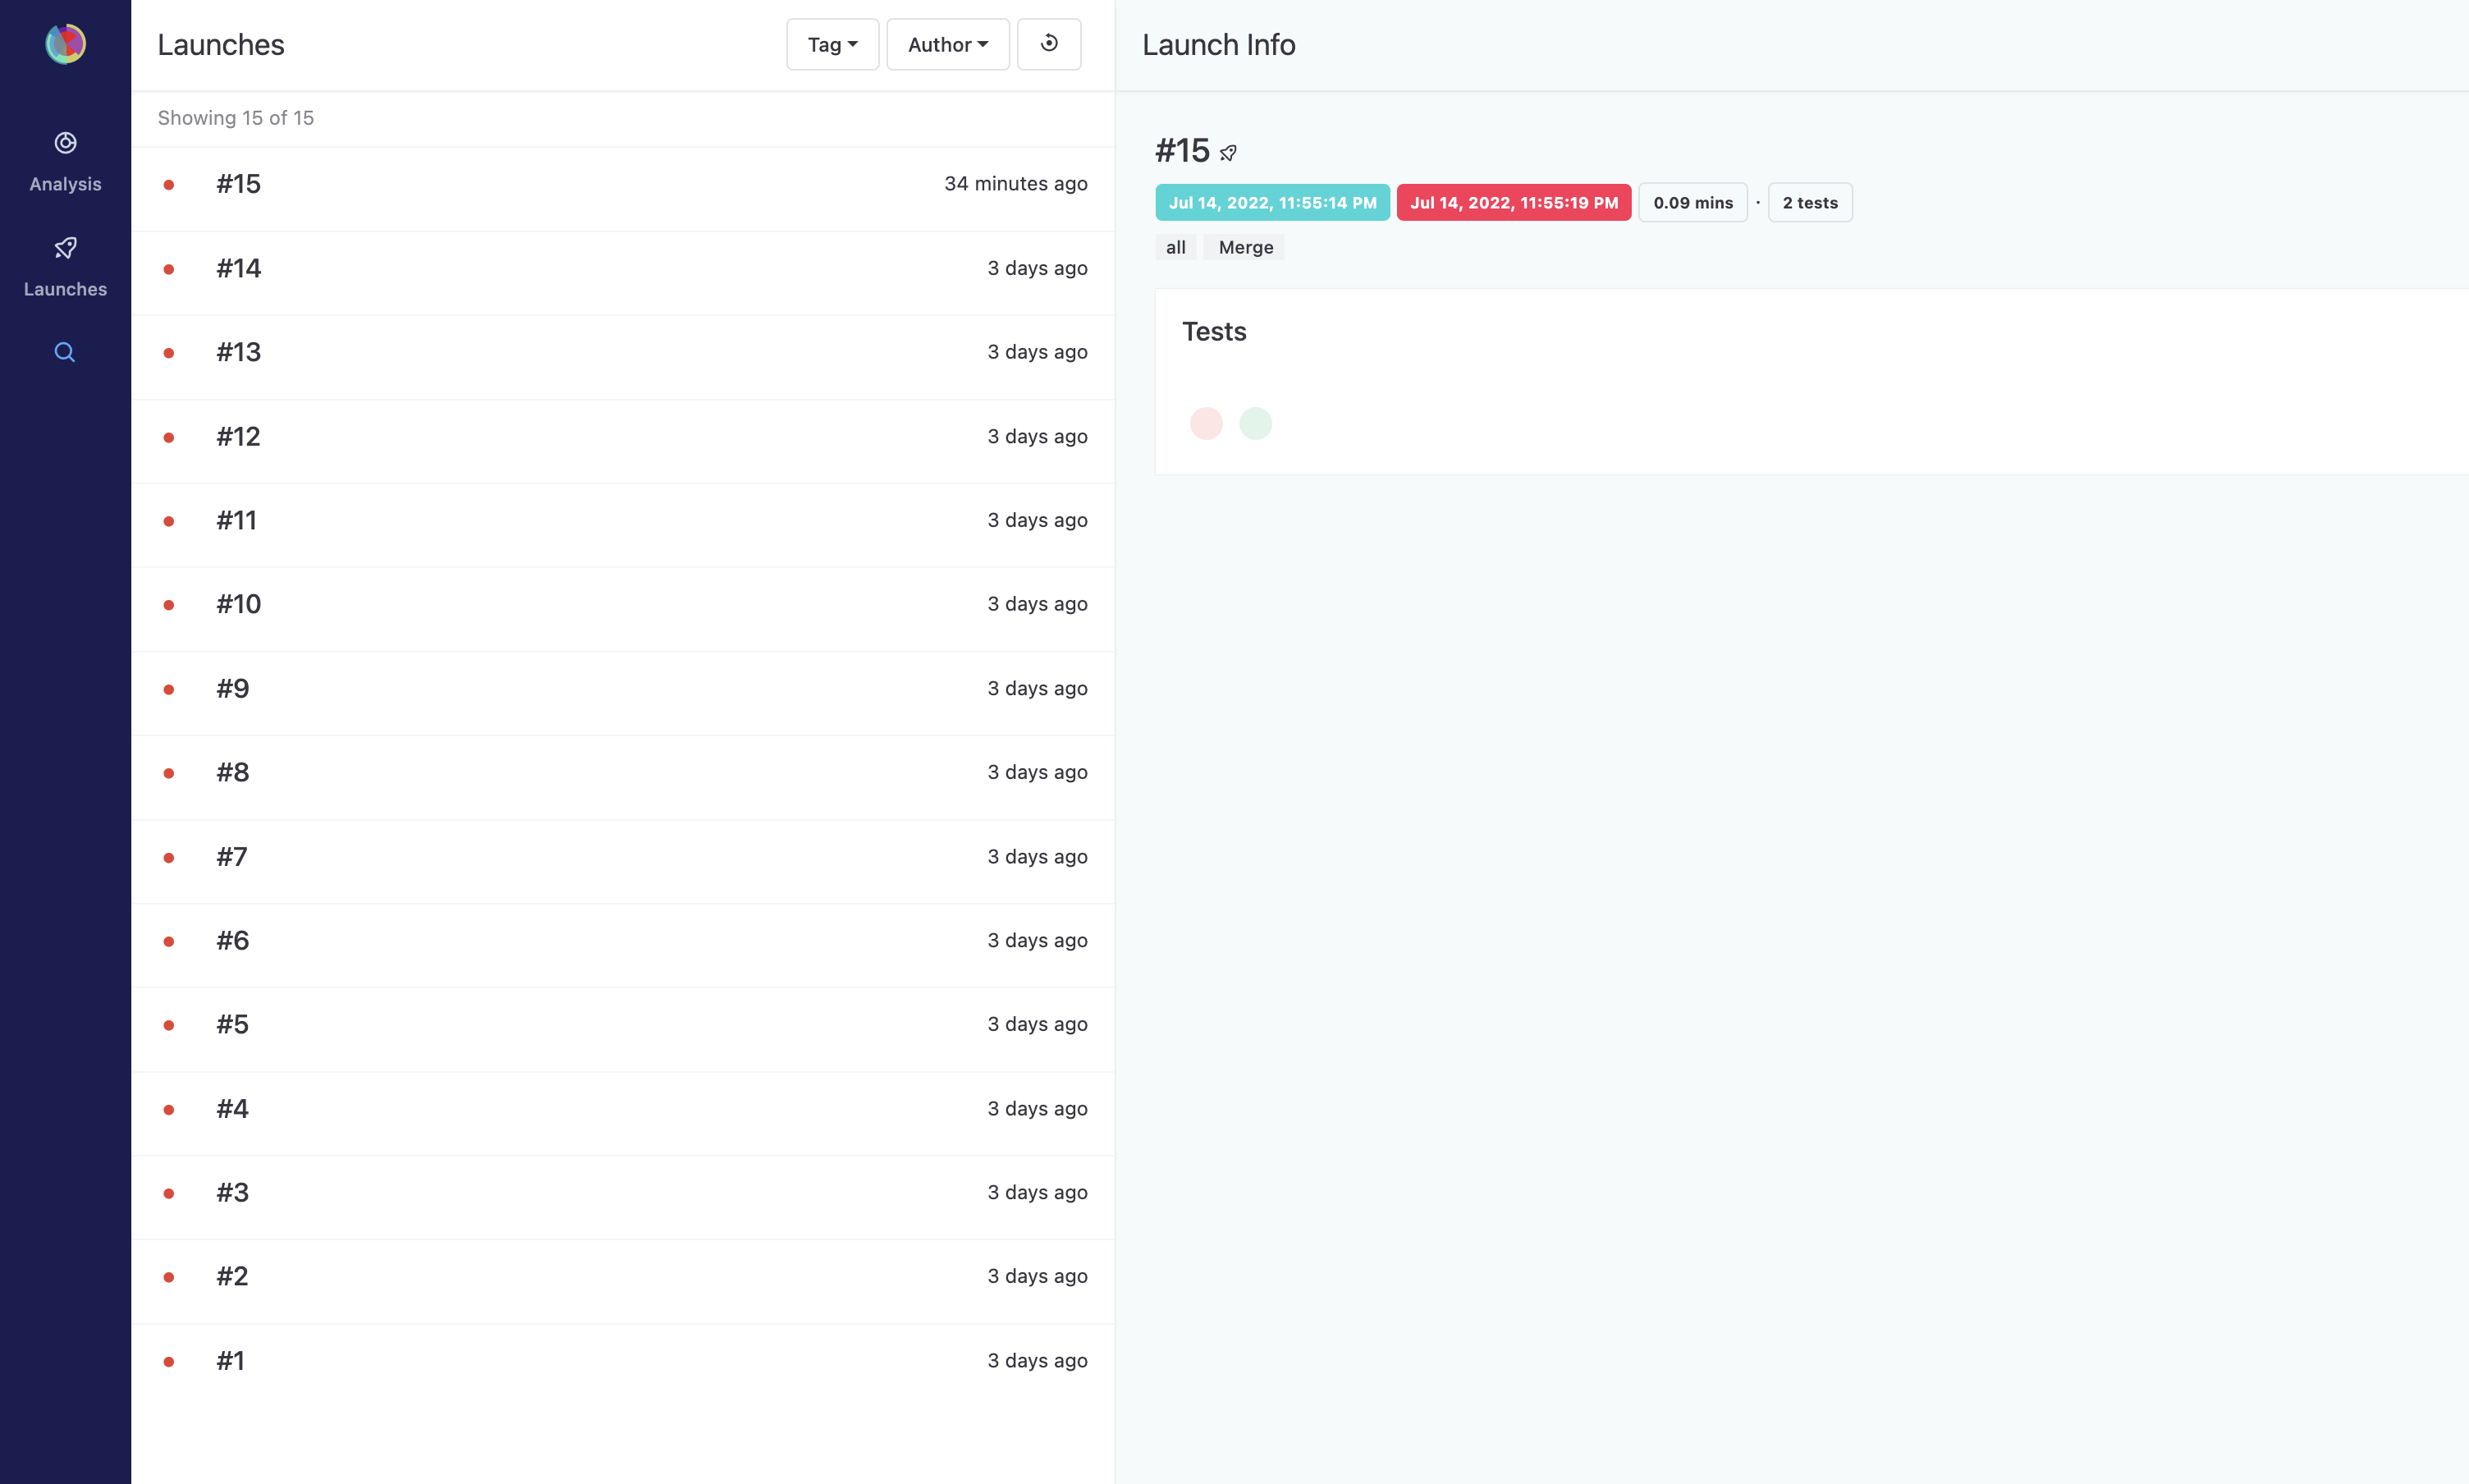
- Ability to view every step of the test scenario
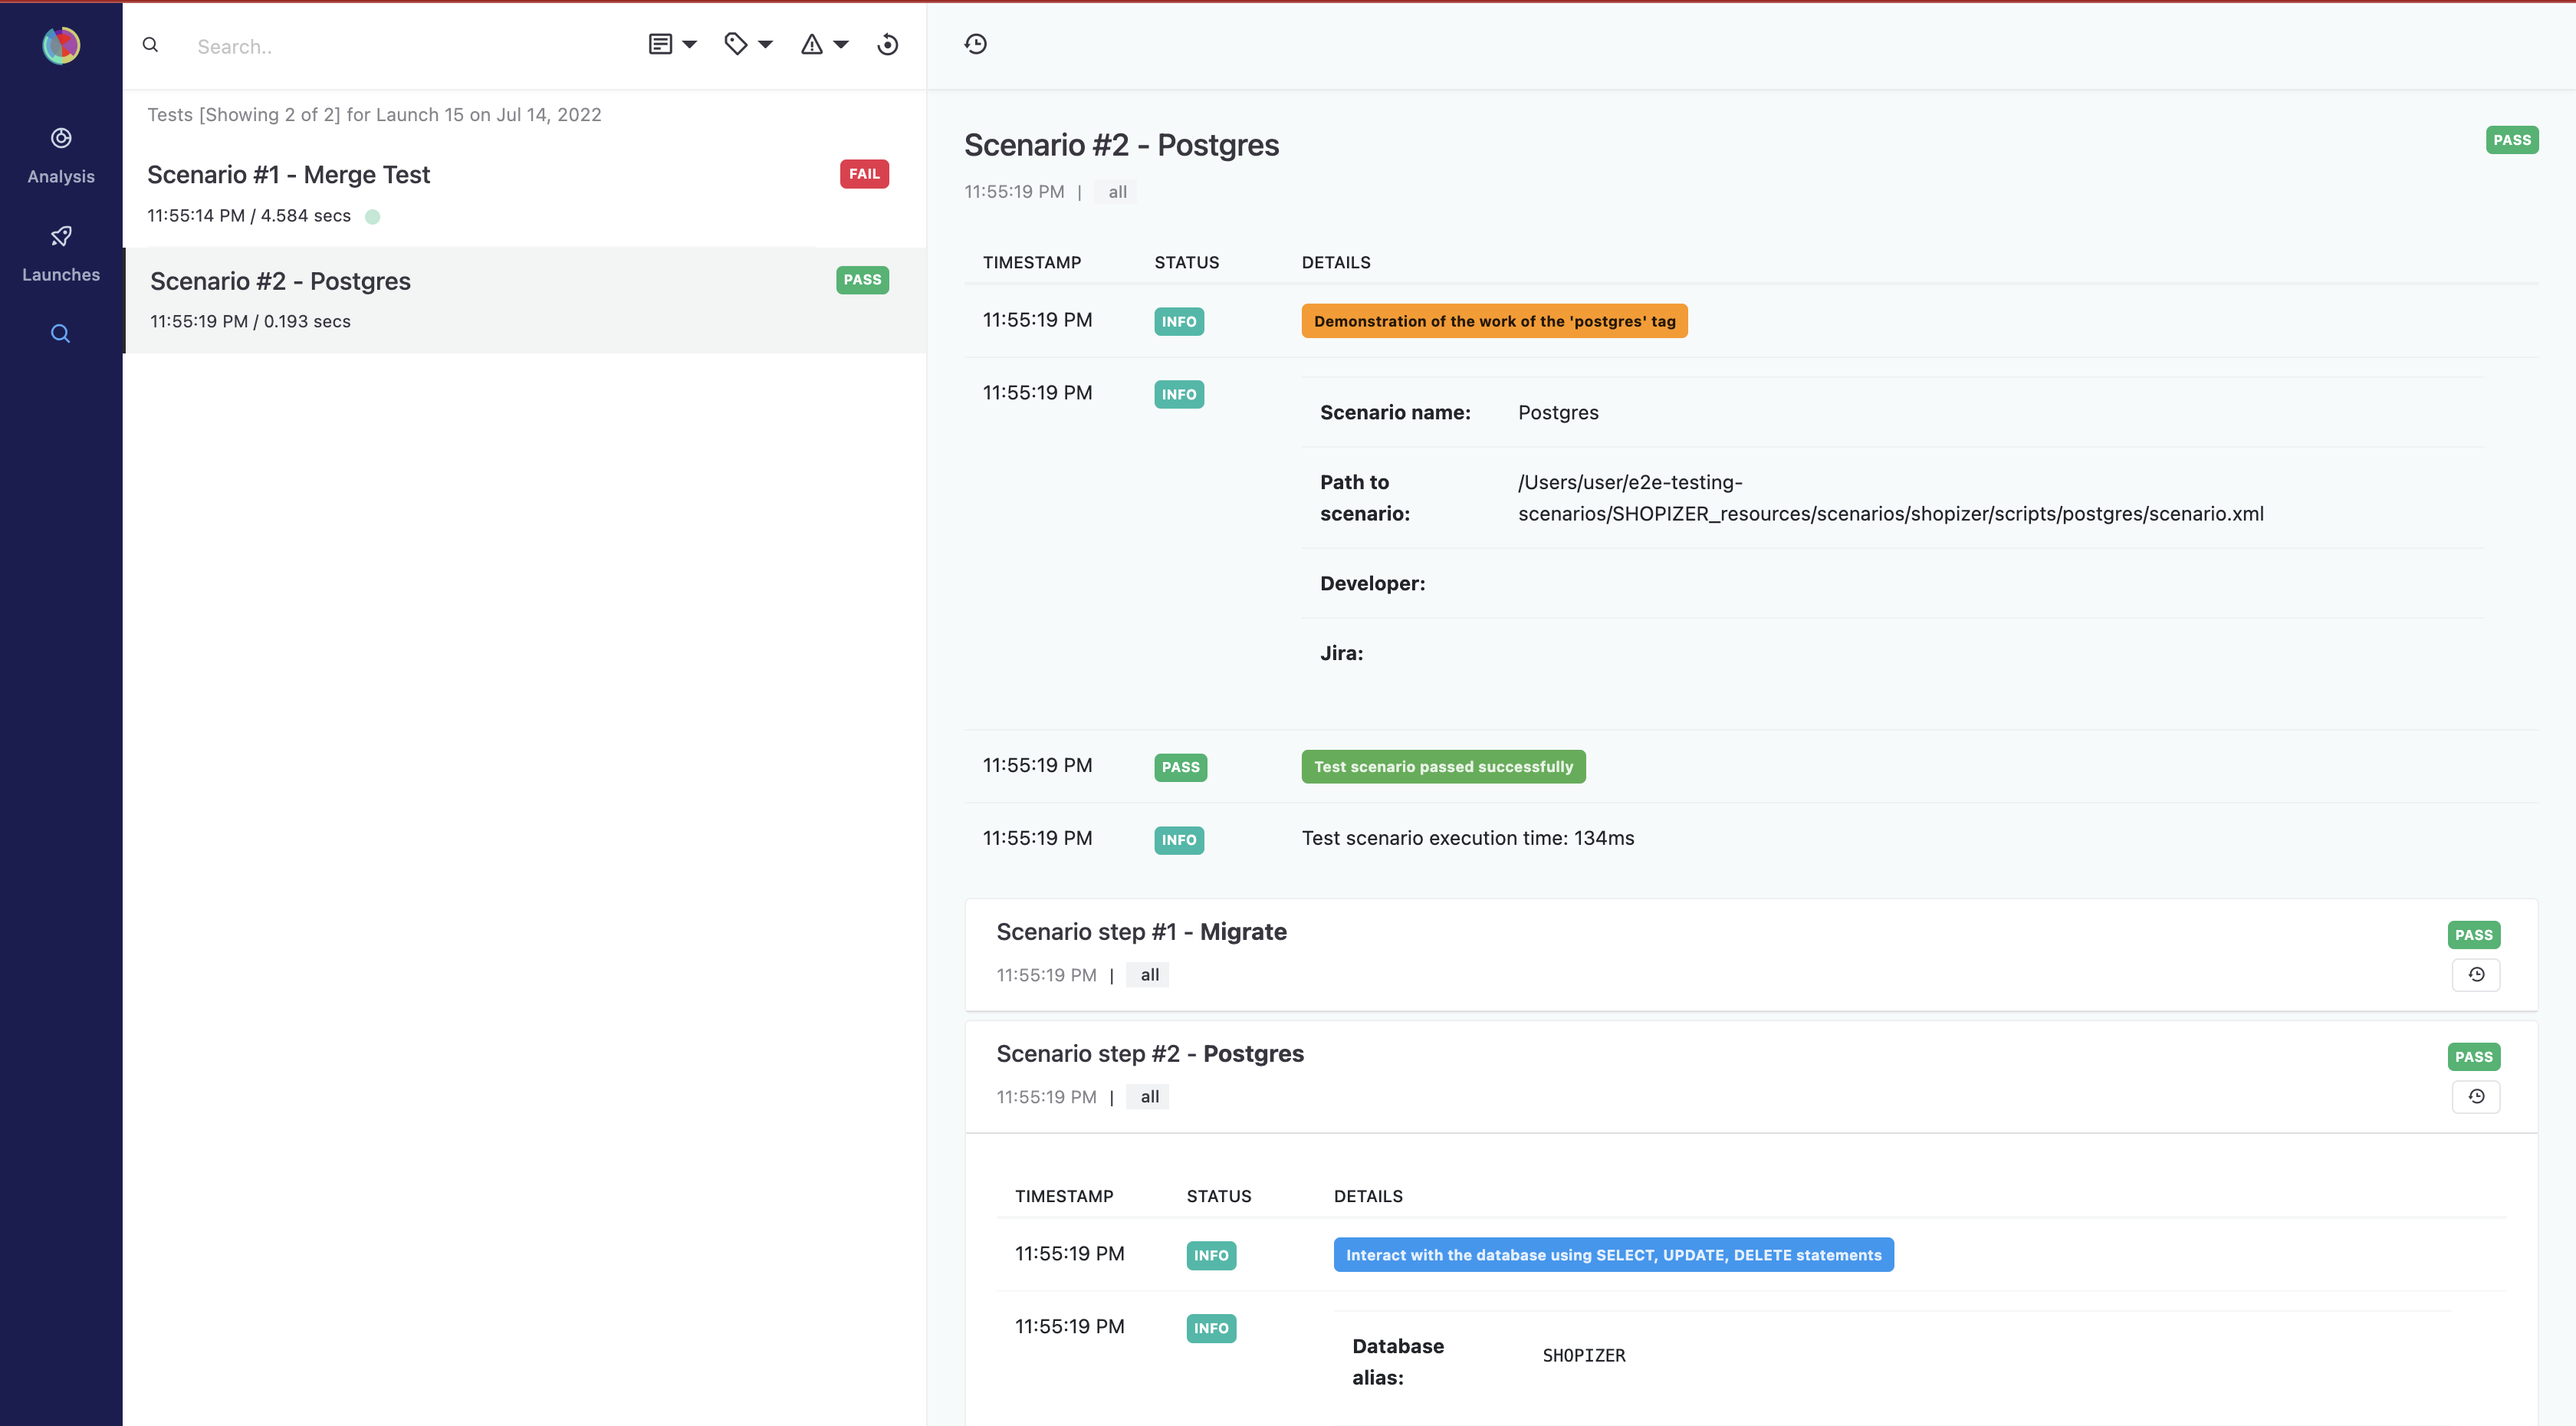
- Detailed display using 'Comparison' functionality
- Ability to view all the screenshots of each WEB step
- Full stackTrace