Continuous Monitoring - TeraLogics/TotalBriecall GitHub Wiki
Continuously Monitoring for Rancid Cheese
Total Briecall uses several different monitoring technologies to make sure our customers don't experience downtime and that we are notified of issues before the customer is impacted.
We use Pingdom, New Relic, and StatusPage.io to help us report on different statistics including:
- Uptime
- Response Time
- Memory Utilization
- Errors
- Avg Throughput
- Transaction Response Time (DB and Web)
- Total Instances (Dynos)
- SLA
- Scalability
These tools integrate with Heroku and with the actual code to report issues to our devops team.
Our status page can be found here.
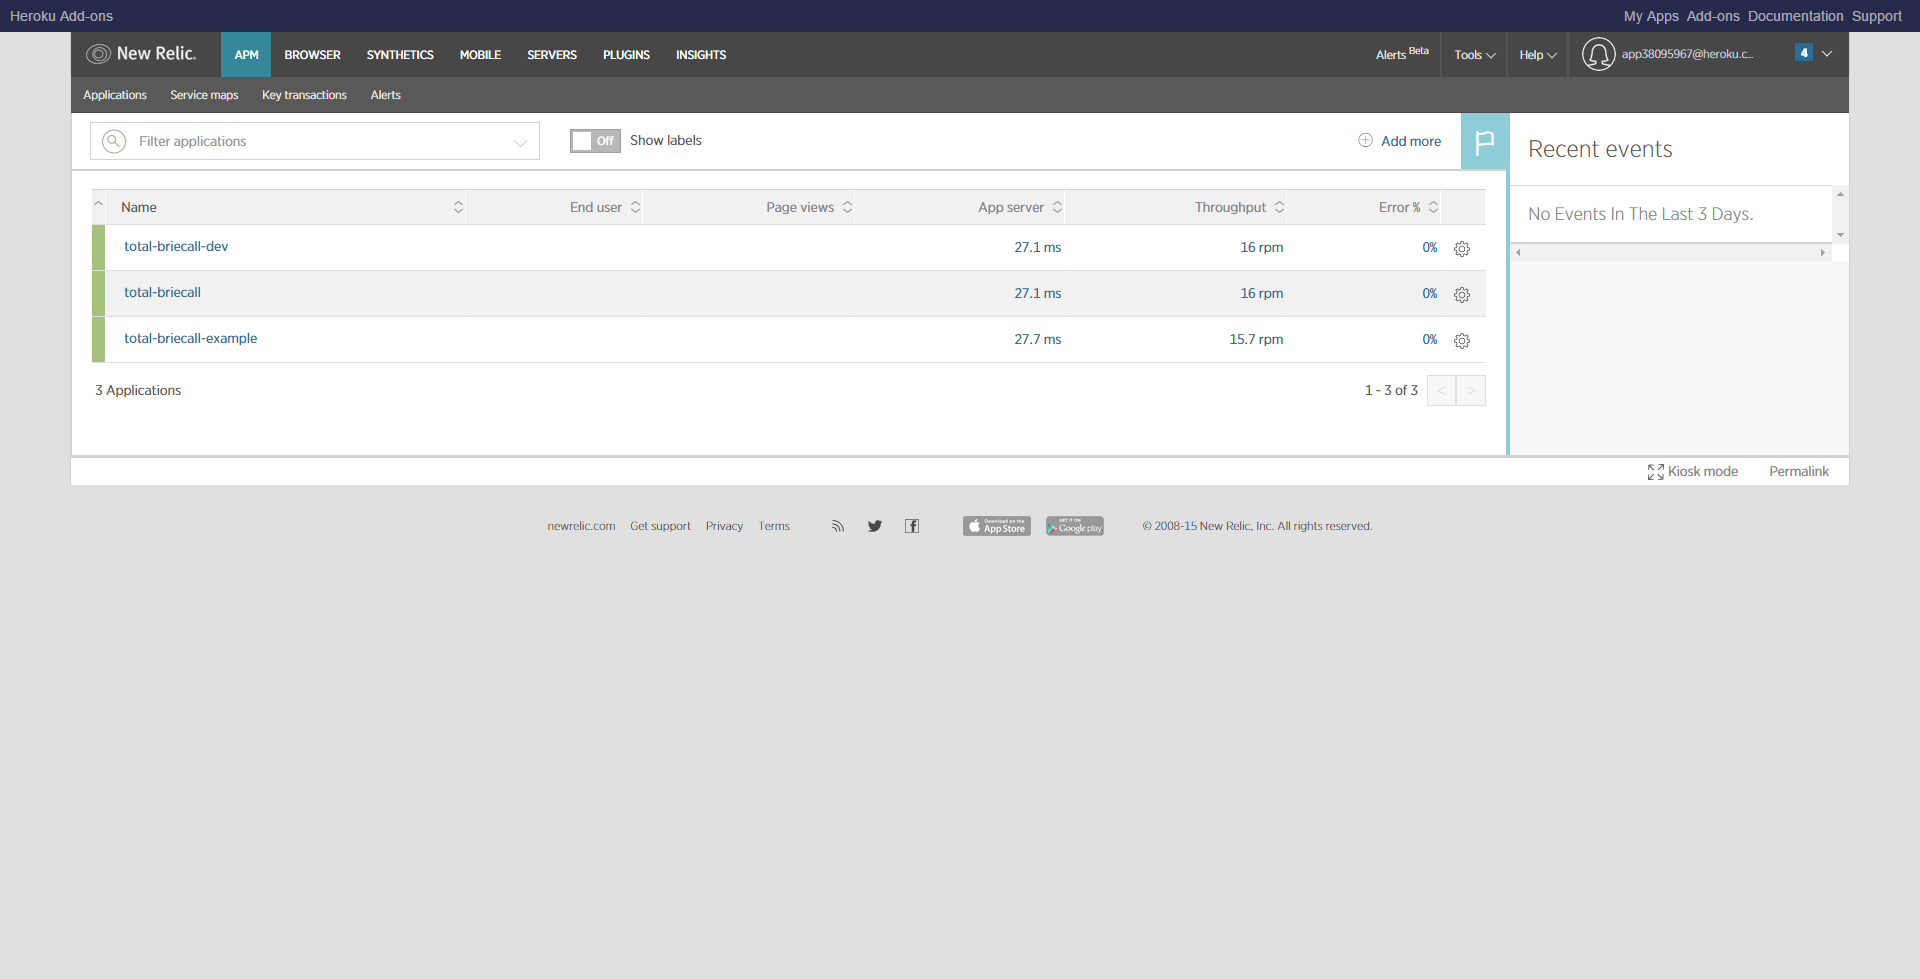
New Relic
This tool monitors the internals of our application providing in-depth analysis of our NodeJS processes for all of our applications and provides a dashboard to monitor key metrics.
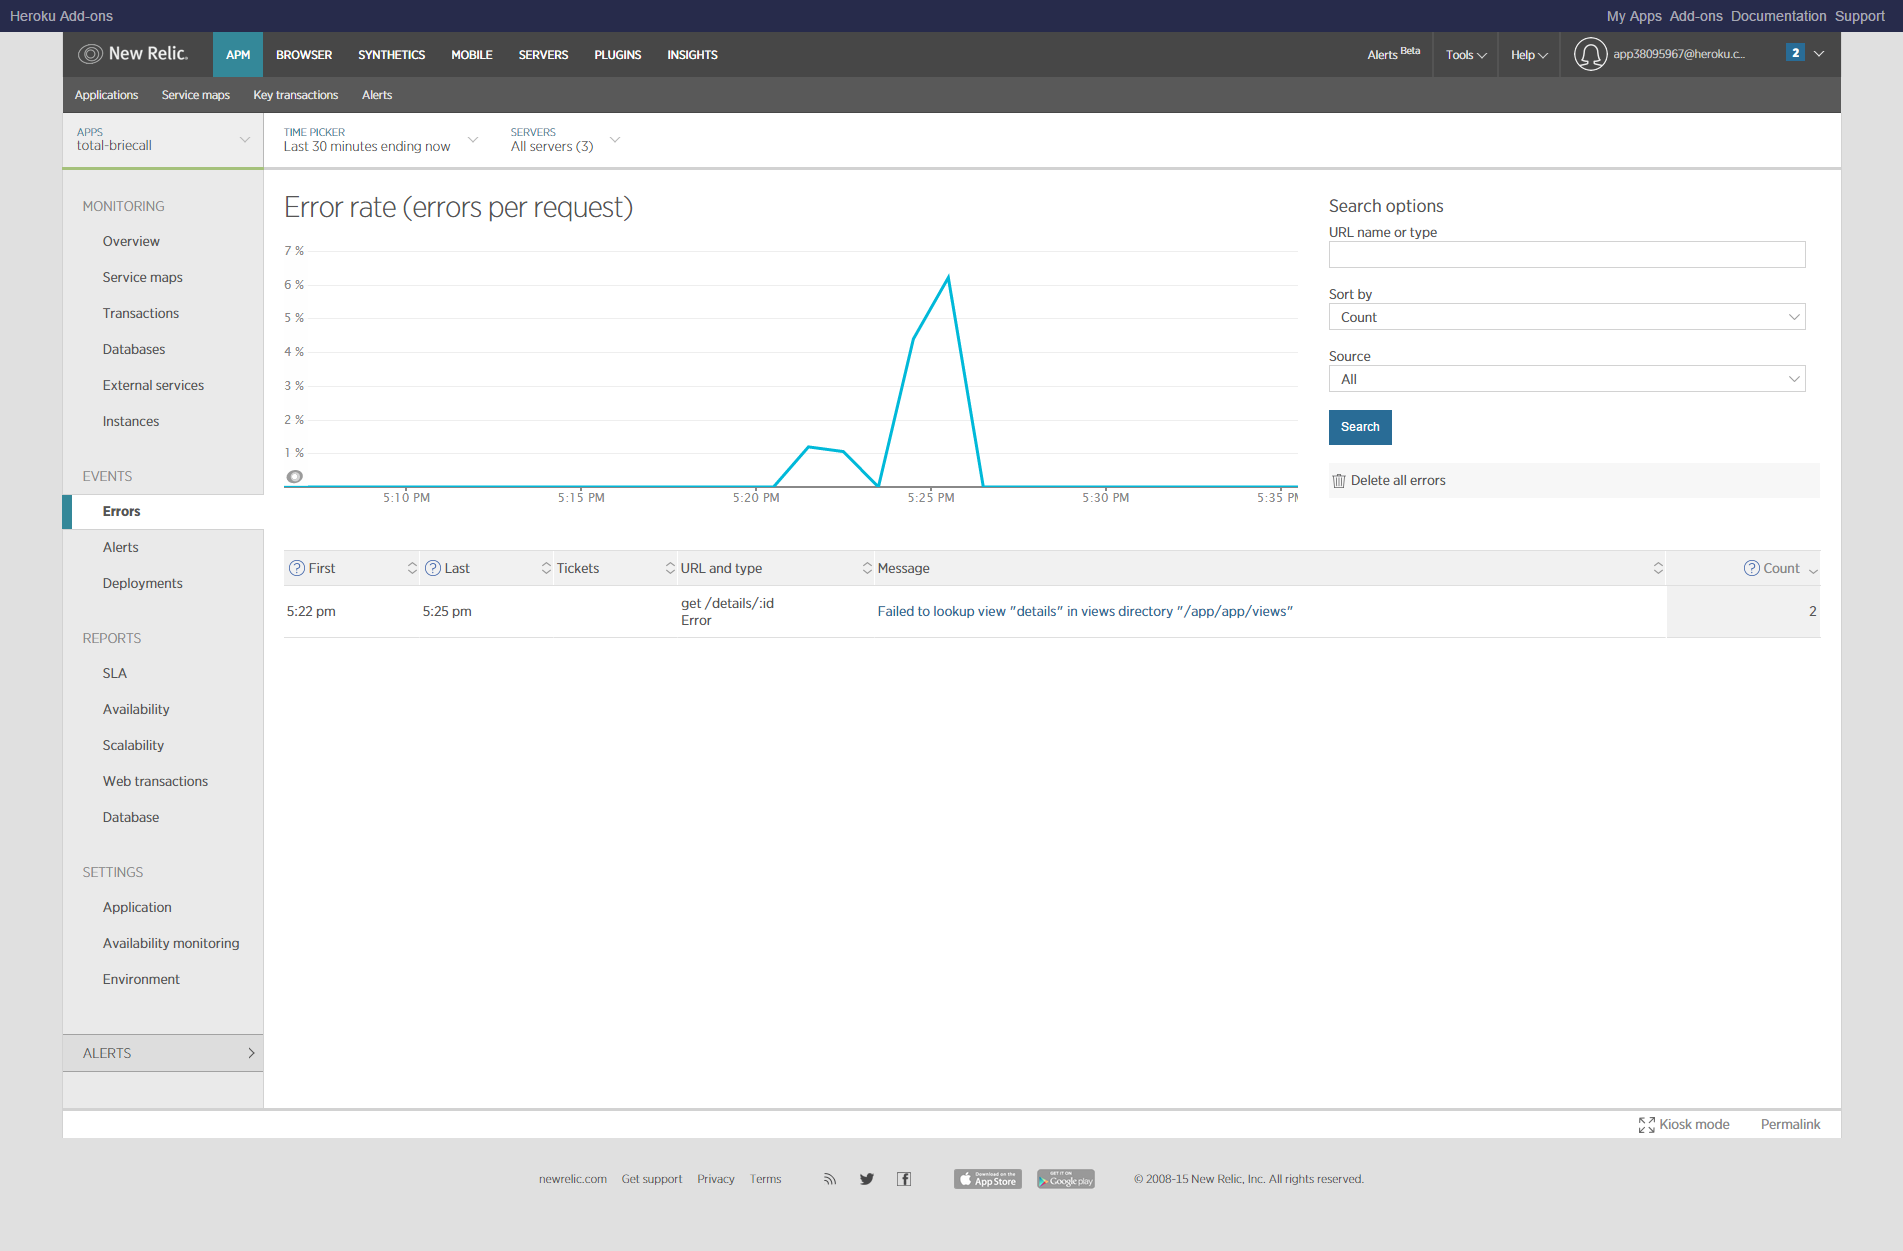
Error Reporting
New Relic reports any errors that are produced in the code which help our teams to identify issues as they happen and provide state information so the errors are easy to troubleshoot, fix, unit test, run through the CI system, and ultimately deploy automatically.
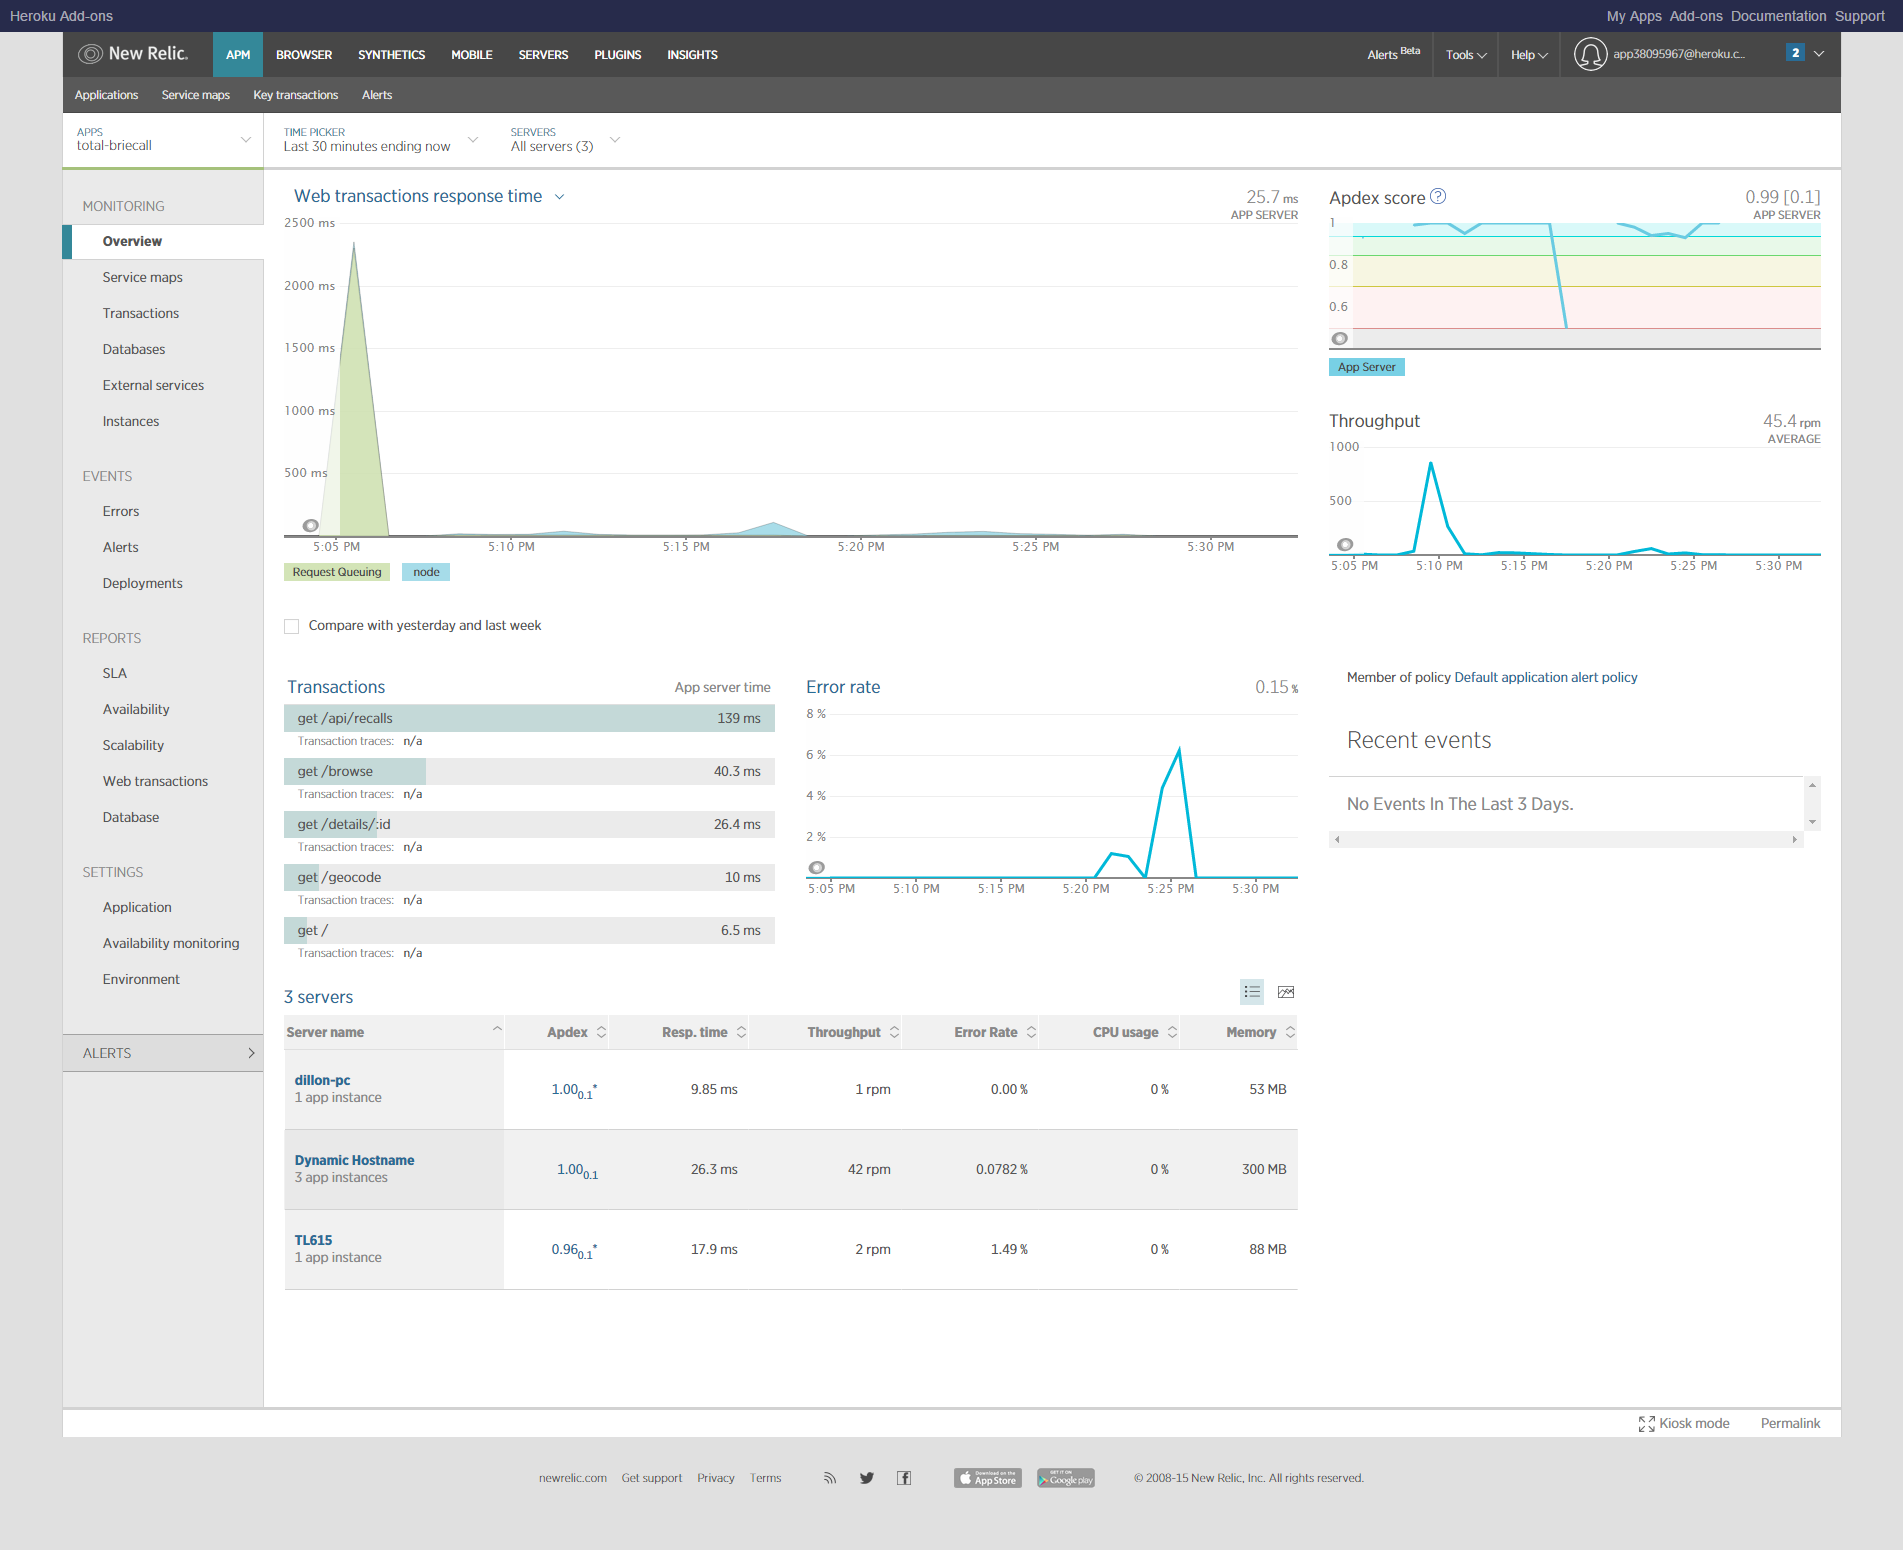
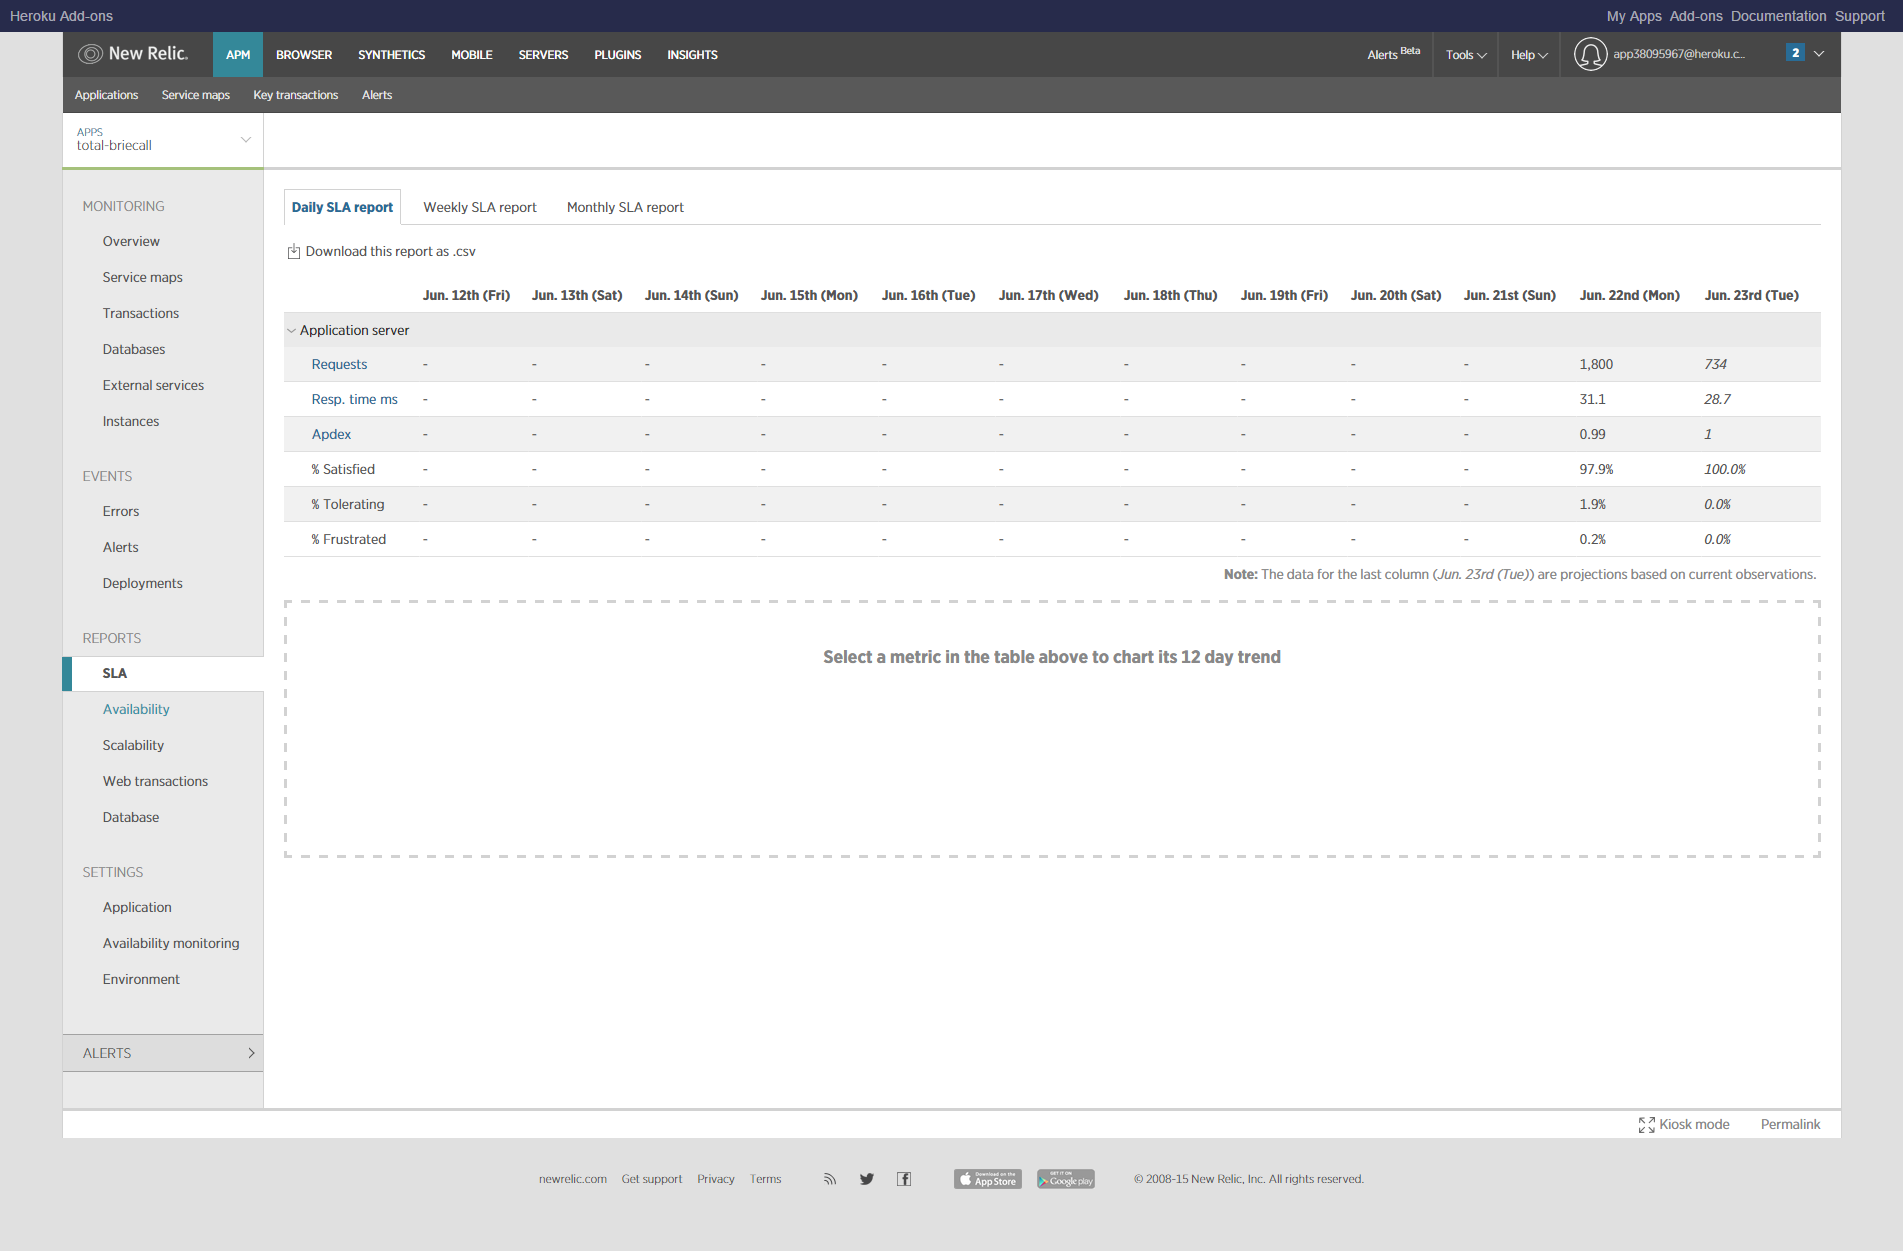
SLAs
Because New Relic is integrated into our code, it can report transaction level statistics. This allows us to implement SLAs for our API and notifies our teams if those SLAs are broken. This is important to determine slow transactions and also to alert our teams to larger system problems with external resources, such as third party APIs and data stores.
Once an anomaly is detected our operations teams can then view specific transactions that might be causing issues whether they be datastore, external, or web.
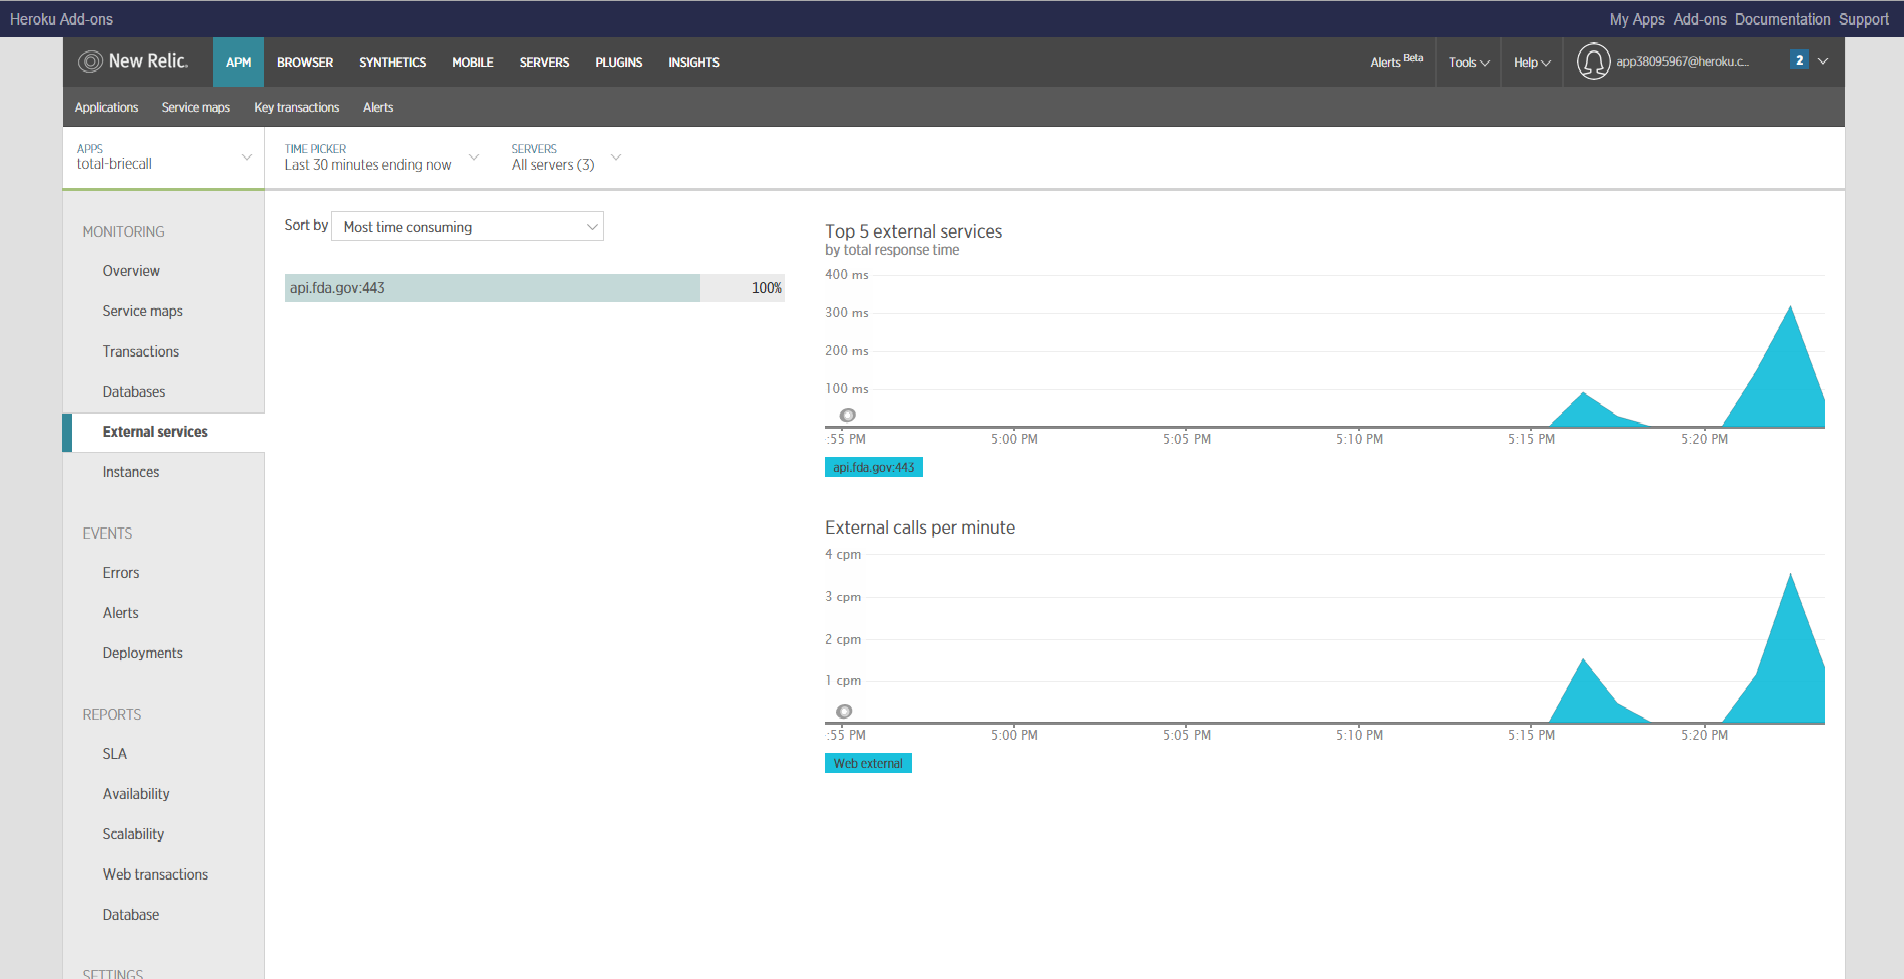
External Services
This report show metrics against the openFDA database to ensure that even though we are using external APIs to provide data, that our users are getting the best experience possible.
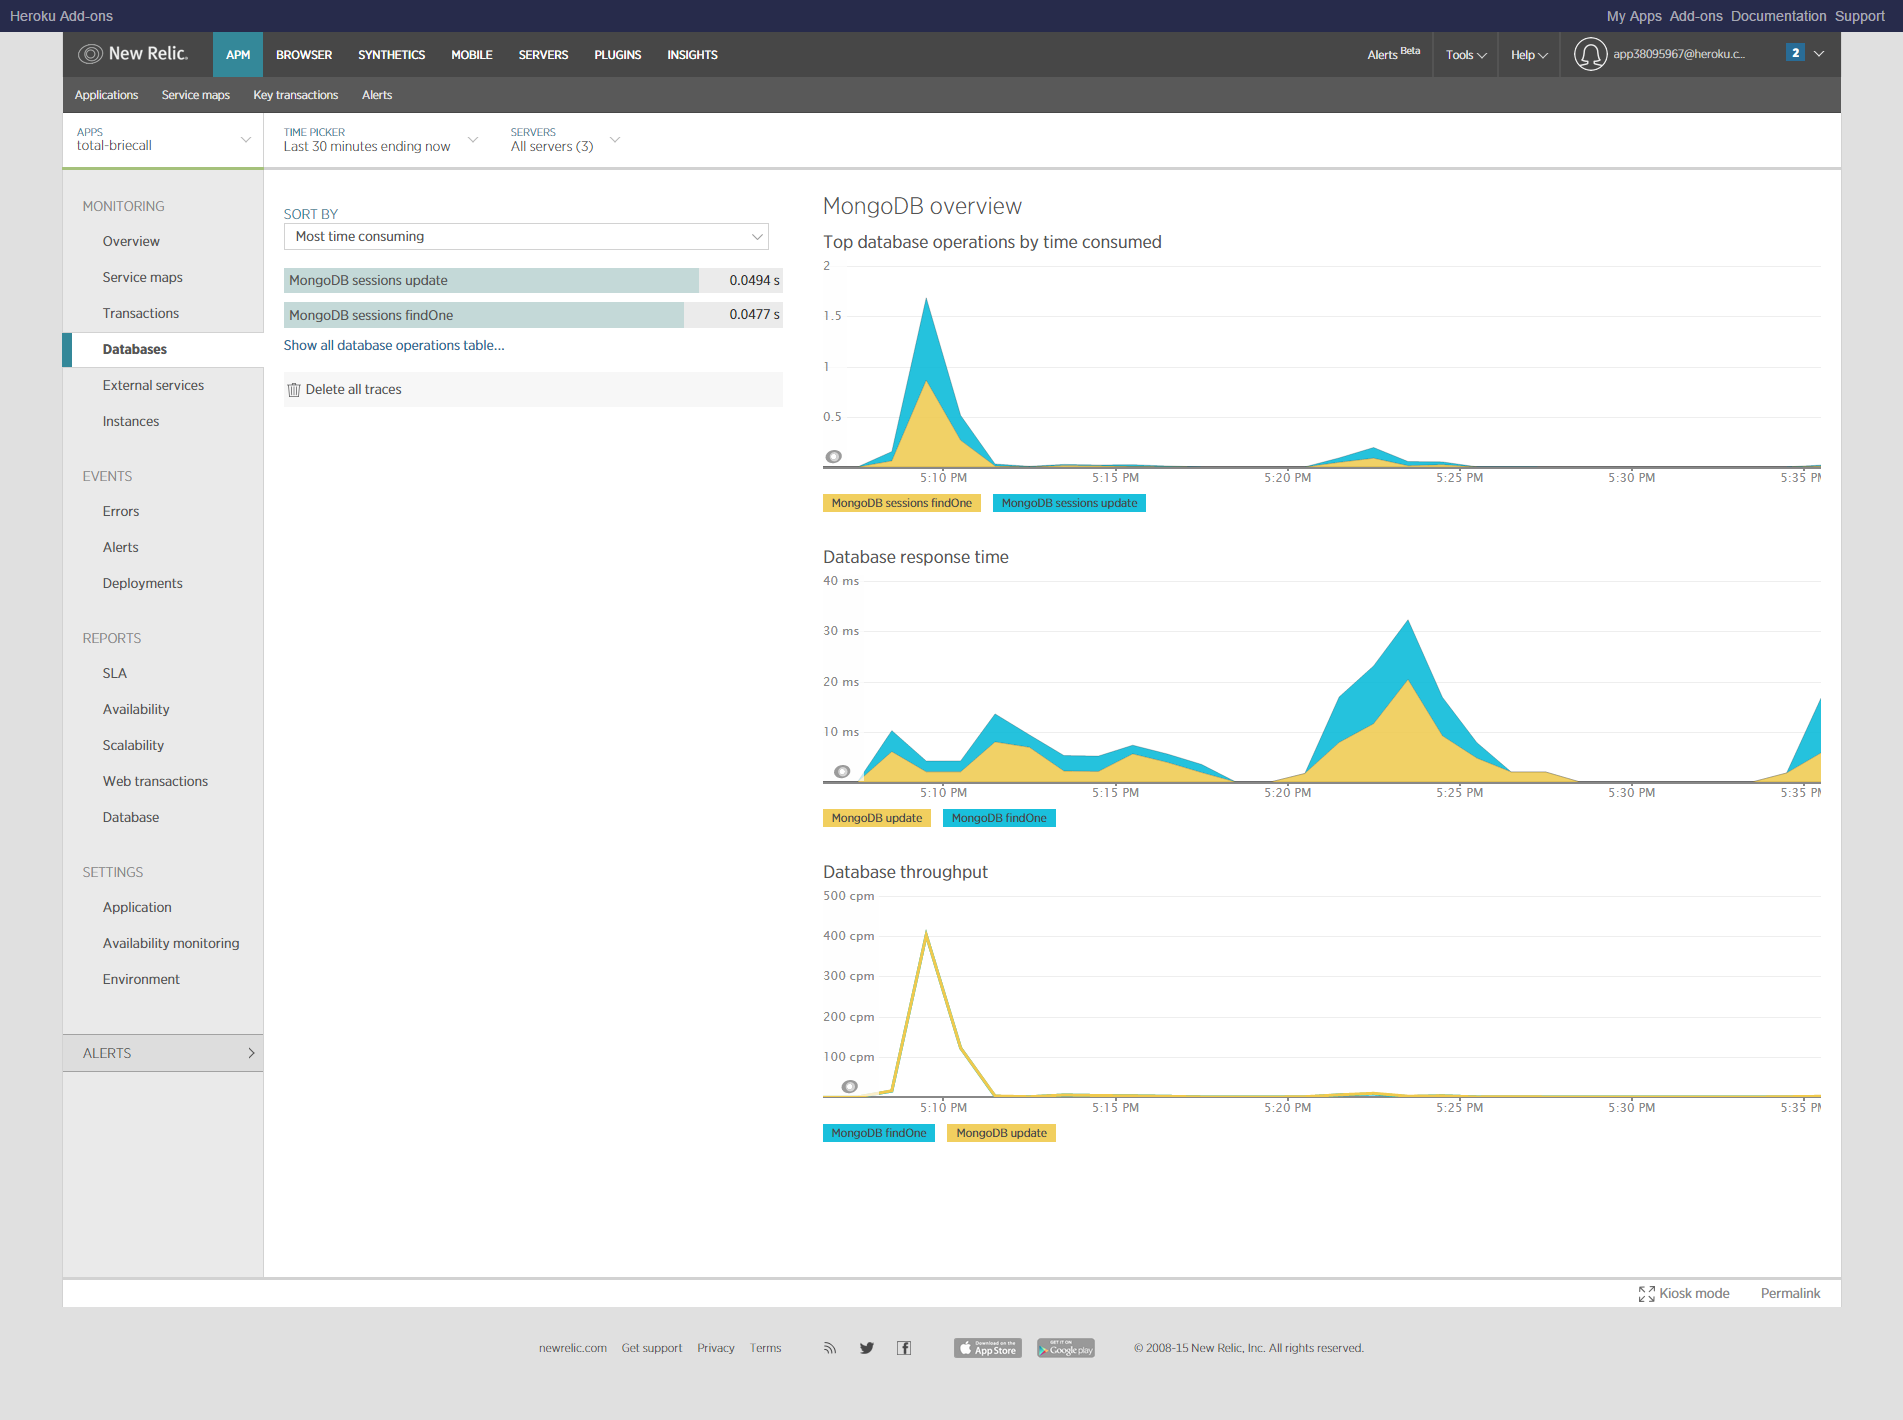
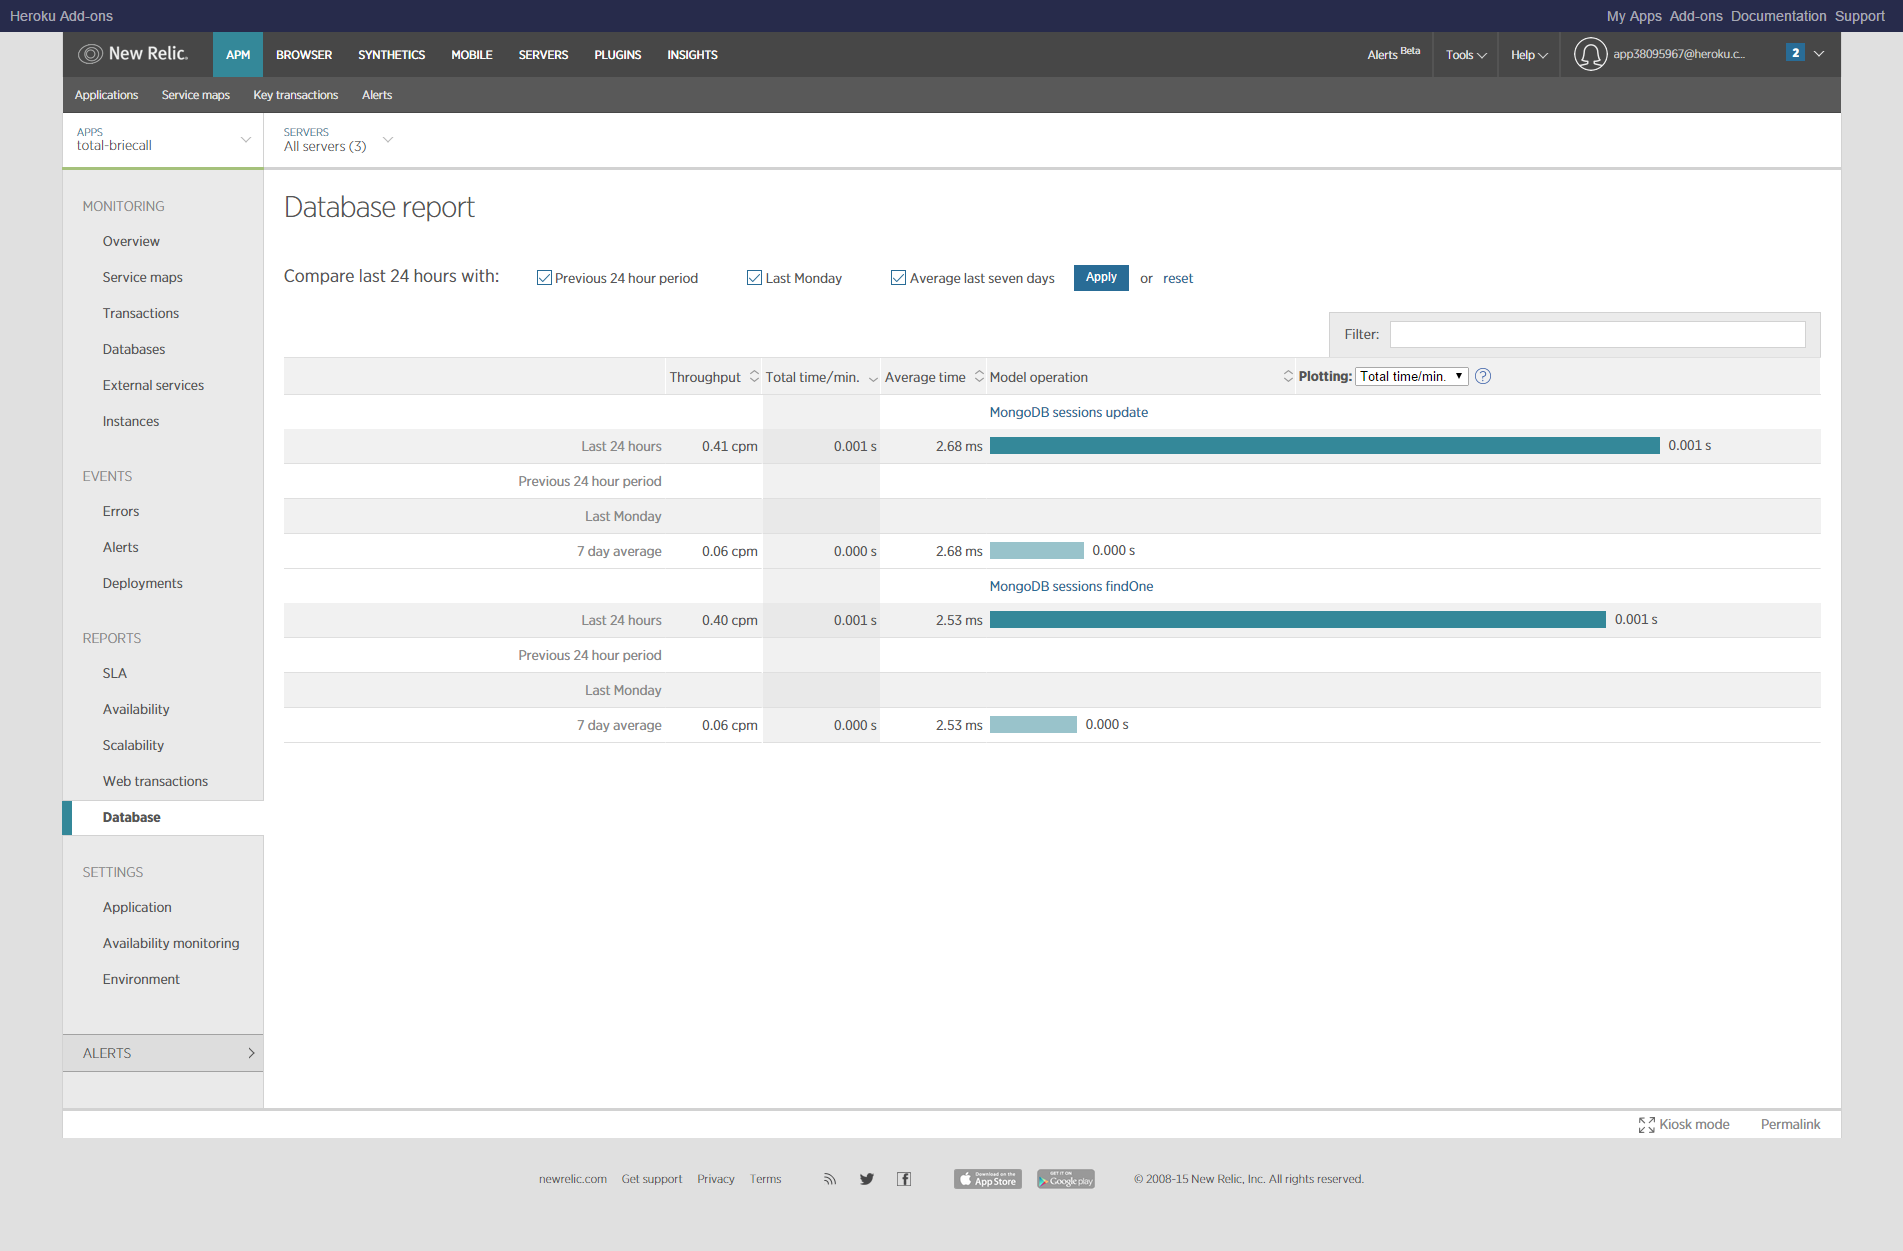
Datastore Performance
These reports provide real-time and historical views of DB performance.
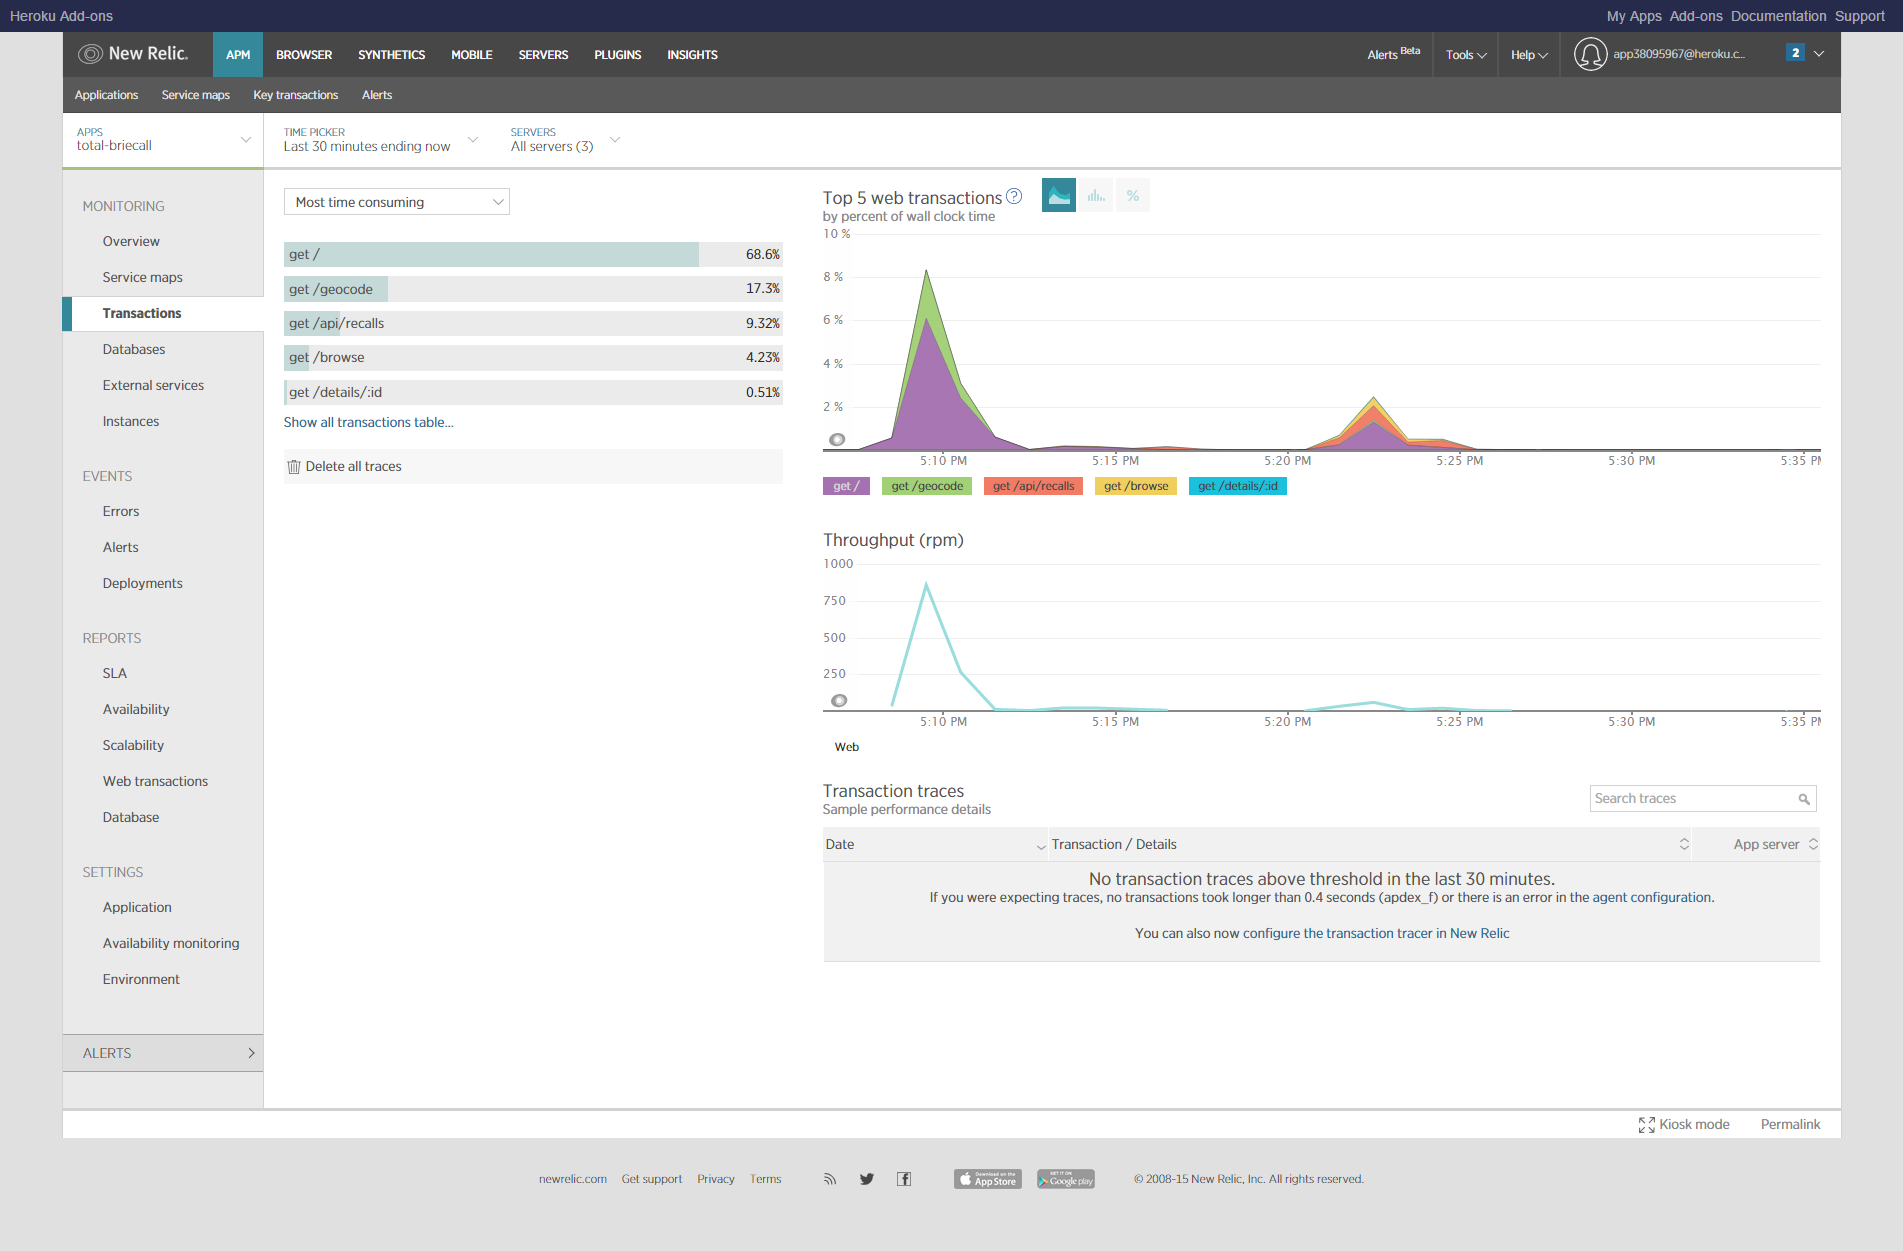
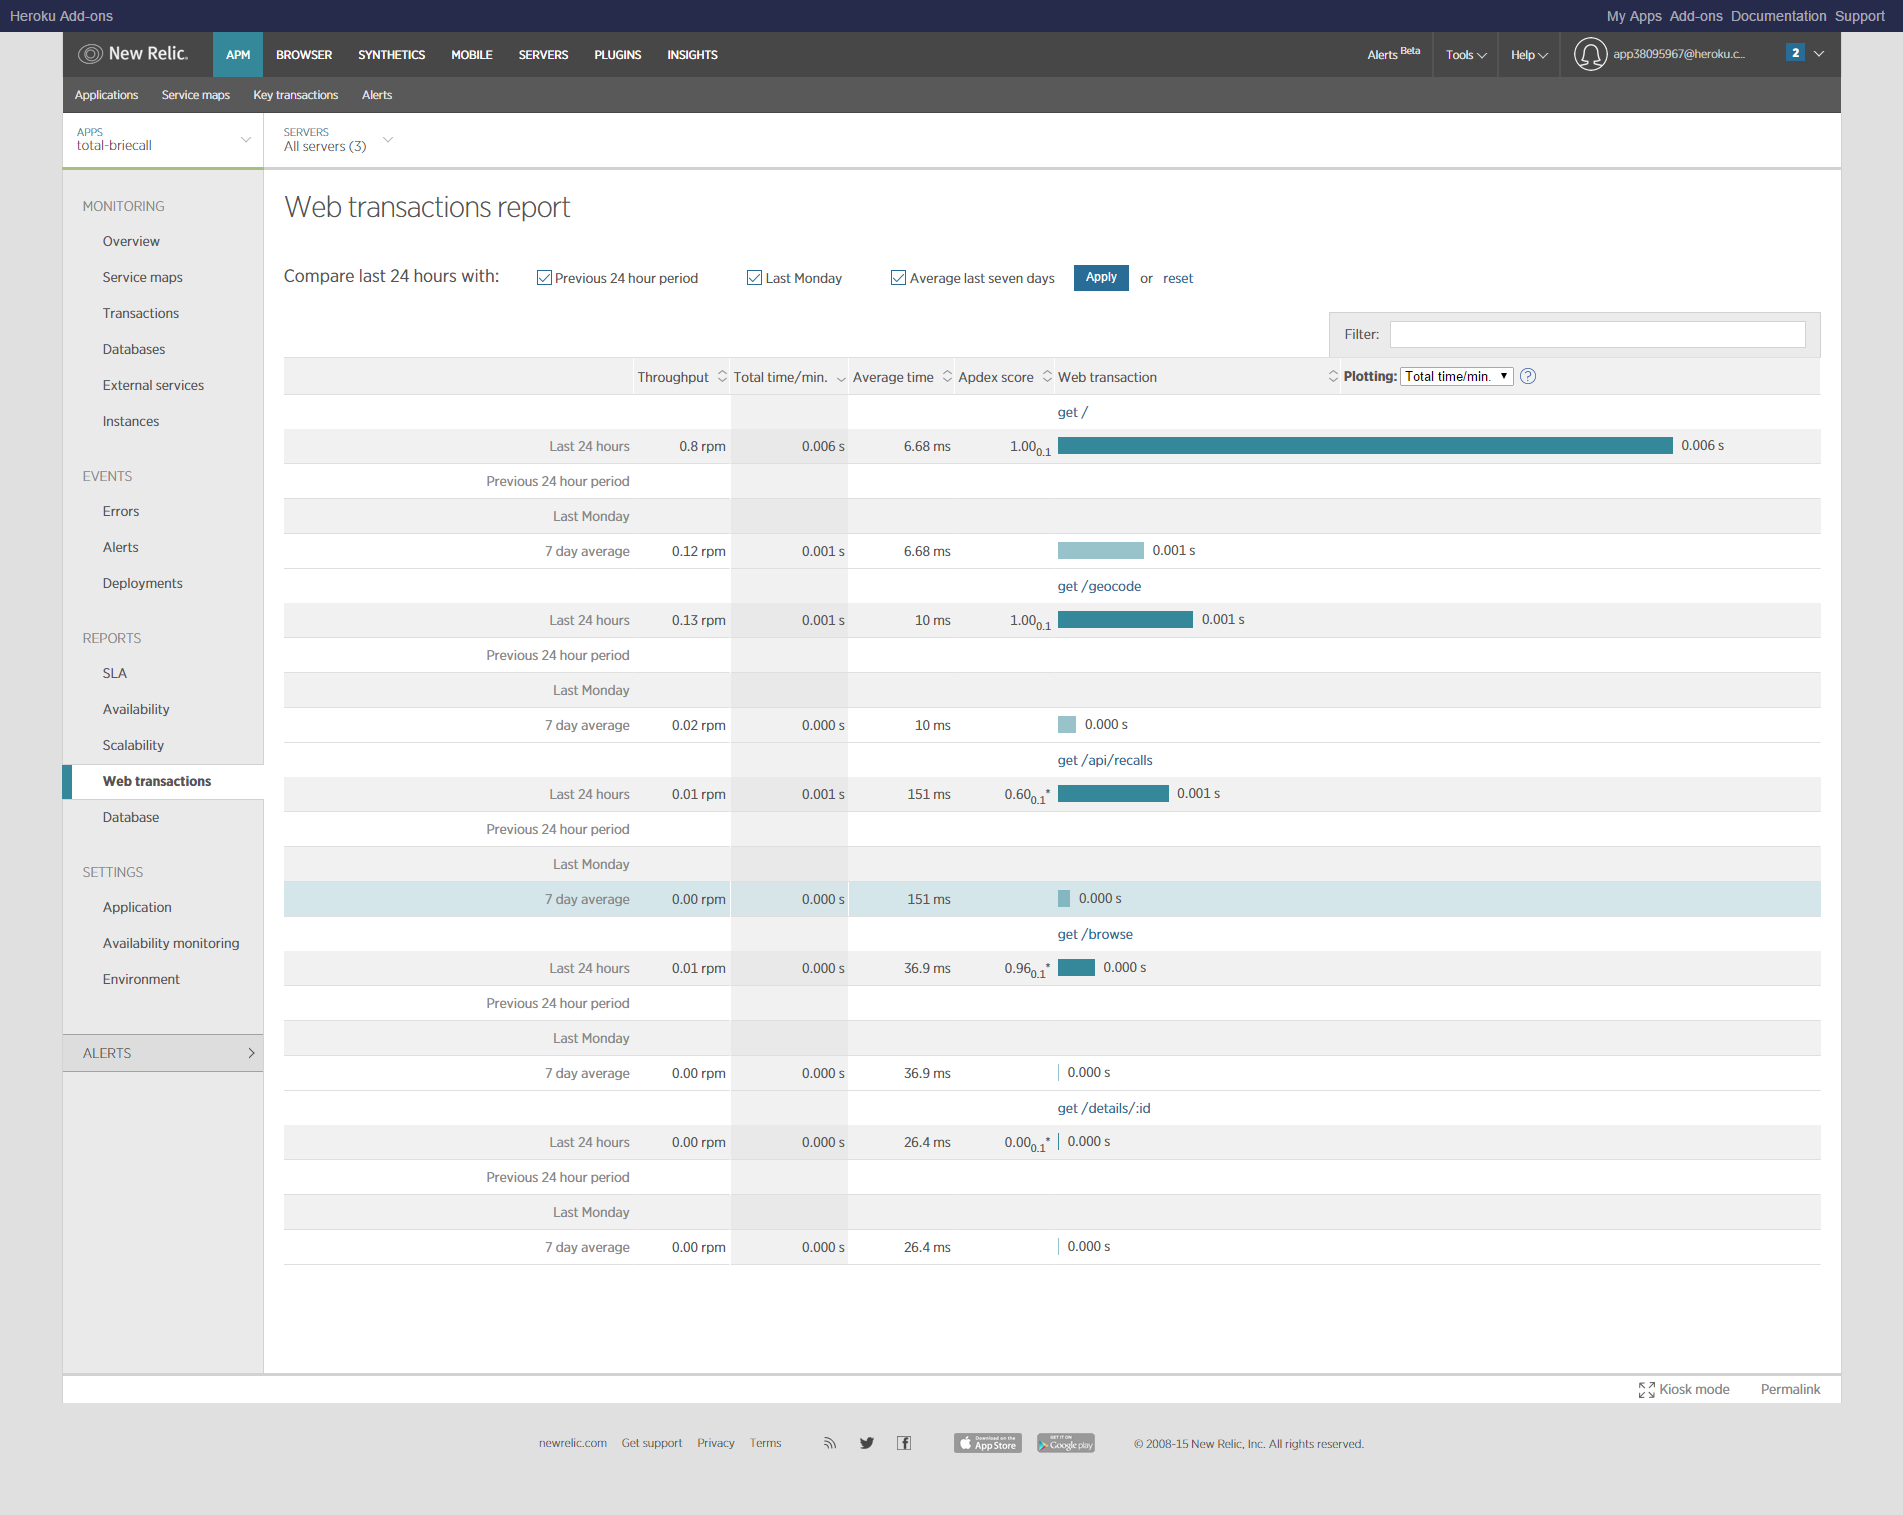
Web Performance
These reports provide information about real-time and historical web transactions, which help our teams determine the overall performance of our system and can identify slow resources.
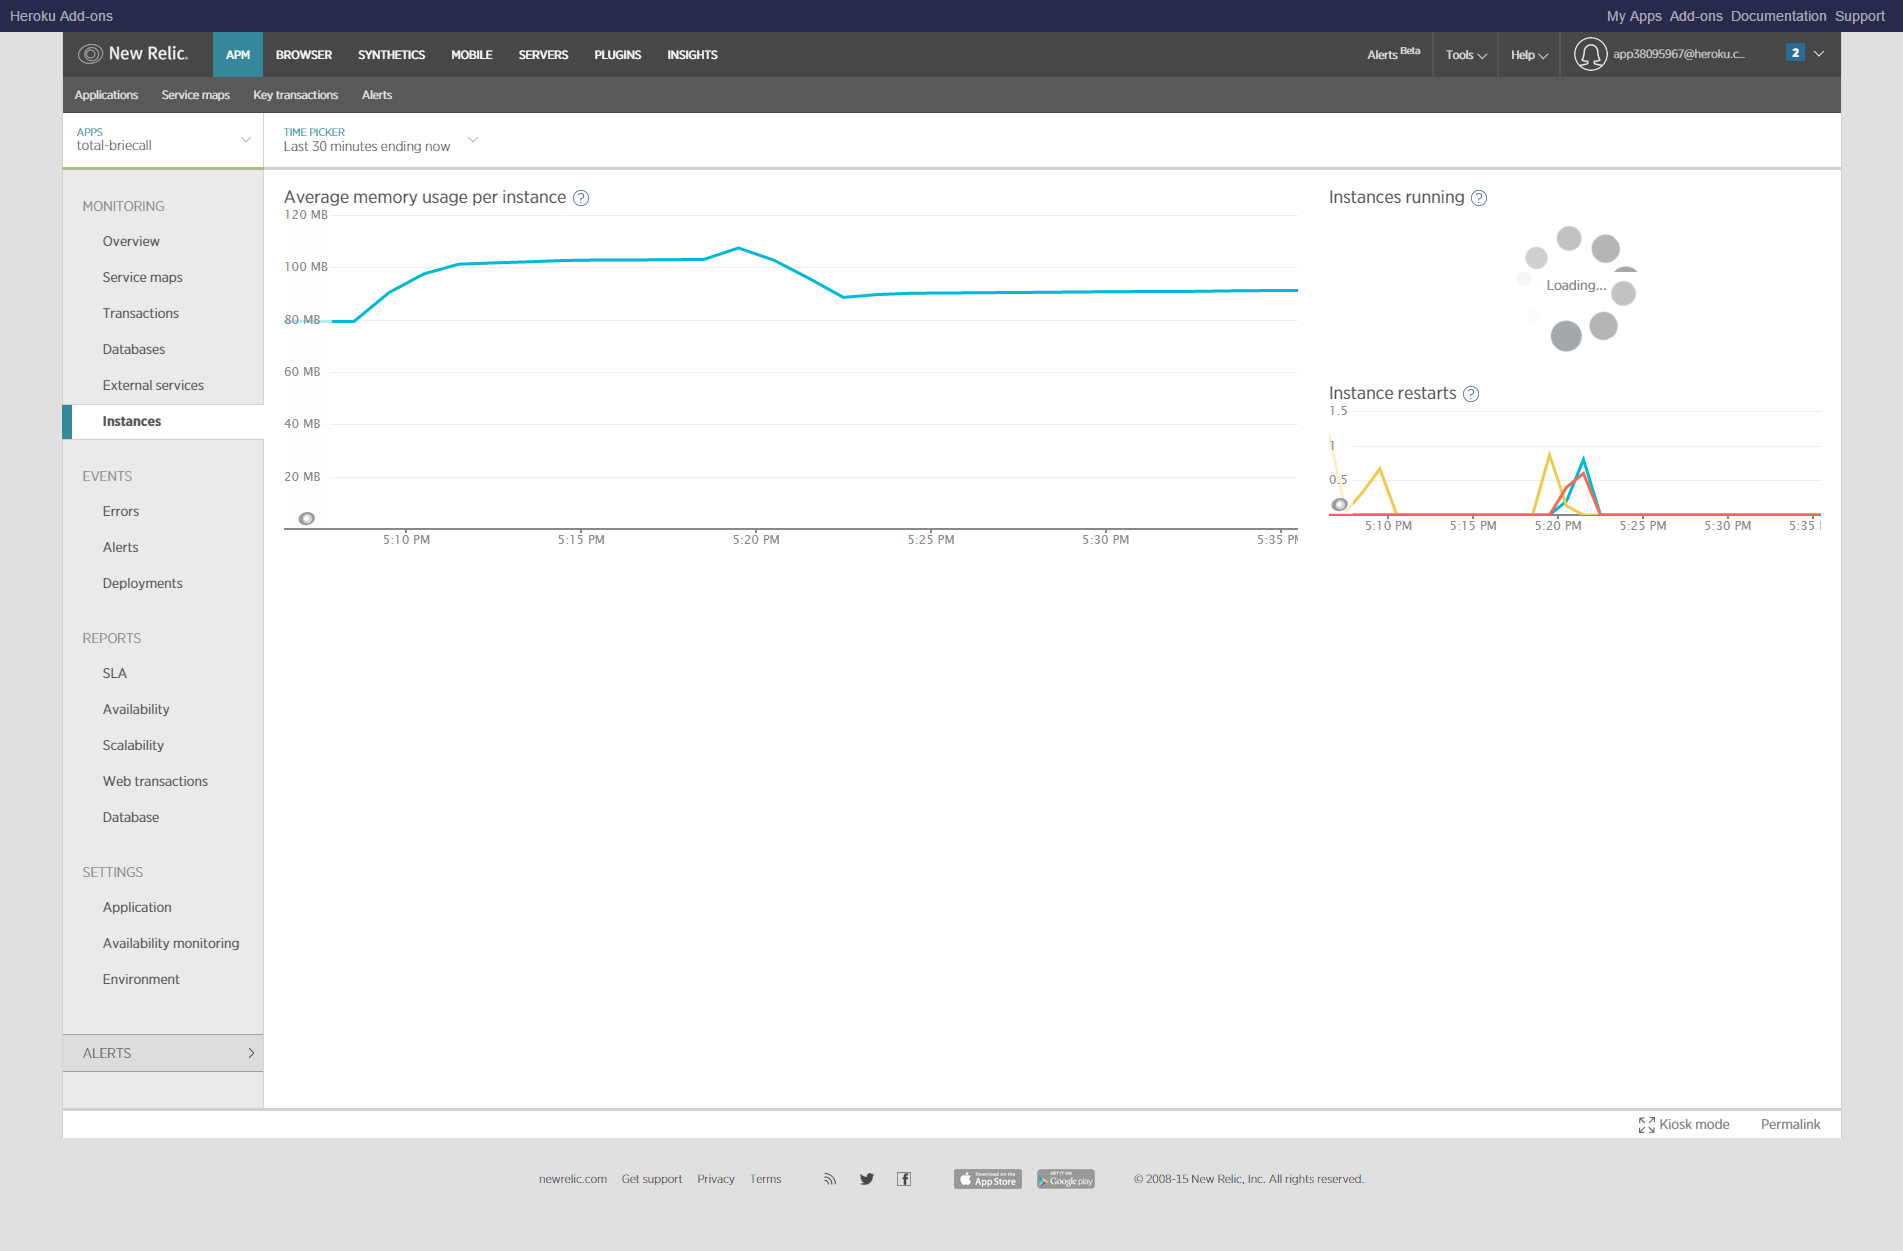
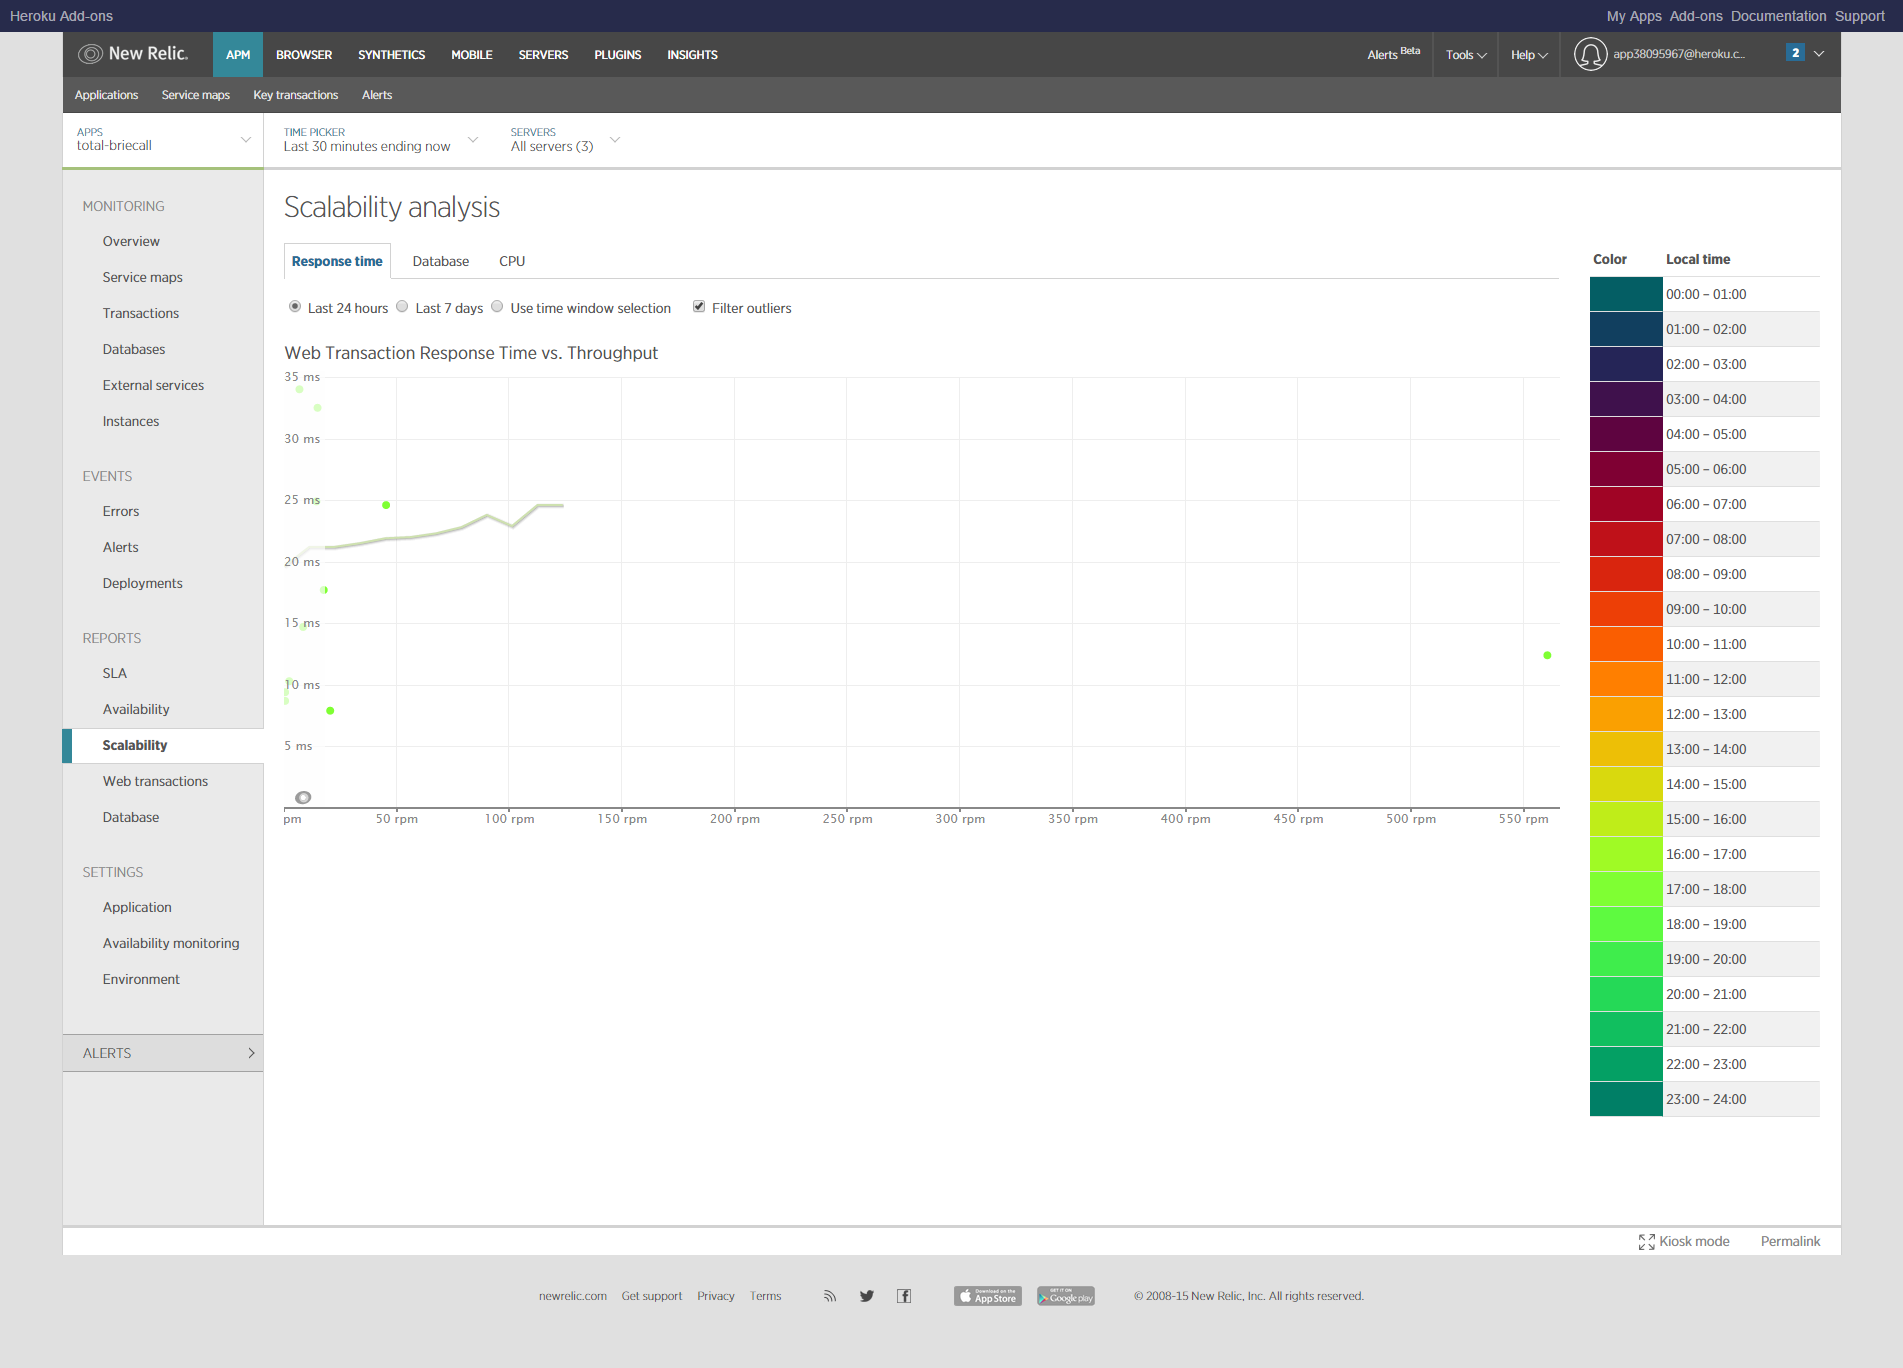
System Performance and Scalability
We also have access to instance metrics and scalability reports, showing us how each instance is running, instance resource consumption, how well the system as a whole is scaling, and what pieces might need additional resources spun up.
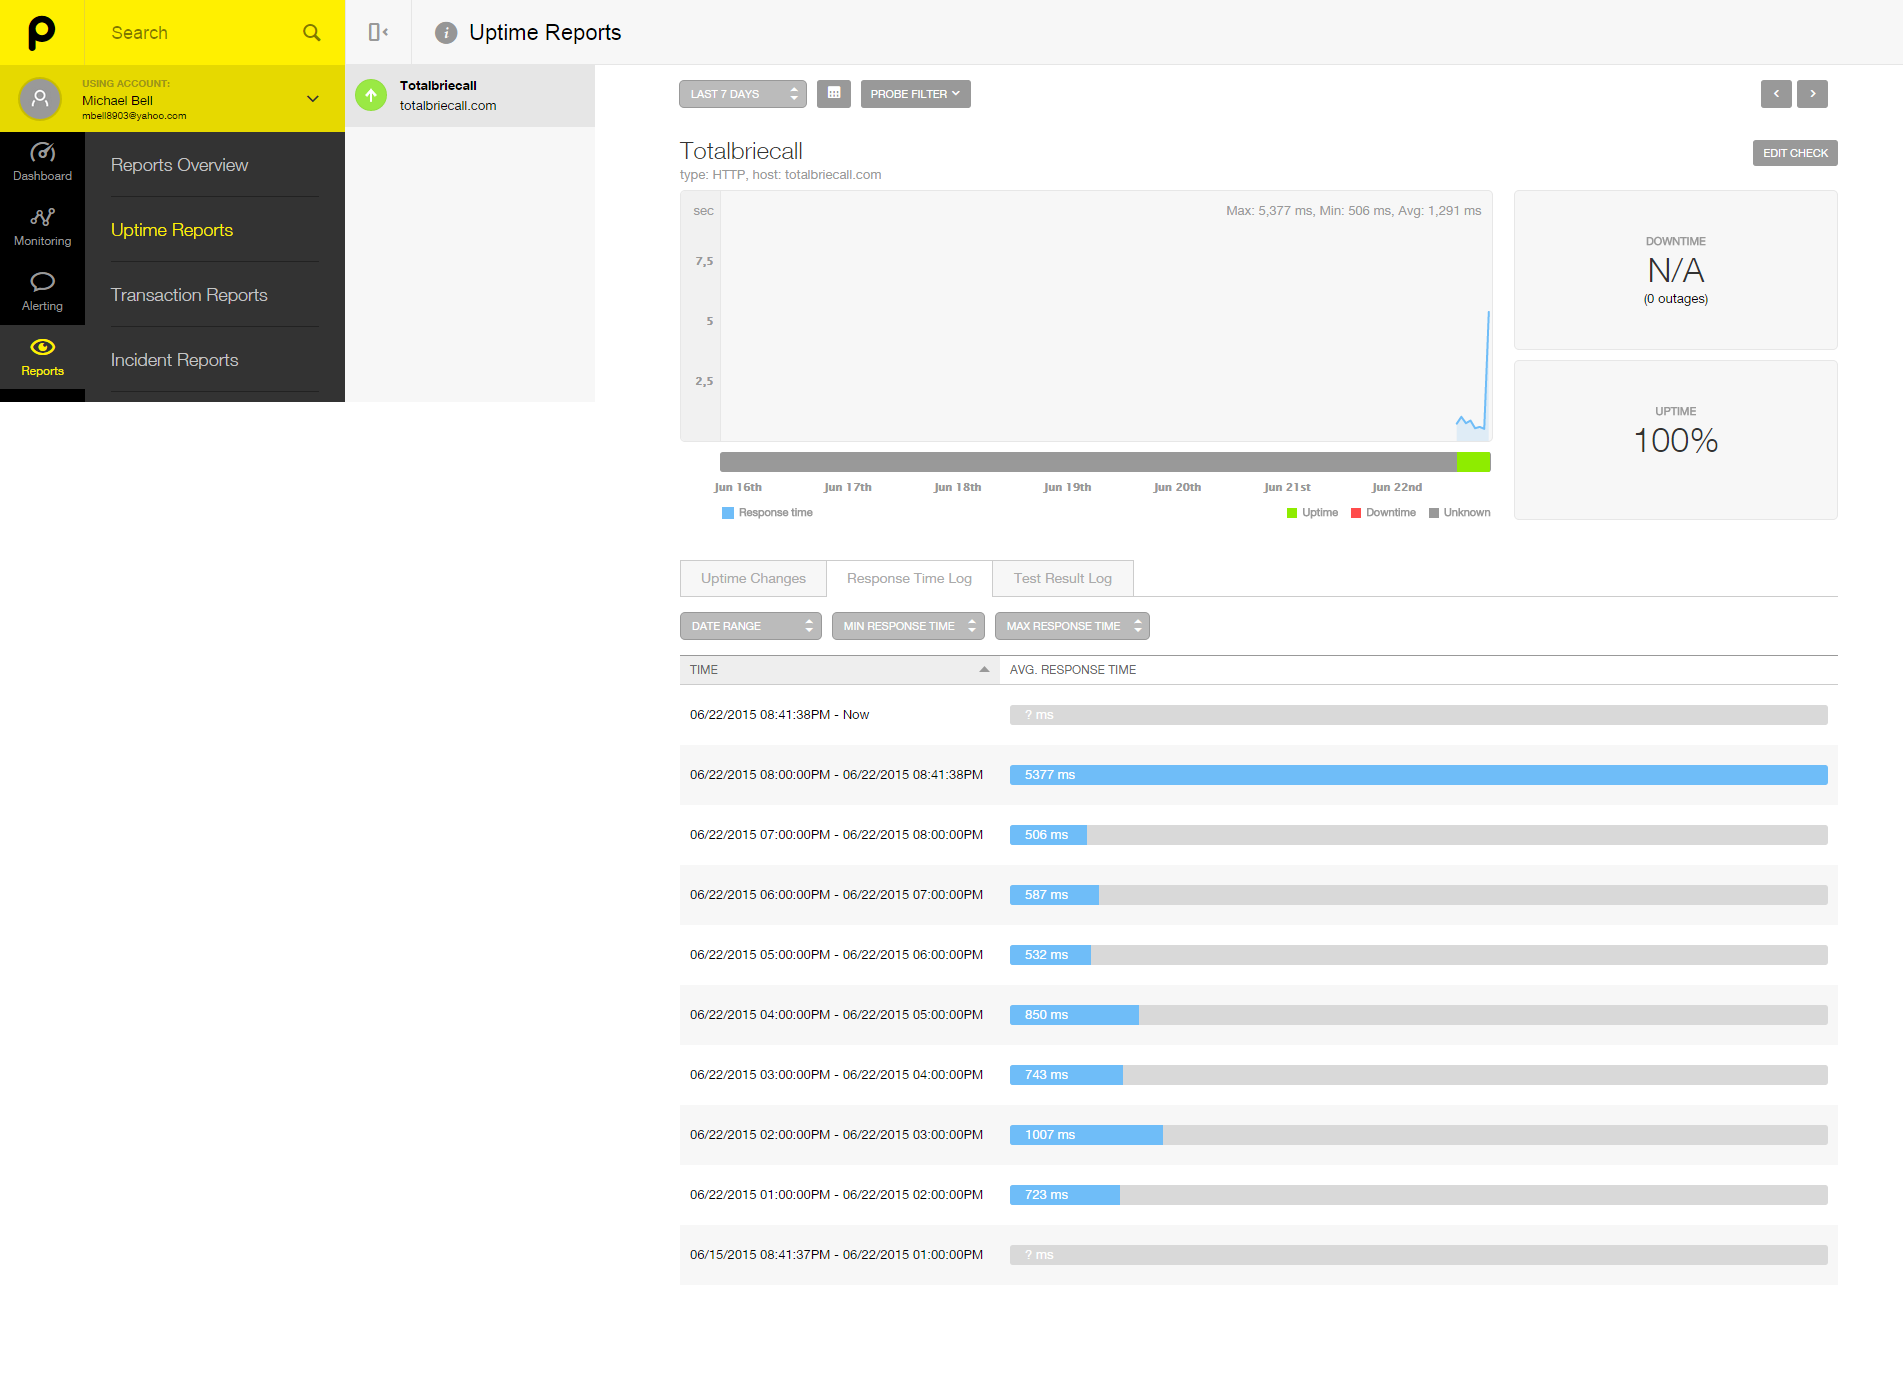
Pingdom
All of these metrics are more fine grained detail about the internals of our application, but we also monitor major outages as well. We use Pingdom to keep track of site availability. Sometimes even the service providers have issues, but we can stay ahead of the curve because Pingdom provides notifications to our operations teams, in the form of emails, SMS and more, allowing us to quickly respond to major network outages, server restarts/crashes, and more.
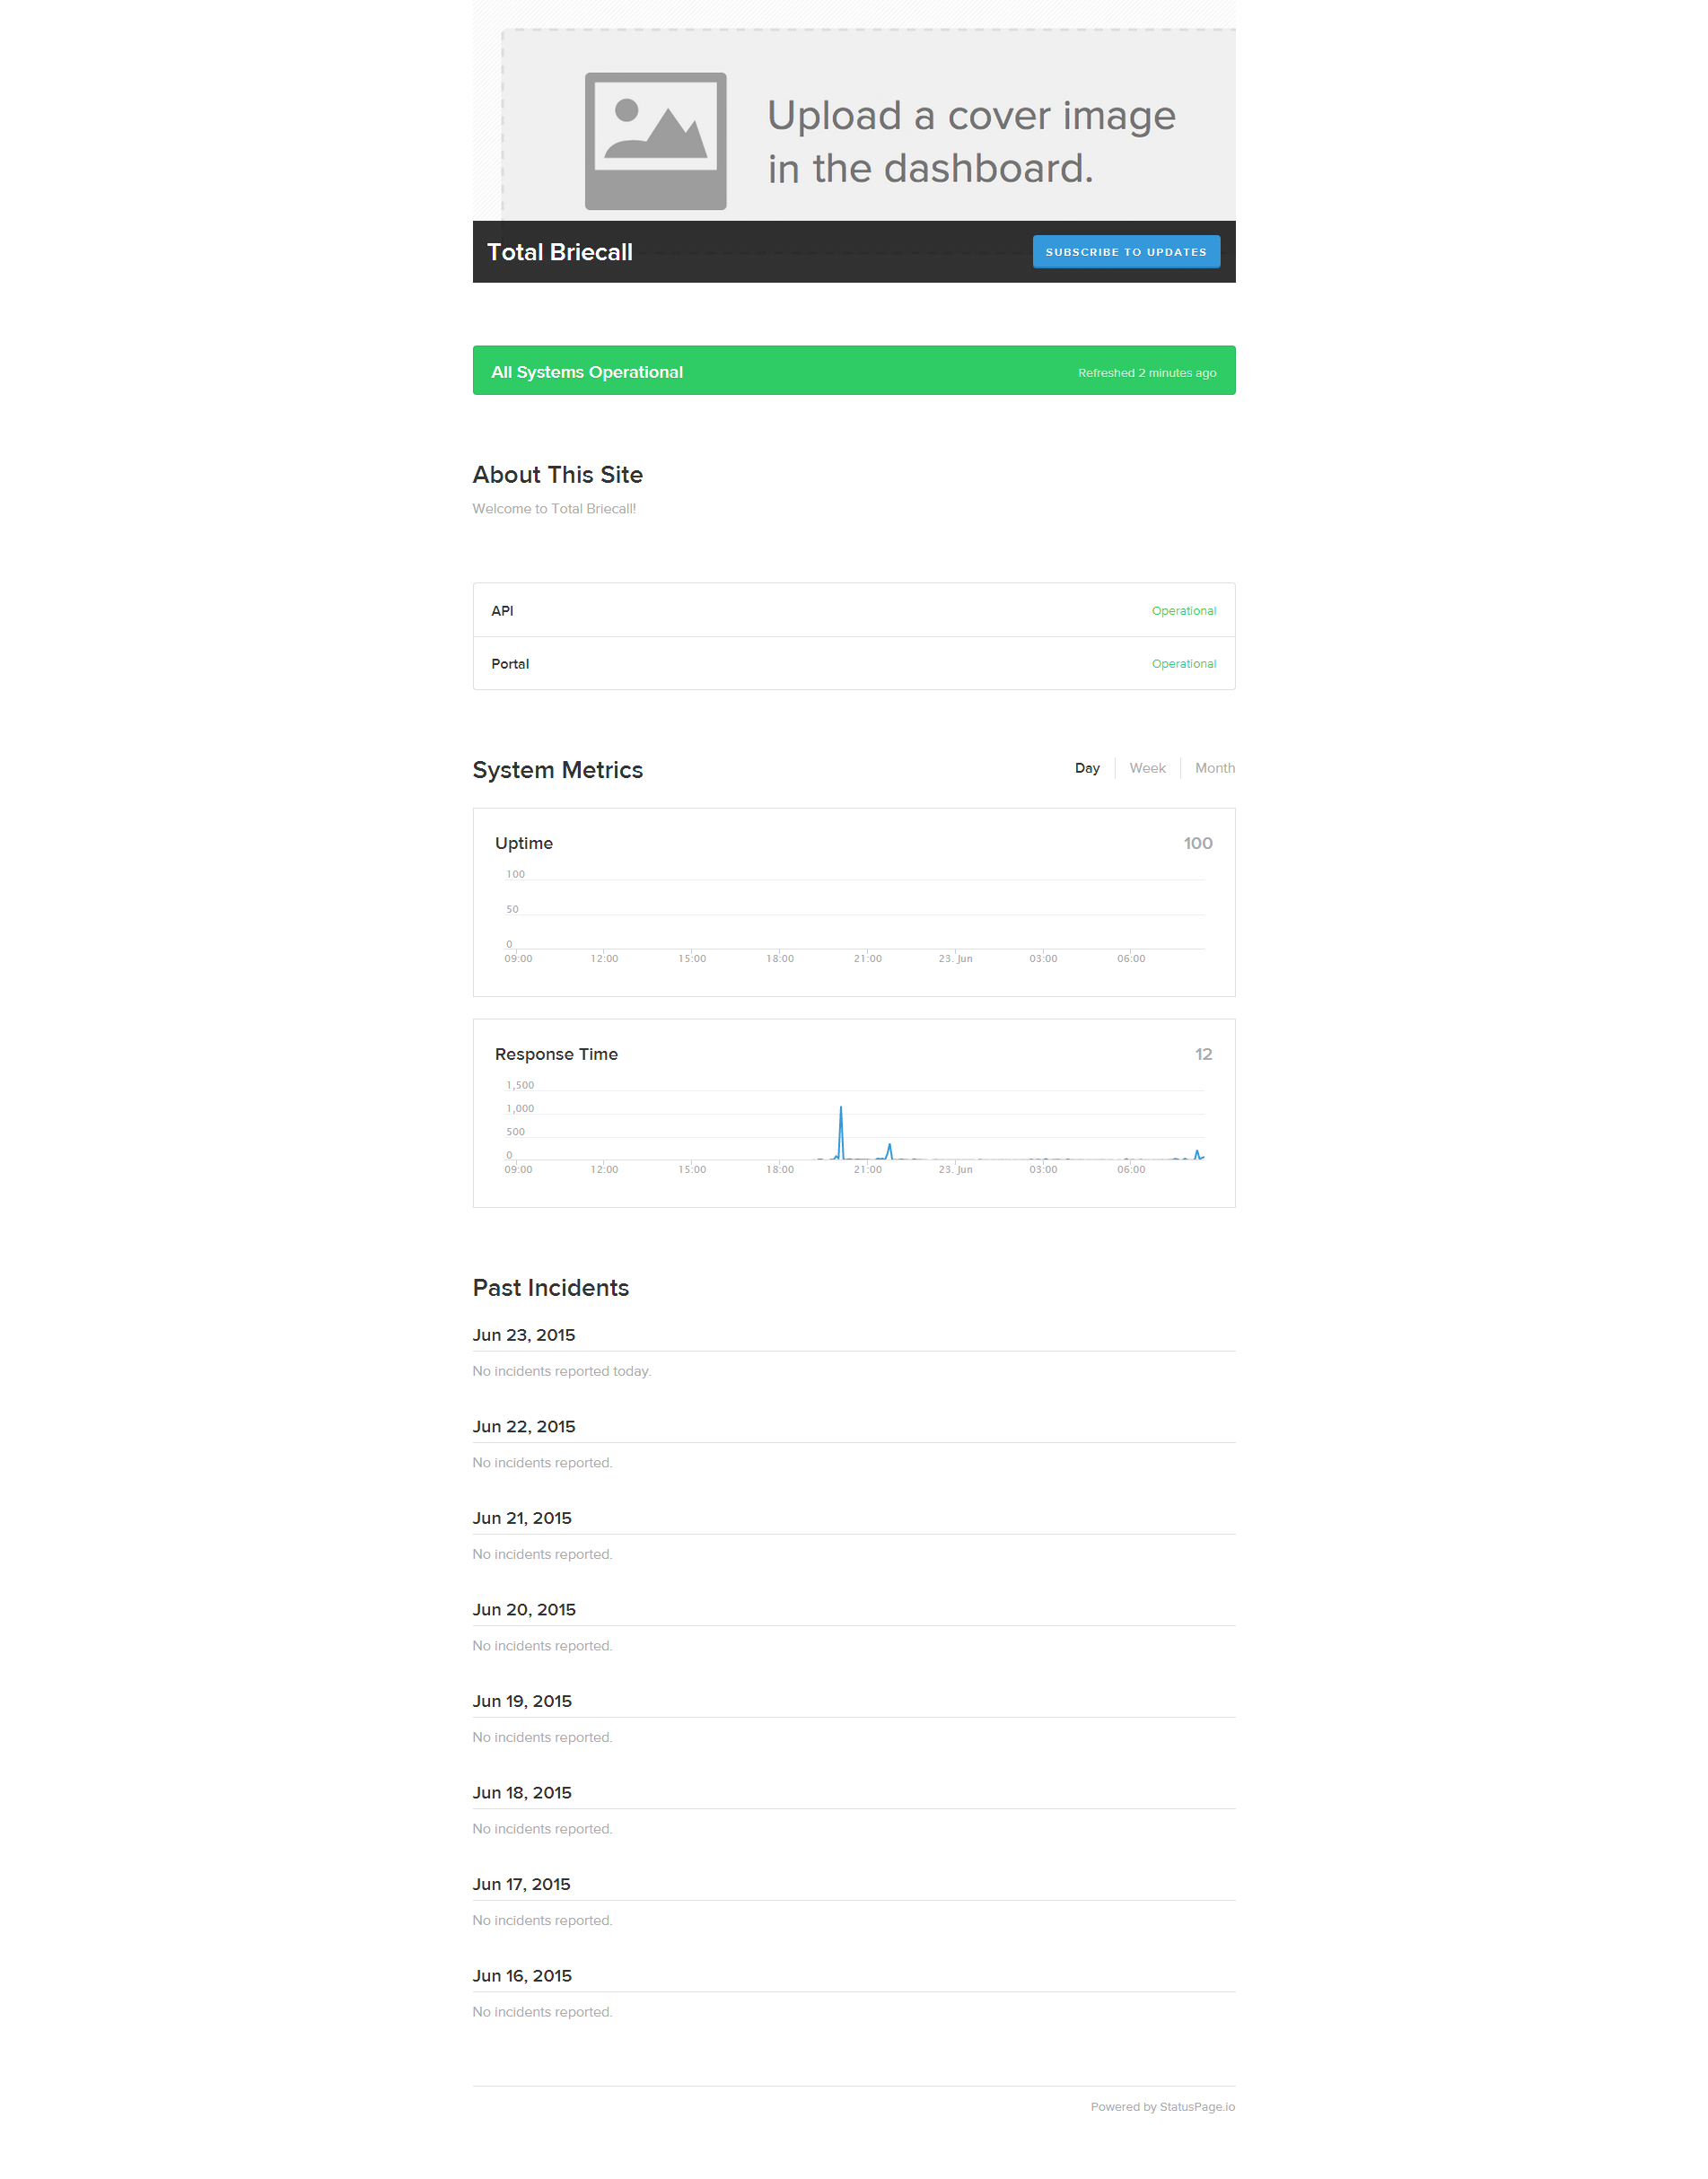
StatusPage.io
All of these are internal tools which allow our operations teams to quickly respond to issues occurring within our site, however the user is ultimately affected by all of this, and based on the type of issue doesn't have any view into the issues, or the status of them. To remedy this we are using StatusPage.io. StatusPage.io is an external source that can provide an error page to our users even when our services are down. We can report incidents to StatusPage.io so that when a user gets the status page, they can see a custom message about the ongoing issue, any status updates, and estimated time to resolve the issue. StatusPage.io integrates with both Pingdom and New Relic, so we can provide custom reports on our status page which gives user's a small view into some of the performance our system is maintaining. This service also allows users to subscribe to issue updates so they will be notified as soon as services are restored and issues are resolved.
Our status page can be found here.
All of these utilities come together to ensure that our teams have a detailed view into our systems and continually monitor our services to provide the best user experience possible.