Practical Section 2: Aligment to the reference Genome - TarifenoLab/Hands-on-RNA-seq-Data-Analysis GitHub Wiki
In the RNA-seq analysis, it is fundamental to identify the origin of every sequence. To enlighten this question, we will perform the Alignment of our reads to the zebrafish reference genome.
An important characteristic of the eukaryotic transcripts is that most of them are spliced, for that reason, during the alignment to the genome we have to consider that some of our reads will span introns. Due to this condition, we will classify reads in two categories:
- Reads aligning mature exons - Those ones align perfectly to the reference genome (called non-spliced reads).
- Reads spanning splicing junctions - Those ones will align with "gaps" to the reference genome (called spliced reads).
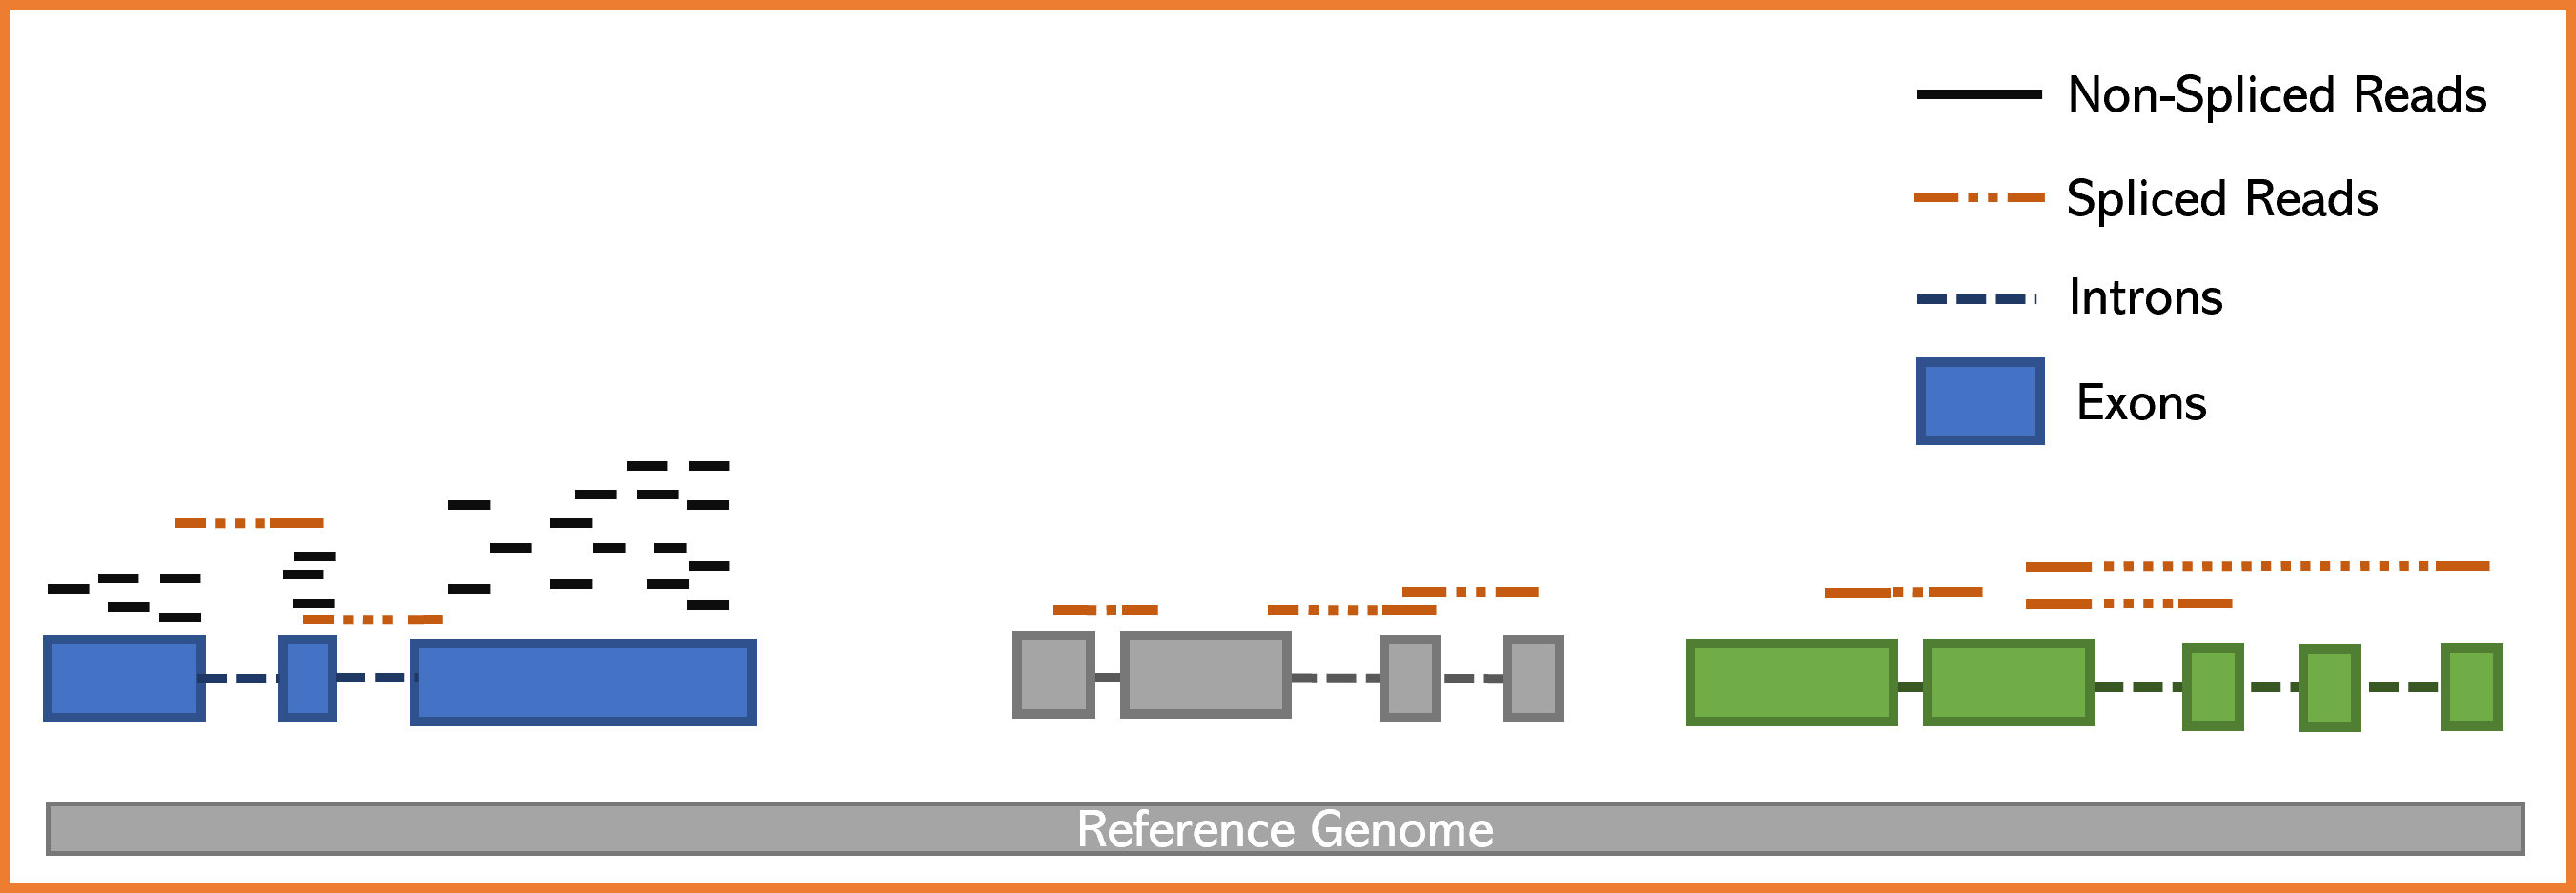
Programs that perform read spliced alignments (called spliced mappers/aligners) have been developed in order to efficiently map to reference genome reads derivating from matures mRNAs. In this activity, we will use the program HISAT2 which is a spliced mapper known for its precision and speed.
I strongly recommend that you visit the page and review the manual of HISAT2 to understand how this program works. Click here to get into the website.
- Look on the Tools menu (left side of your screen)
- GENOMICS ANALYSIS --> RNS-Seq --> HISAT2
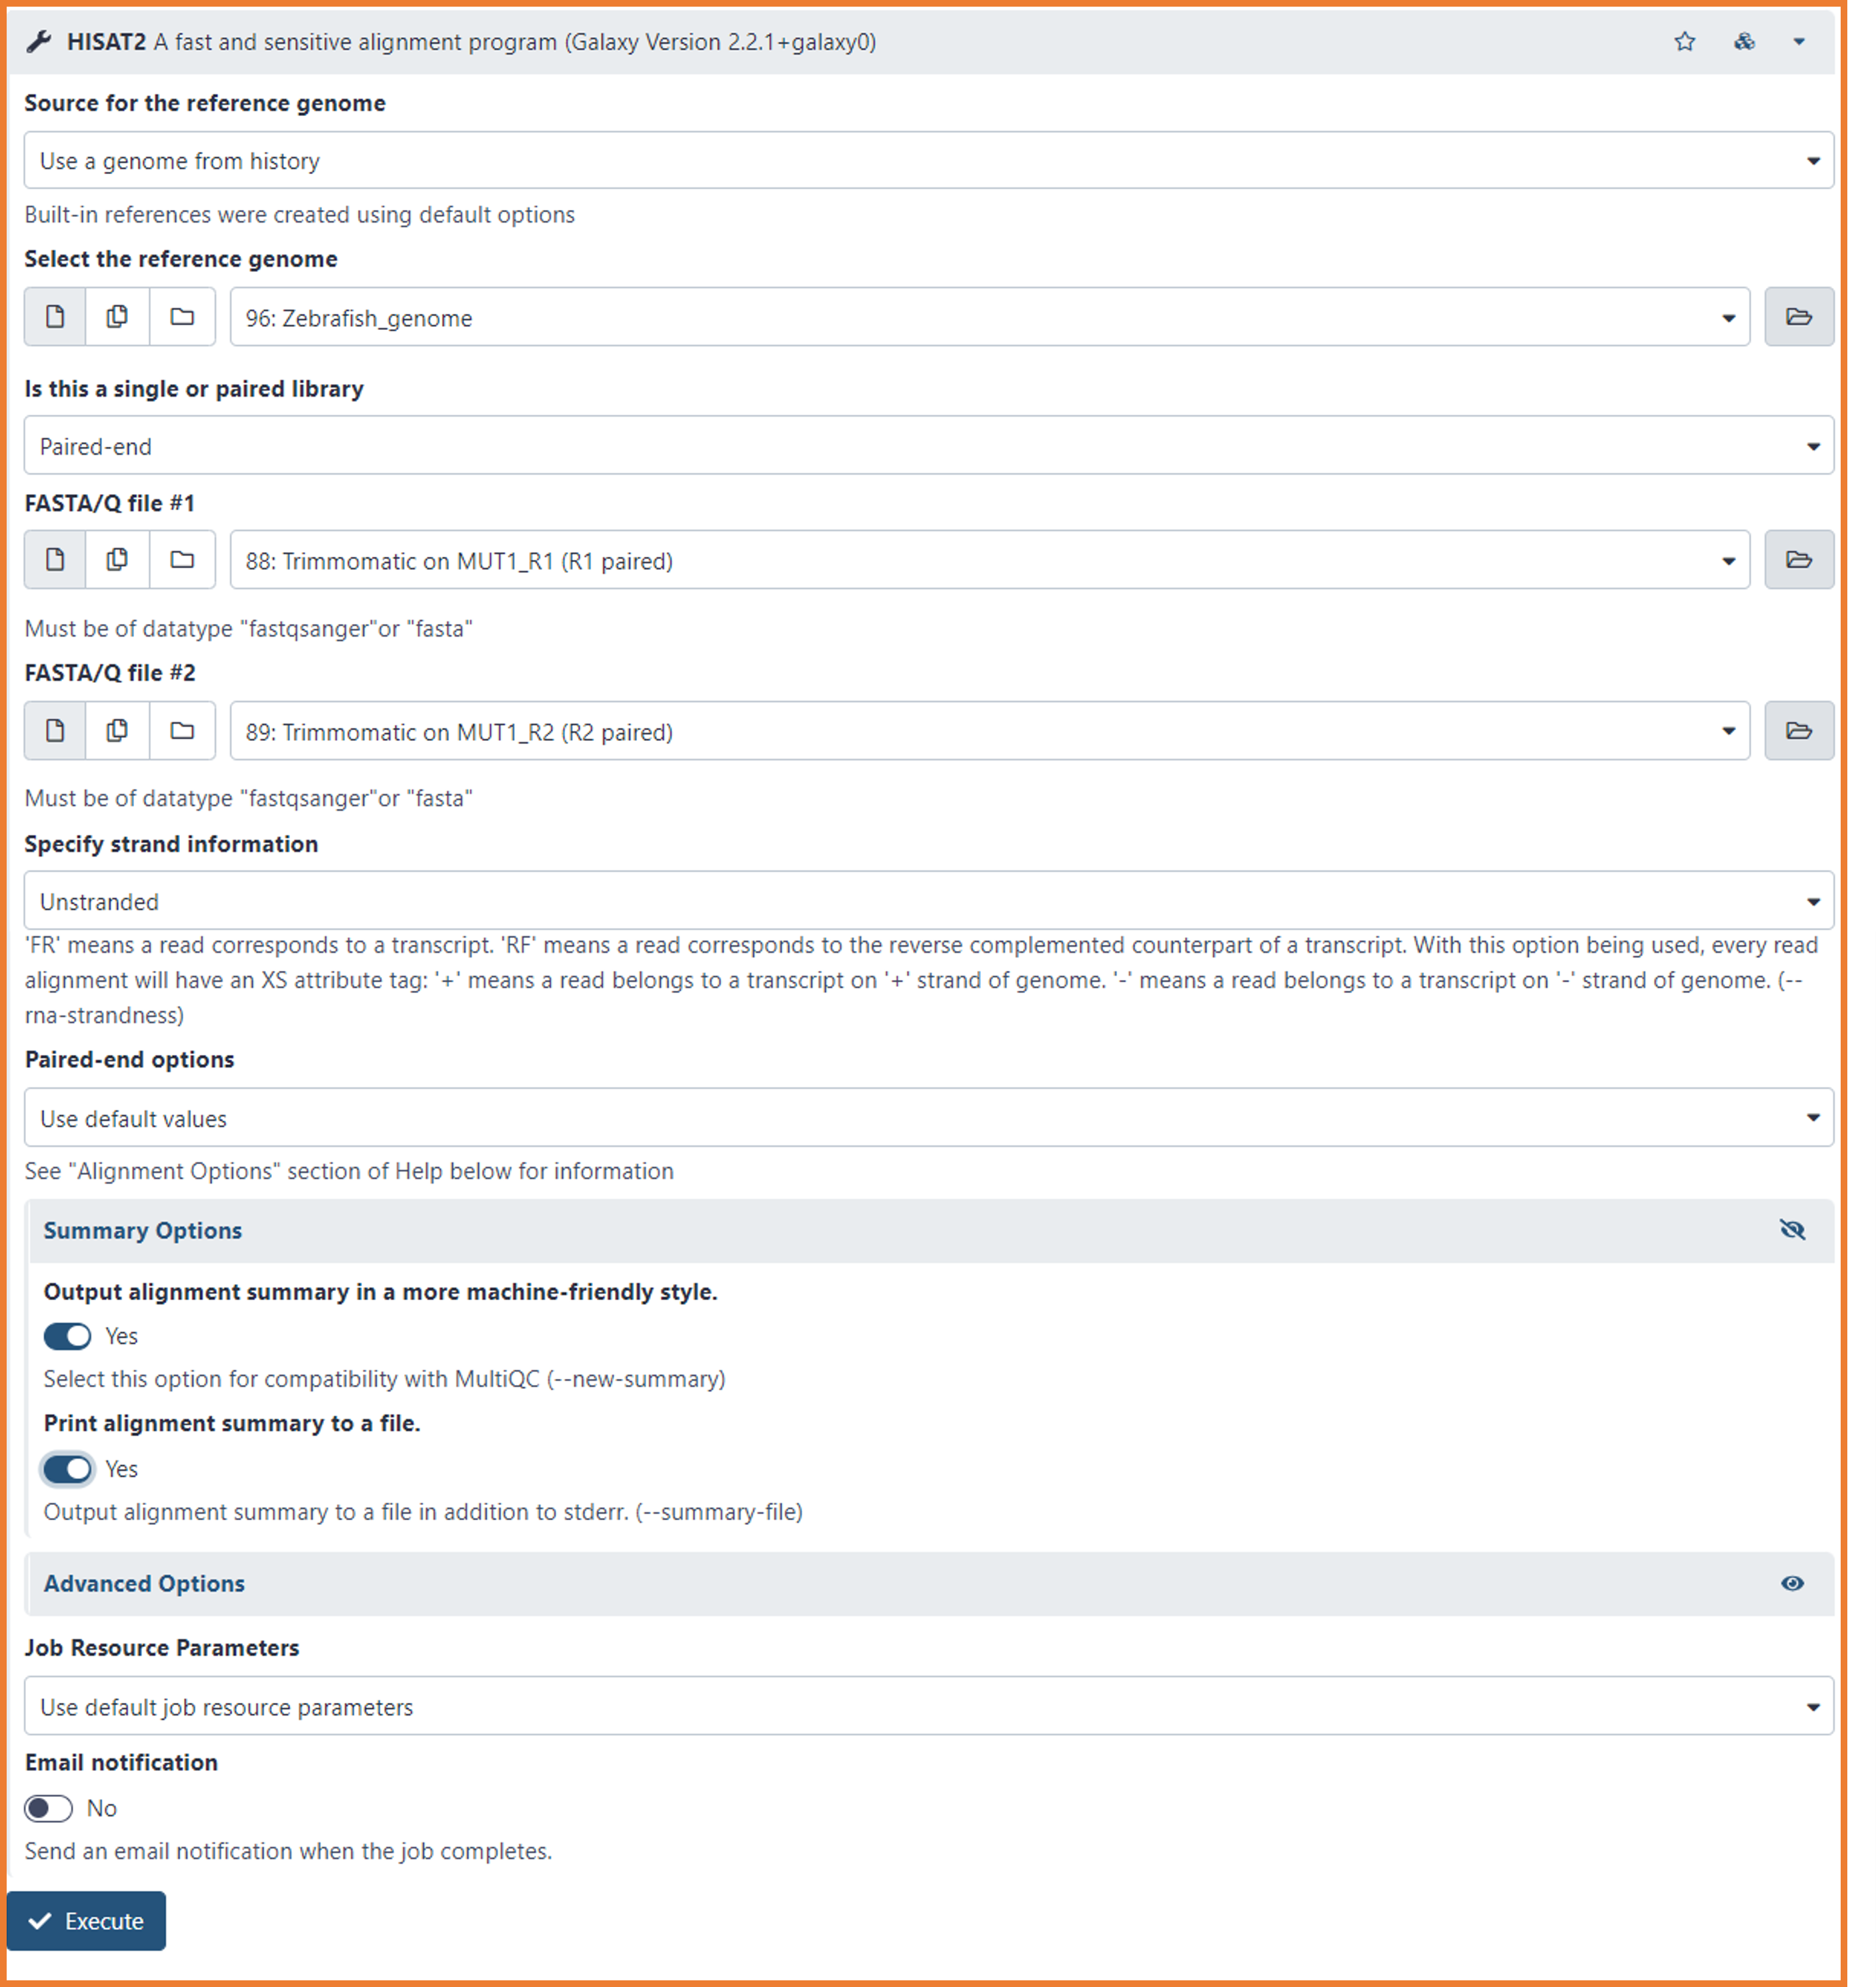
- Select the following options:
- Source for the reference genome
- Use a genome from history (Yes, is in your history...you imported it on Day 1)
- Select the reference genome
- Browse the file "Zebrafish_genome" (It should be automatically selected 🙃🙃)
- Is this a single or paired library
- Paired-end
- FASTA/Q file #1
- Select the pre-processed R1 fastq files (e.i. Trimmomatics on MUT1_R1 (R1 paired)
- FASTA/Q file #2
- Select the pre-processed R1 fastq files (e.i. Trimmomatics on MUT1_R2 (R2 paired)
- Specify strand information
- Unstranded
- Paired-end options
- Use default values
- Click the eye icon of Summary Options
- select "yes" to both options
- Source for the reference genome
- Click on Execute
We will get 2 output files, one file with the mapped reads in BAM format and one file summarizing the mapping results.
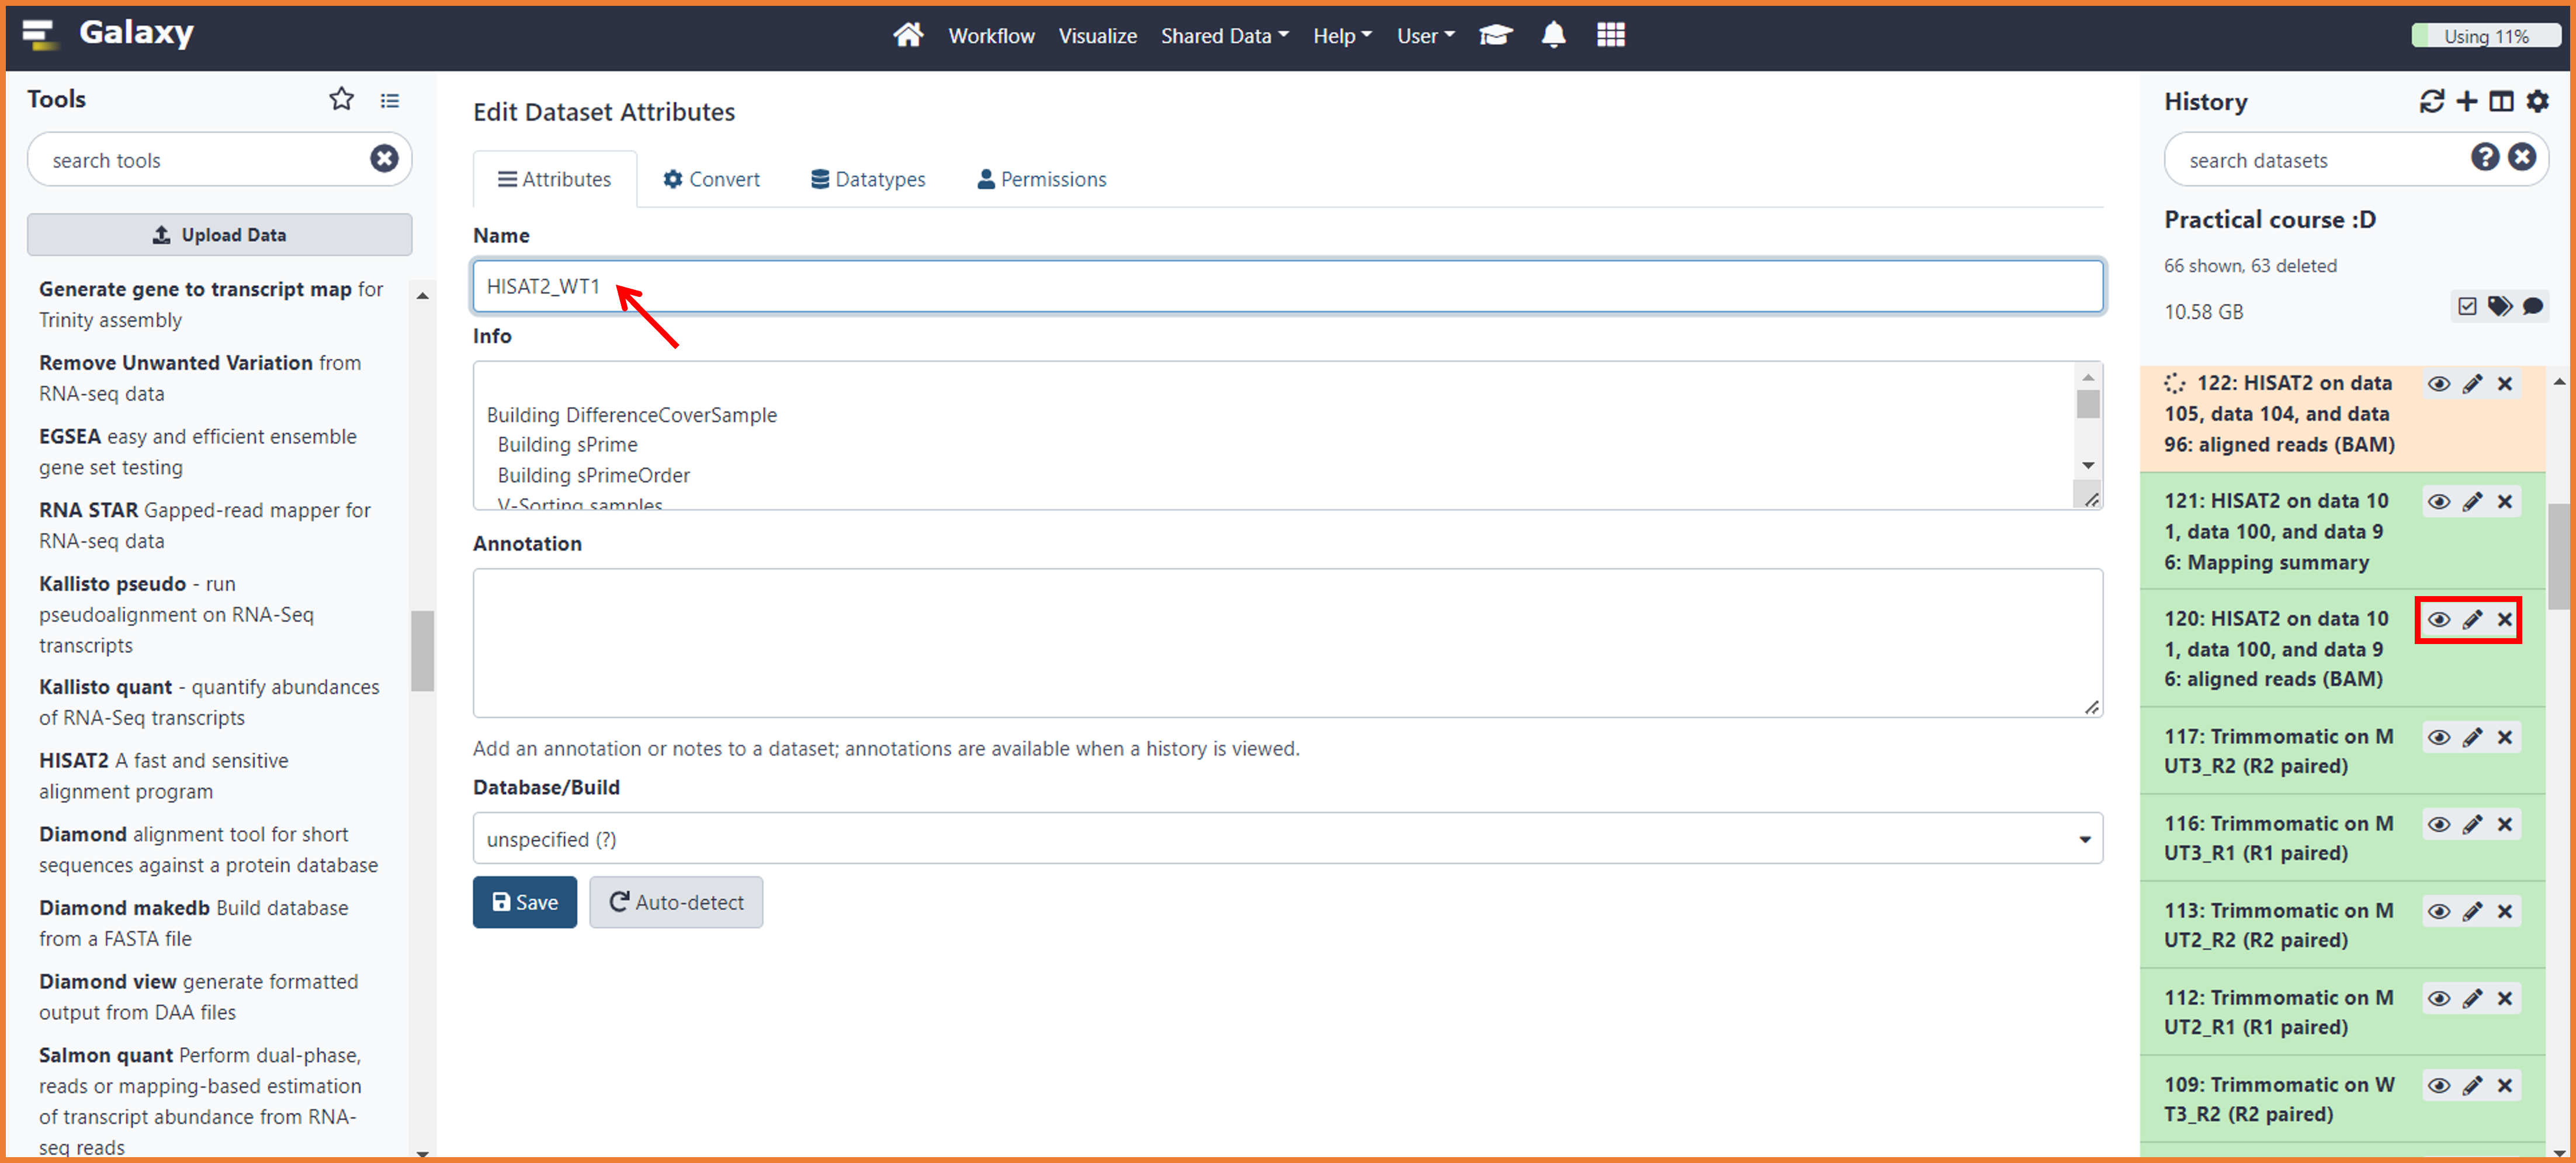
At this point, your history will get a little bit messy because the output names are not really "friendly" ... like this one --> "HISAT2 on data 89, data 88, and data 96: aligned reads (BAM)" 😏😏
To organize your output and avoid to do mistakes in further analysis, we will modify the name of our mapping files. To do so, follow the instructions below:
- Find on your history the first HISAT2 BAM file ( e.i. HISAT2 on data 101, data 100, and data 96: aligned reads (BAM))
- Make sure you know to which sample corresponds the data number (e.i. the data 101, data 100 correspond to WT1_R1 and WT1_R2)
- Click on the "pencil icon"
- On the first Box "Name" write HISAT2 and the name of the sample (e.i. "HISAT2_WT1")
- Do the same for the summary files
As we did for the pre-processing, we will also do quality control for our mapping. This step is important as will help you to deeply explore your data. Indeed, we will check for features like:
- Any contamination not identified by the Fastq QC
- 3' Bias
- Sequencing depth and is related to transcript discovery (Junction Annotation)
- PCR bias
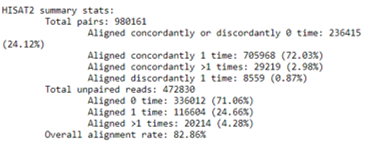
- The mapping summary obtained by HISAT2 will provide information about alignment statistics such as overall alignment rate, the proportion of discordant and concordant pairs, and unique reads. The summary report looks like the one below...Did yours look the same? 👀 ¿What is considered a good % of mapped reads?
- This quality check will explore read coverage over gene body and evaluated if coverage is uniform and if there is any 5' or 3' Bias. It will scaled all transcriptos to 100 nucleotides and calculate how many reads are mapping each nucleotide position. As we discussed in the theoretical section, 3' bias is often present in libraries prepared from degraded RNA.
- To calculate follow the instructions below:
- In the Tools menu (left side) search the program *Body Coverage (BAM)
- GENOMICS TOOLKITS --> RSeQC --> *Body Coverage (BAM)
- Run each sample separately, or combine mutiple samples into one plot
- Combine mutiple samples into one plot
- Input .bam file(s)
- HISAT2_WT1
- HISAT2_WT2
- HISAT2_WT3
- HISAT2_MUT1
- HISAT2_MUT2
- HISAT2_MUT3
- Reference gene model
- Zebrafish_Annotation_bed (imported during Day 1)
- Minimum mRNA length (default: 100)
- In the Tools menu (left side) search the program *Body Coverage (BAM)
- Click in execute to launch the job
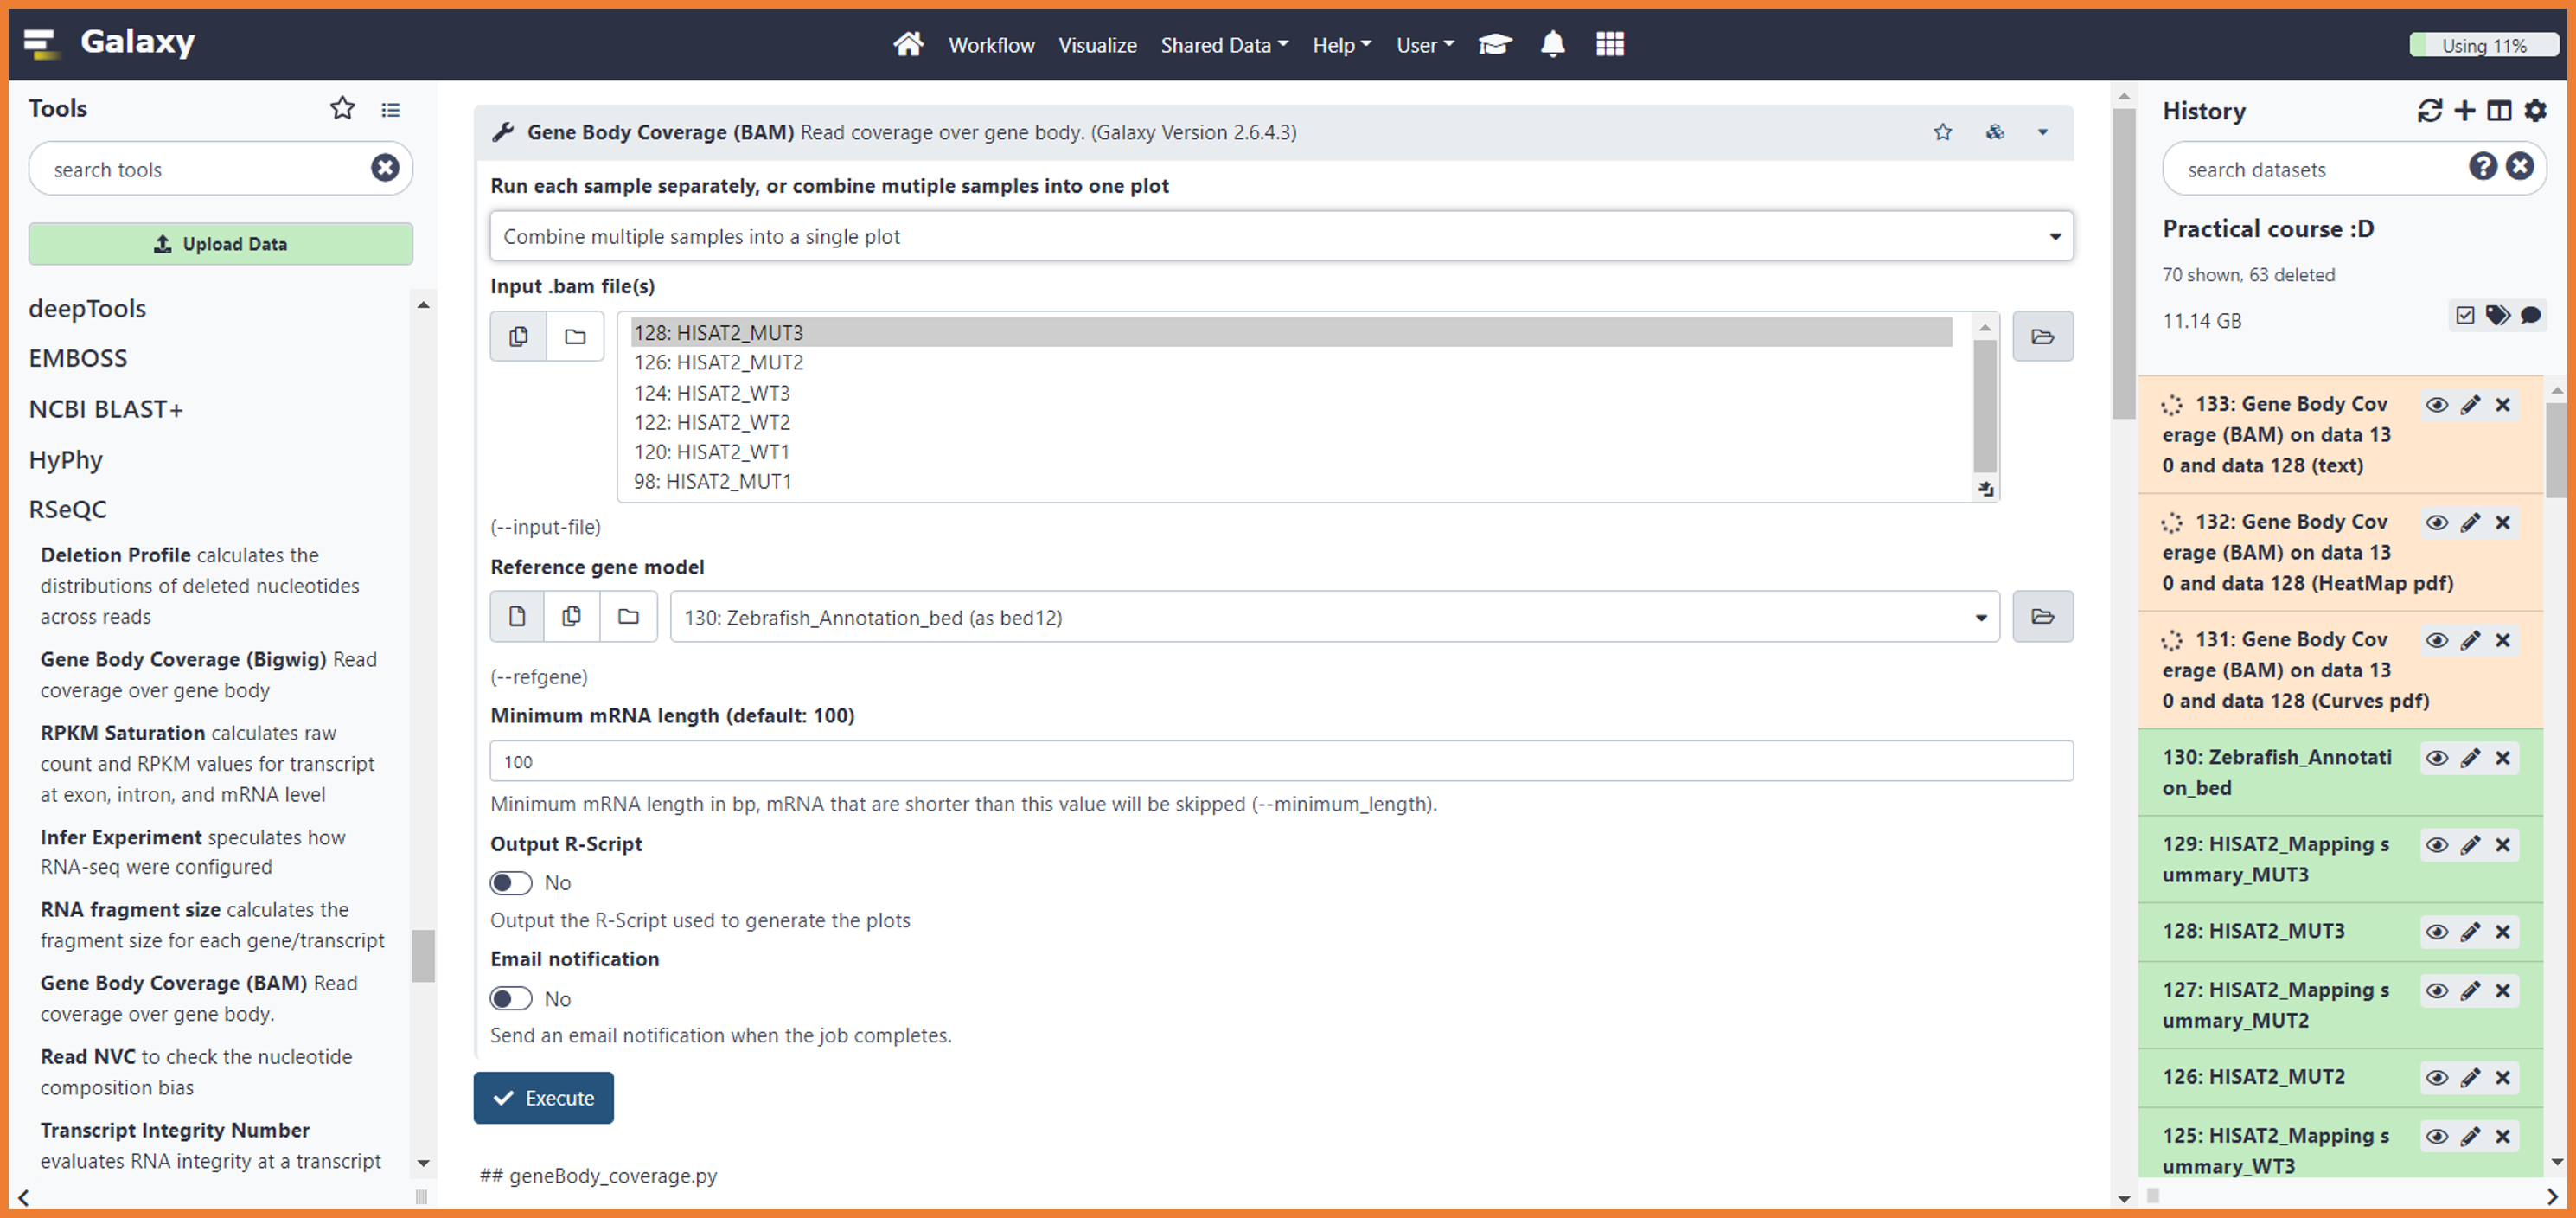
- You will get 3 output files; Curves, HeatMap, and text
- To visualize the results click on the "eye icon" of the "curves" file
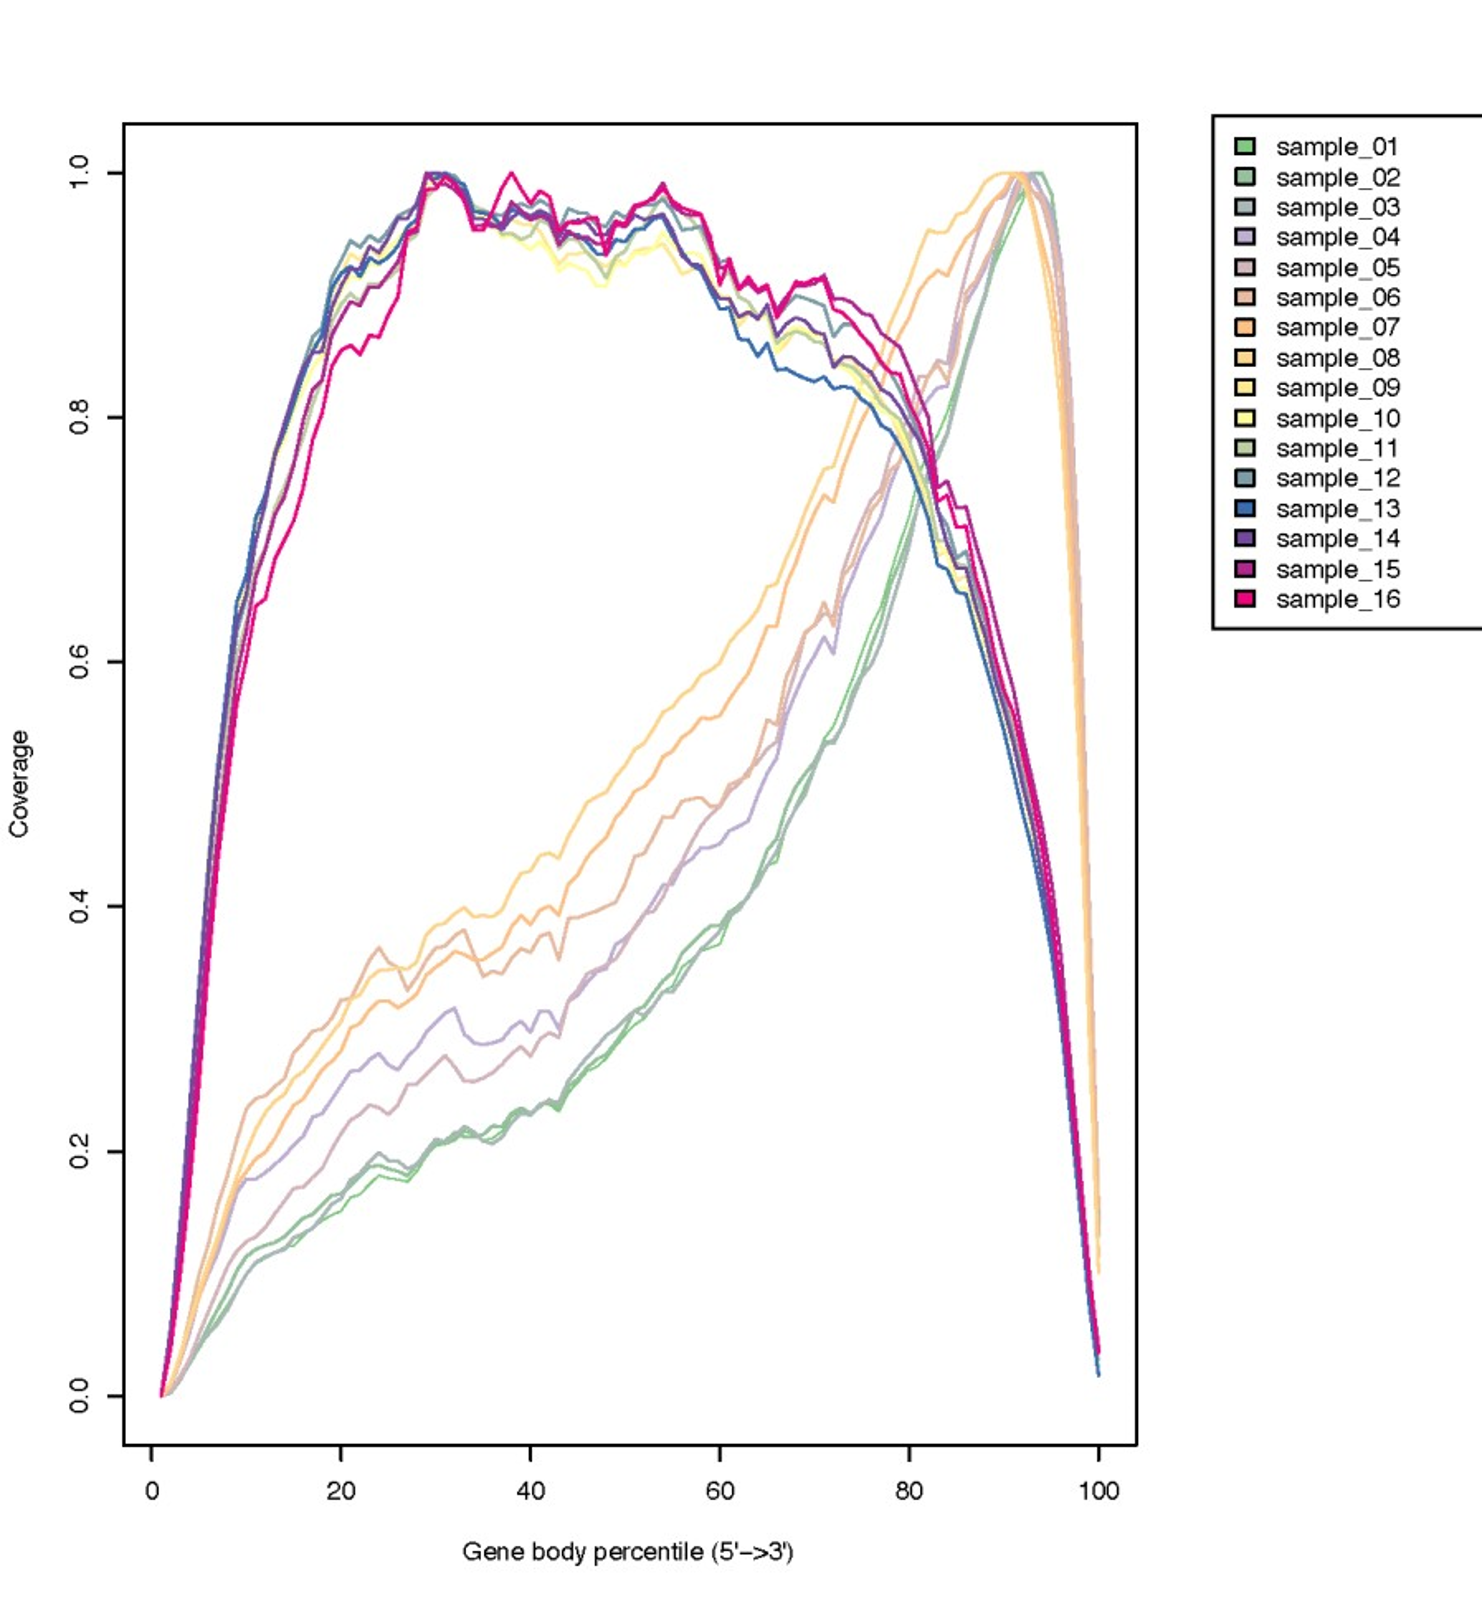
- Based on the plots, ¿What can we conclude about the data?
-
Sequencing depth directly influences transcript/splicing discovery, as low expressed isoforms might not be covered if our libraries were not sequenced with enough deepness. In general, for a determined tissue, the number of expressed genes and isoforms is fixed. Then, subsampling sequencing of a well-sequenced sample should not affect the junction discovery. This module of RSeQC checks for junction saturation by re-sampling the mapped reads and then compares splice junctions detection among them.
-
To calculate follow the instructions below:
- In the Tools menu (left side) search the program *Junction Saturation
- GENOMICS TOOLKITS --> RSeQC --> *Junction Saturation
- Input .bam file(s) (It will run in batch mode)
- HISAT2_WT1
- HISAT2_WT2
- HISAT2_WT3
- HISAT2_MUT1
- HISAT2_MUT2
- HISAT2_MUT3
- Reference gene model
- Zebrafish_Annotation_bed (imported during Day 1)
- Minimum intron length (bp, default=50)
- Minimum number of supporting reads to call a junction (default=1)
- Minimum mapping quality 30
- In the Tools menu (left side) search the program *Junction Saturation
-
Click in execute to launch the job
- As output, we will get a plot displaying Know, Novel, and All junctions.
- A saturated sequencing should display a know junction curve describing a "plateau", otherwise the data set is not sufficiently sequenced to perform isoforms analysis.
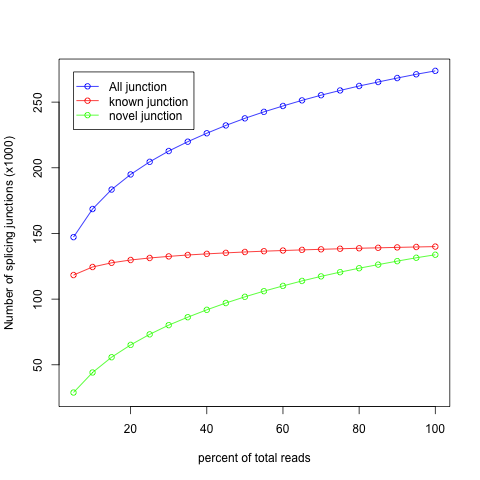
- How does our data set look?? Are they saturated?
Instructions
- Join Groups
- Discuss with your group the Mapping QC Assigned by the professor
- You will have 15-20 minutes to conclude the results and propose an approach to improve the metrics.
- Posteriorly, you group will expose the conclusions on a final discussion.
Bonus: Tutorial of how you can visualize the mapped reads with the program IGV
Well, so far so good! You are a beginner in RNA-seq data analysis...let´s move further!