Stanford Exercise 2 - SummerBigData/MattRepo GitHub Wiki
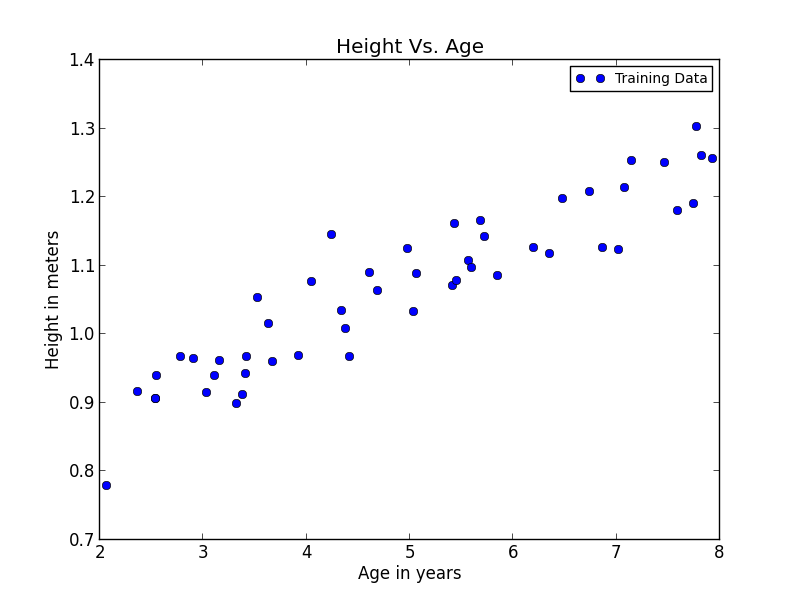
In this exercise we were given files that contained two arrays. The first array is the heights of multiple boys and the second array is their ages between 2 and 8. The y-values are their heights in meters and the x-values are the ages in years. There were a total of 50 data points. This graph shows what the distibution of the data points looks like.

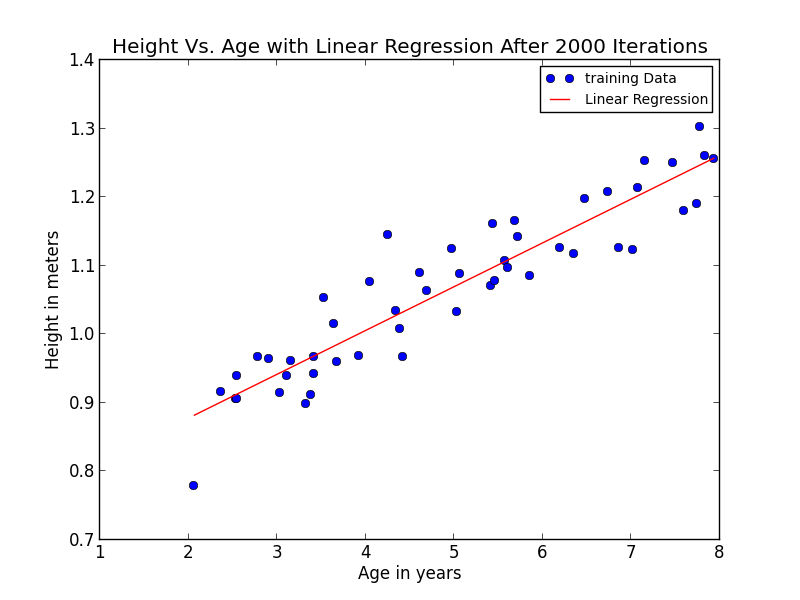
We then implemented linear regression using gradient descent. This was done by setting up columns for both the x and y values and starting with theta as a (2 x 1) column of zeros. Then manipulated the columns to simultaniously update theta0 and theta1 from each iteration. We used a learning rate of 0.07 and we did a total of 2000 iterations to make sure that our theta converged. Our final values for theta0 and theta1 were 0.750047 and 0.0639022 respectively.

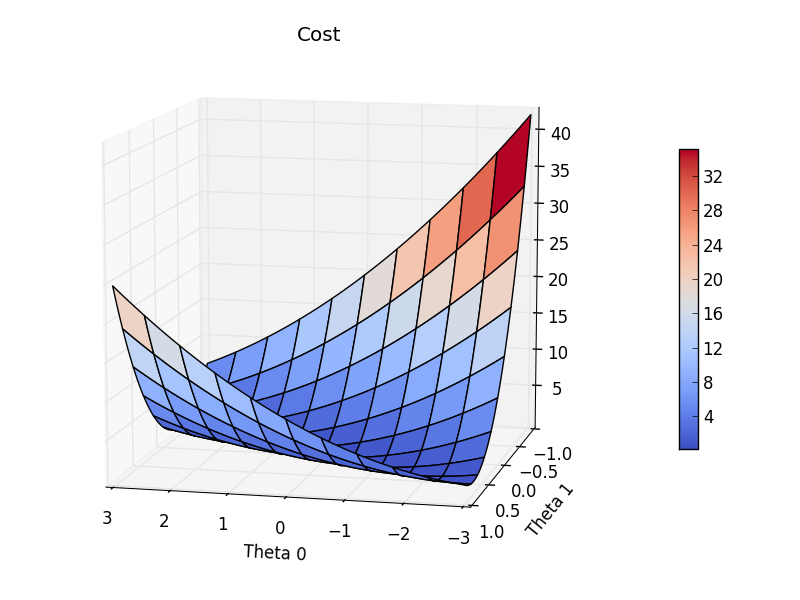
Afterwards, in order to understand the cost function (J(theta)) more a matrix was created for it. Different values of theta0 and theta1 were used to calculate the cost function and stored inside the matrix. A surface plot was then created to show the results.

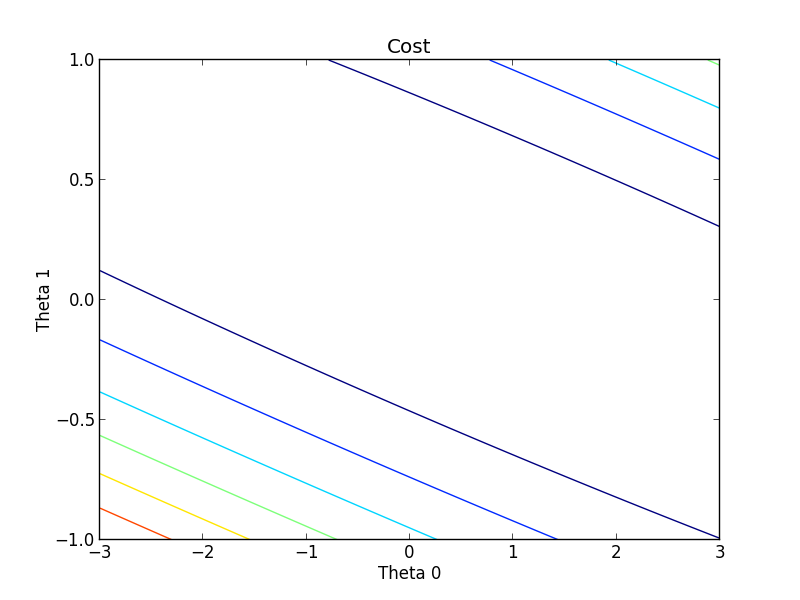
A contour plot was also created for a different view.
