Coursera Exercise 4 - SummerBigData/MattRepo GitHub Wiki
In this Coursera exercise we used backpropagation to calculate our gradient and used SciPy's minimize function with it to find our theta values that best minimize our cost function. We once again were given 5000 digits to read in and trained our program to correctly identify what digits it sees. The 5000 digits we were given to use were in two arrays. One was called X that was a (5000, 400) matrix where each row corresponded to a digit. The other matrix was a (5000, 1) matrix called y that had the numbers 1-10 in it indicating what number each corresponding row in our X represented. The number 10 was used for 0. First, 500 data points were trained and tested on the full 5000 data points. The 500 data points consisted of 50 0s, 50 1s, etc. We first trained them in order from 0-9 and then trained them in a random order. Here is the resulting accuracy for each number from 0-9 respectively:
500 data points (ordered 0-9): 94.2, 94.8, 84.8, 81.4, 87.6, 82.8, 93.4, 90.6, 85.6, 78.4
500 data points (random): 95.0, 95.2, 86.2, 80.4, 86.4, 82.0, 93.4, 90.2, 85.2, 78.6
Next we trained all 5000 data points and then tested it on the same 5000 data points. Here are the results:
5000 data points (ordered 0-9): 99.8, 99.8, 99.6, 98.8, 99.4, 99.6, 99.8, 99.6, 99.6, 99.0
5000 data points (random): 99.8, 100, 99.6, 98.4, 99.4, 99.8, 99.6, 99.6, 100, 99.4
Then we visualized the hidden layer a2 to see what it looked like.

We also visualized the first theta array for both the 5000 trained set done in order, and 5000 trained set done randomly.
Ordered:

Random:

Here is a closer look at two of the images. The first one is from the ordered trained set and the second is from the random trained set.
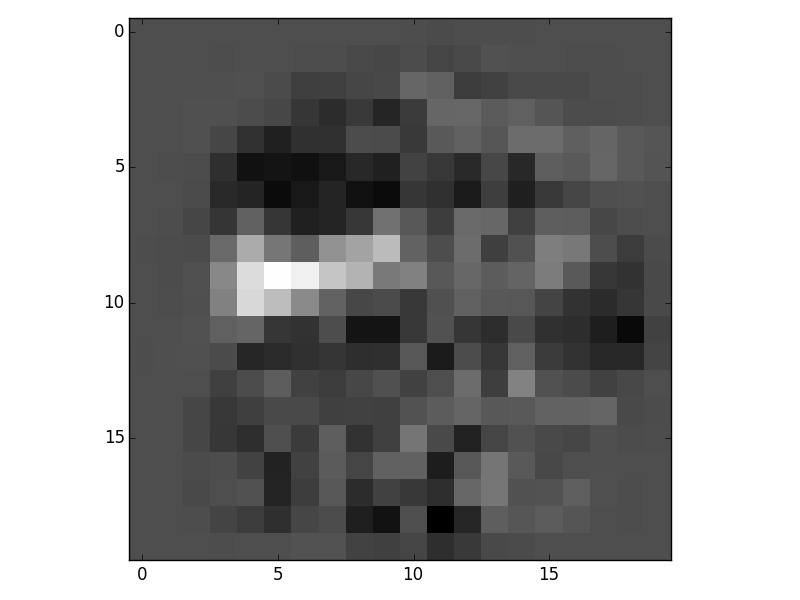
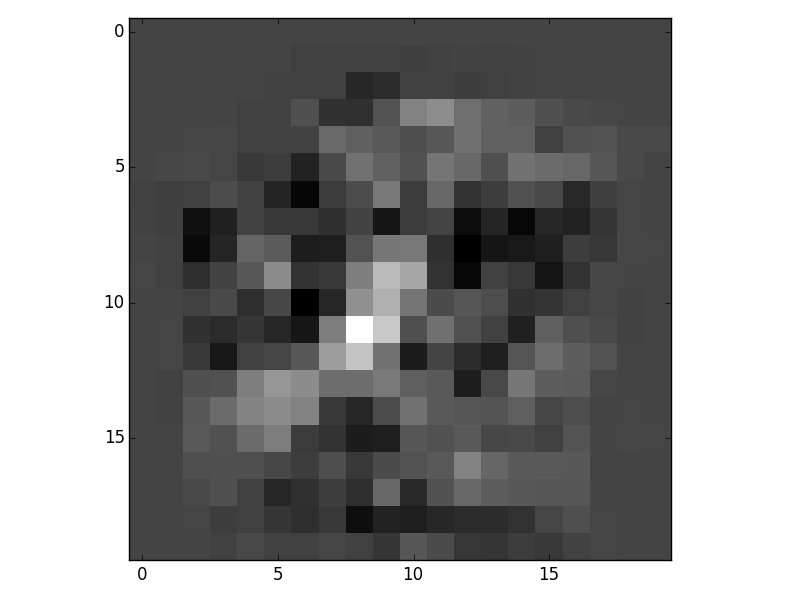
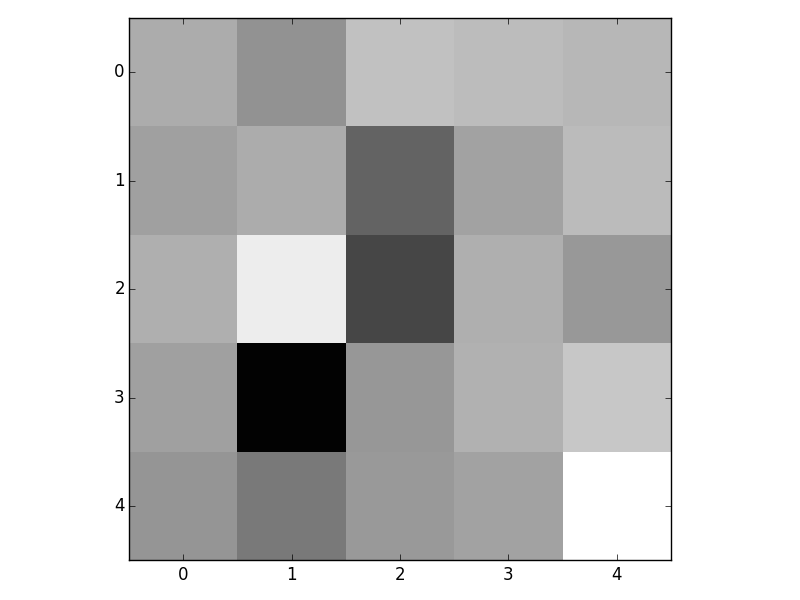
Here is a visualization of theta2:
Ordered:

Random:

Here is a closer look at two of the images. The first one is from the ordered trained set and the second is from the random trained set.

Next we looked at the MNIST data set. It comprises of a 60,000 training set and a 10,000 test set that are all randomized. Both sets have an x array that is (60000, 784), which means each row is a flattened 28x28 image, and a y array that indicates what digit each corresponding x row represents. Everything was trained with a lambda value of 1 unless stated otherwise. First we trained different amounts of the training set for an hour each and here is what the results are:
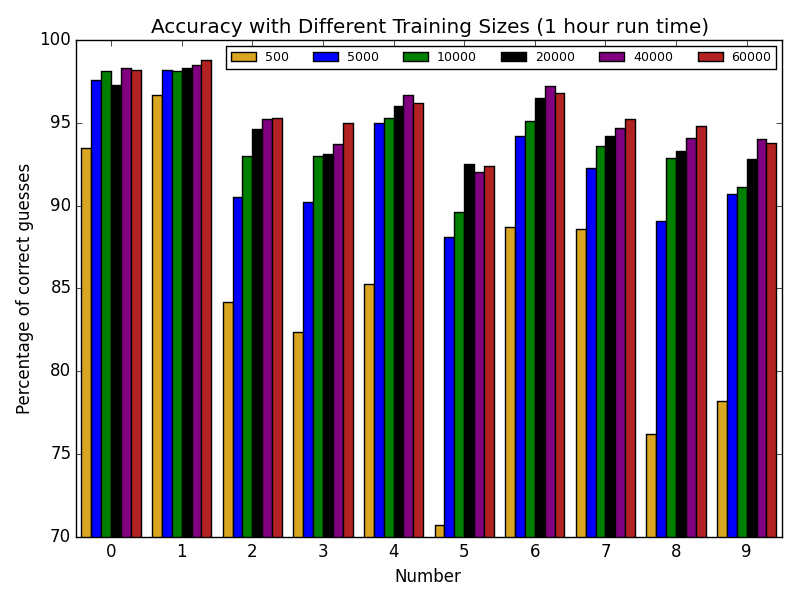
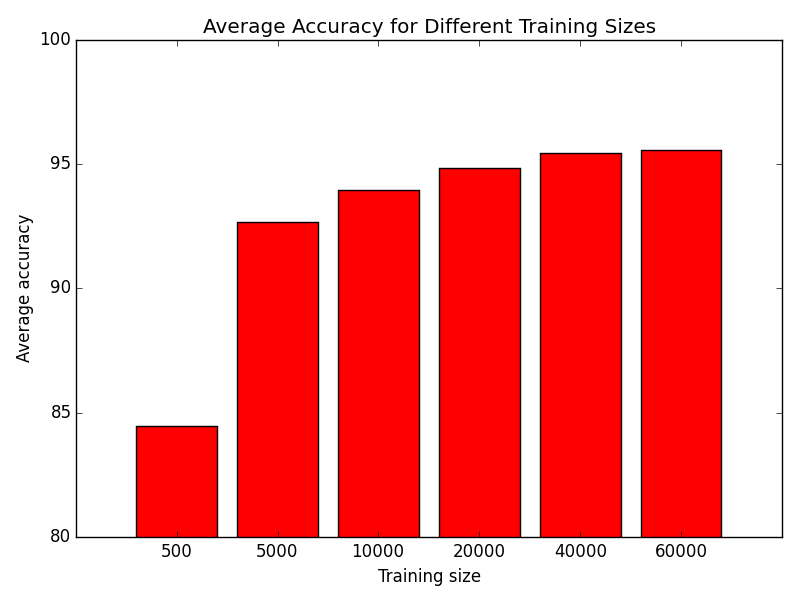
We used a tolerance of 1e-4 for our minimize function and only the 500, 5000, and 10000 converged within an hour. The rest were not finished when they ran out of time.
Next, we ran a 30,000 sized training set with different lambda values. We used a tolerance of 1e-3 this time so our minimize function would converge faster. We can see that 0.01 and 100 are not good values.
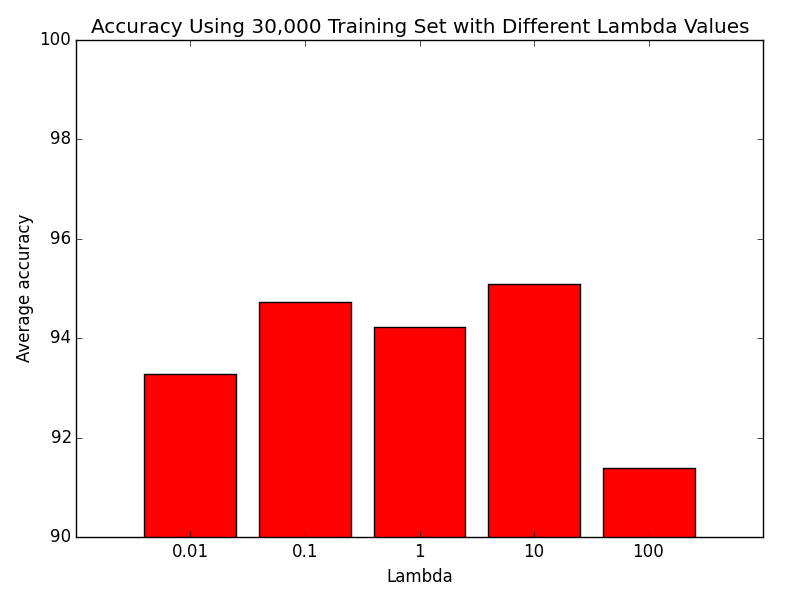
Then, we ran the 60,000 training set for 3 hours. We had an average accuracy of 95.53%.
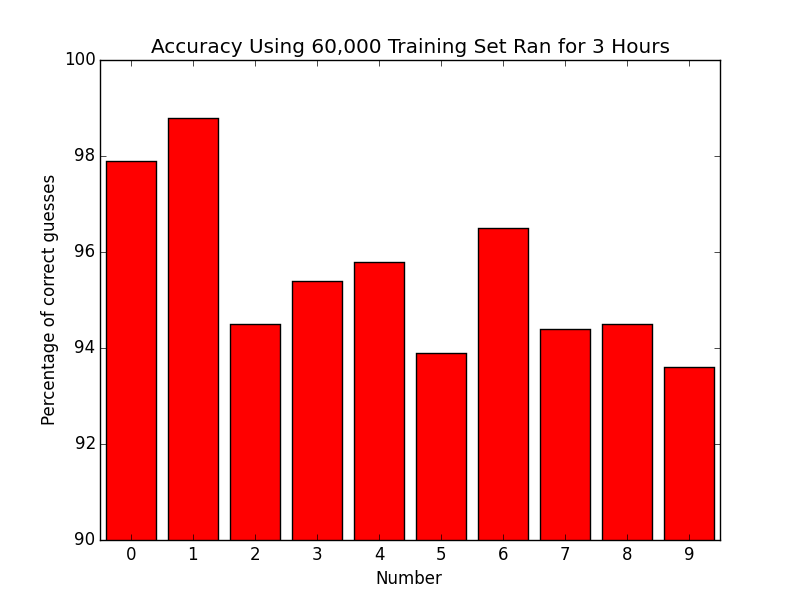
Later, we used that same training set to see what would happen if we rotated our test set's images 180 degrees. Here are the average values:

The accuracy gets worse until a certain point and then starts to get a little bit better. This could be due to some of the numbers looking close to the original when completely flipped. Here is a sample of some of the accuracies for each digit:
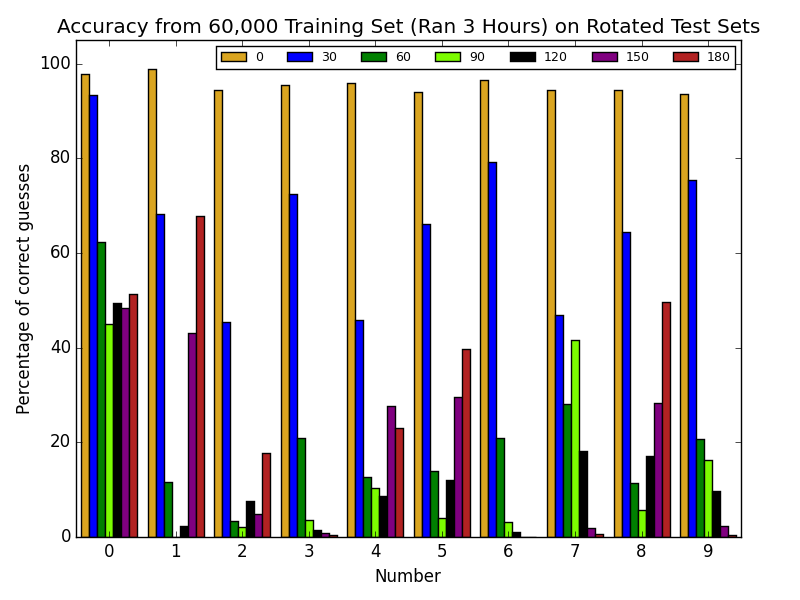
We then created an image of each digit and rotated them like we did earlier to see what they would look like.


