Installation - SoftFx/Hierarchical-Sensor-Monitoring GitHub Wiki
In order to to deploy HSM server, we need to take the following steps:
- Install Docker;
- Deploy HSM image (manually or using script);
- Go to HSM site;
To consider the operation of the HSM server using the example, go to Demonstration work.
Docker Install
In order to deploy the server, we need docker. Once installed, you need to run it.
Docker HSM image
Downloading and launching Image is possible manually or through ready-made scripts provided by HSM.
Using docker compose file
- Download docker-compose.yml
- Open Command prompt.
- Use
docker compose up
Manually deploy
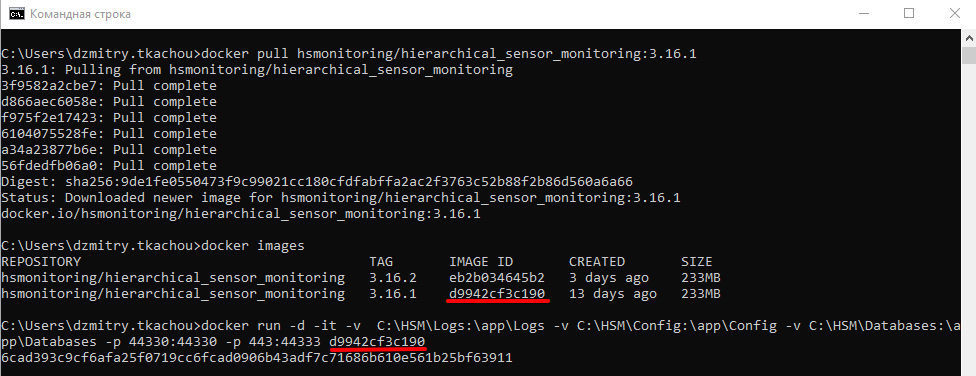
- Open HSM product dockerhub;
- Copy pull command for last image Tag;
- Open Command prompt;
- Paste pull command from clipboard;
- Use
docker images
- Use
docker run -u 0 -d -it -v C:\HSM\Logs:/app/Logs -v C:\HSM\Config:/app/Config -v C:\HSM\Databases:/app/Databases -v C:\HSM\DatabasesBackups:/app/DatabasesBackups -p 44330:44330 -p 44333:44333 imageID
Where image_ID - data from step 5.
Script deploy
On first launch, Docker will prompt you to create a test container. We will use script:
- If you have powershell installed use server_load.ps1 to download image and start HSM server container.
- If you have bash use load.sh
For the first launch of HSM and adding an Image - you need to run the script server_load.ps1 or load.sh.
Powershell script example:
Docker will add the Image to the list and create a Container for it.
HSM site
Go to browser address - https://localhost:44333/ .The HSM start page will open
For testing use the base user - Login: default, password: default.
As a result, access to the site will open. The tree tab will present the site's HSM self-monitoring.
Demonstration work
Let's consider the operation of the HSM server using the example of connecting the receipt and rendering of the weather chart in the current user location. Below is the current temperature graph:

Instruction how to add any external products (TickTraderServer, Aggregator, AdminEye) to HSM see in Products section.
Product creating
Now, in order to add our own sensor, which, for example, will track the weather, we need to create a new product. To do this, go to the Products tab. Click link "+Add product". Enter the name of the product, in the corresponding line, and click the "Add" button. This is how a new product will appear.
Go to the product settings, to do this, click on its name. To transfer data via API, the user needs to know the project key, which is set when creating the product.
Collect and send data
This resource was used as a source of weather data which allows you to get information about the weather in your current locale for every hour.
Using the data from the source, we will create a script that allows to get the temperature, send it to the HSM and thus track the temperature graph.
Remove-Variable * -ErrorAction SilentlyContinue; Remove-Module *; $error.Clear();

function GetWeatherFromSource {
    param([string]$url = "https://api.open-meteo.com/v1/forecast?latitude=52.52&longitude=13.41&hourly=temperature_2m");
    $headers = @{"Content-Type" = "application/json" }
    $response = Invoke-RestMethod -Uri $url -Headers $headers -Method Get
    $temperature = $response.hourly | Select-Object -ExpandProperty temperature_2m;
    $timestamps = $response.hourly | Select-Object -ExpandProperty time;
    return $temperature, $timestamps
}

function UploadDataToHSM {
   param([string]$productKey, [string]$address, [string]$path, [string]$time, [double]$value, [int]$status, [string]$comment);
   $headers = @{"key" = $productKey; "Content-Type" = "application/json" }
   $fulladdress = $address + "/api/Sensors/double"
   #$body = @{"path" = $path; "time" = Get-Date -Format "yyyy-MM-ddTHH:mm:ss.fff"; "status" = $status; "comment" = $comment; "value" = $value} | ConvertTo-Json # тело запроса в формате JSON
   $body = @{"path" = $path; "time" = $time; "status" = $status; "comment" = $comment; "value" = $value} | ConvertTo-Json # тело запроса в формате JSON
   $response = Invoke-RestMethod -Uri $fulladdress -Headers $headers -Method Post -Body $body
}

$productKey1 = "product_key"
$address1 = "https://localhost:44333"

$path1 = "Weather In Minsk"
$status1 = 1
$comment1 = "Current weather"

[System.Net.ServicePointManager]::ServerCertificateValidationCallback = {$true}

$data = GetWeatherFromSource "https://api.open-meteo.com/v1/forecast?latitude=52.52&longitude=13.41&hourly=temperature_2m"
$weatherDataLength = $data[0].Length
for ($i = 0; $i -lt $weatherDataLength; $i += 1)
{
   Write-Host "$($i + 1) from $weatherDataLength was uploaded"
   UploadDataToHSM $address1 $path1 $data[1][$i] $data[0][$i] $status1 $comment1
}
In order to get the graph, we need to replace only one variable - $productKey1 = "product_key". Instead of "product_key" insert the previously generated product key on the site, on the "Products" tab.
Now, if we add the launch of this script every hour, the temperature will be updated on the chart, to collect and process the received actual data.