logbook - RowinRuizendaal/frontend-data GitHub Wiki
Process logbook
19-10-2020 - Kickoff Tech Track
- Started to make this wiki with an empty sidebar and setup
- Started to make a local NodeJS server to play with the survey data
- Quick insight into the RDW datasets
20-10-2020 - Functional Programming
- Started to make this wiki for documentation
- Started to make a debrief of the assignment
- Further research of the available datasets
- Started to clean up the survey data
21-10-2020 - Practice day, cleaning up
- Livecode session with Laurens about functional programming (FD)
- Started to refactor my code with the new insights of the LiveCode session
22-10-2020 - Looking for interesting insights
- Scanning each dataset provided by the RDW about parking (cars)
- Thinking about questions that I can ask with the provided datasets to make a visualization about
- Looking up more information about functional programming to get an idea of what I can improve about my code
23-10-2020 - Coaching session
- Talked to Danny about my progress, He thought I was well on the way with my wiki, and gave me the advice to not refactor my code that many times since I don't really have time to get in touch with the other datasets for higher difficulty. Also, He gave me the advice to splits up my code, which I totally forgot to do :(
26-10-2020 - Group Brainstorm
- Together with my support group (5), we brainstormed about concept ideas and made a mindmap about this.
- Thinking about my research questions, and made a start with programming with the RDW datasets
- Started to make javascript functions that I can use throughout the whole project
27-10-2020 - Group Brainstorm
- Watched Laurens with the LiveCode sessions where he explained some basic code principles such as async, await & promises
- Refactoring my code, and made multiple functions where I can select data with and a function that makes it possible to get multiple columns
28-10-2020 - Peer-feedback & live coding
- Watched Robert giving a live coding session with modules, that you can use to split up code, to keep your code much cleaner, and to recall functions that you've made
- Giving feedback to Sam & Ralf about their repro
- Do you understand the research question in the Readme?
- Create an issue on the repo in which you describe which (sub)questions the research question you reviewed raises to you.
- Describe in the same issue what data this person could use even more in this question
Got feedback from Ralf & Sam
Ralf:
Research question: How can you pay at a specific parking garage? The research question is very clear and nice and broad. So you can go in all directions with this question.
What do you want to know more about specifically? I would choose a direction (focus) within your question because then you can work towards that more 👍

(Sub) Questions that your research question raises for me:

    - Are there parking areas where you can pay with crypto coins?
    - How far apart are the payment terminals in a particular parking area?
    - Are the payment machines wheelchair-proof (height of machines)?
    - Where can you still pay with cash at a payment terminal?
    - How are the payment methods (cash, pin) distributed throughout the city? Center more pin options than outside the center?

Data you could still use:
    Location of payment terminals (I don't know if this data is there?)
    Prices per parking area (-> does the area (center, A'dam East) influence this?)
Sam:
One of your questions is by which garages you can pay by card in 2020, are you also going to look for data before 2020 to see if there is an increase in places where you can only pay by card.

Maybe there are some rare or weird payment methods for parking garages interesting to note.

Datasets needed

I think you have all the essential data you need. Maybe you can find some more interesting variables related to payment and money.  Like in this dataset there is information about how expensive parking is:
https://opendata.rdw.nl/Parkeren/Open-Data-Parkeren-TARIEFDEEL/534e-5vdg

Assumptions

Some assumptions I made when reading:

    - There are more places where you can only pay by card than by cash
    - Parking spots closer to the city center have more payment options and are more expensive than ones further away
After I got this feedback, I changed my work based on the provided feedback, I made sub-questions, made an adjustment in my assumptions.
29-10-2020 - PeerReview
- Got a guest lecture from Serena, about data that is being processed at the Volkskrant and how to make the visualizations with a sort of python
- Got some tips from Serena about where to search for other datasets, and how to work with them
- Peer review from Ralf
Feedback from Ralf that I was missing:
- Beschrijf je concept, wat wil je maken?
- Waar zijn je gebruikte bronnen en credits to?
- Waar is het transforming process ?
Full issue is here
29-10-2020 - Feedback from teacher
- Got feedback from the teacher(s) on my code and on my repo:
Hoe zou je evt je visualisatie vorm willen geven?

gevorderd tot expert, past automatisch toffe standaarden
toe in code + structuur/github
I forgot to add a sketch of my application at my wiki, so that is why that one was missing (•_•)
02-10-2020 - beginning with D3
-
started with D3 tutorial from Curran Kelleher
-
started to make a map with D3
-
Sjoerd was asking me to look with his map and to find some bugs, I insisted on this because our concept is almost the same, we couldn't figure out what was causing the issue so we decided to have a look the next day.
03-10-2020 - Interactive D3 map
-
Sjoerd and I decided to get help from Gijs, we were in a call for about 1.5 hours when we finally figured out what was causing the zoom function to not work, after all, it seemed like we were using a wrong version of D3.... (╯°□°)╯︵ ┻━┻) (shit happens)
-
So now we have a clickable/zoomable map I decided to go back to the drawing board to extend the sketch of want I want

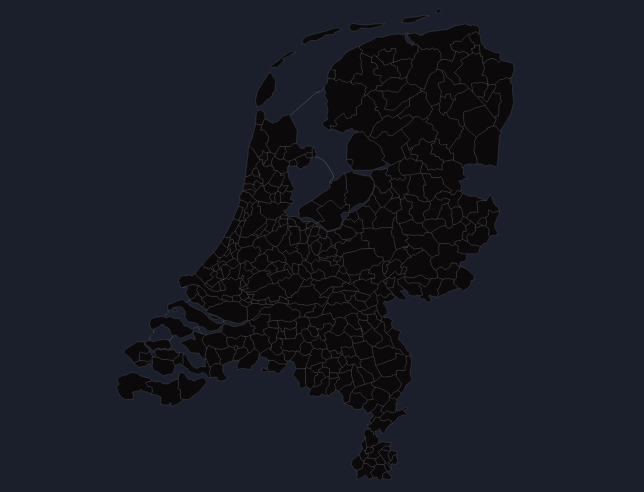
d3 map normal

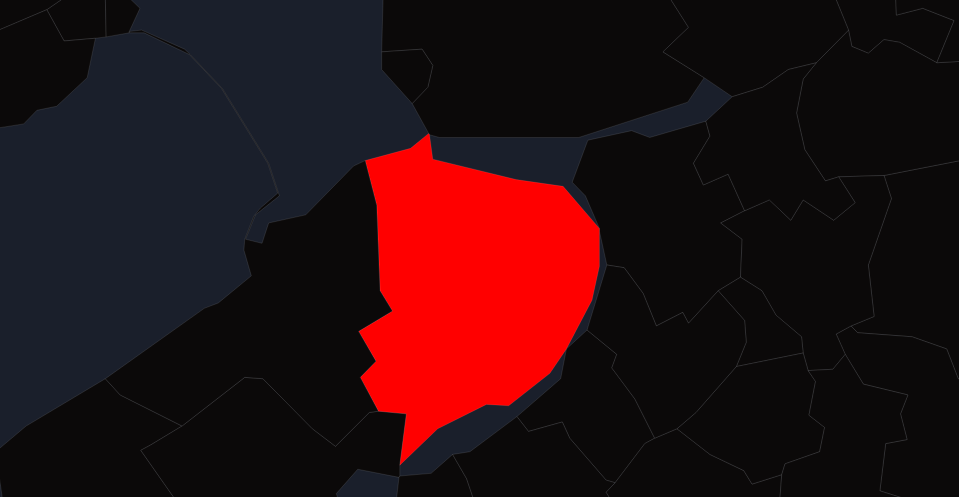
d3 map zoomed in when the user clicks on a region
04-10-2020 - D3 in depth
Today I've been watching some Curran videos on youtube to understand the basics of D3, besides that, I've made a new chapter into my wiki with the usage of D3.
05-10-2020 - Feedback
Today I had a talk with Serena from the Volkskrant, she mentioned that I had a luxury problem, I had plenty of ideas which caused my vision for one specific theme, her feedback was very important because of her she gave me a new insight and a theme.
06-10-2020 - Feedback, working on visualisation
Today I've had a talk with Laurens talking about my code and visualization, I was asking Laurens for some specific D3 parts, one of the parts is where some browsers are not showing the dots on the map, but after some refreshes, they appear on the map, Laurens couldn't really give me an answer of why this was happening but he suggested to have a look at the code step by step. Unfortunately, I could not find the bug, I thought I fixed it by using a different JSON hosting platform which seemed to be faster, but the website was down the next day (╯°□°)╯︵ ┻━┻)
09-10-2020 - Feedback, working on visualisation
Today I started to make, my visualization more looks and style, with hovering tooltips and click event, also I've managed to make a dropdown with specific values of my dataset, this took me longer than expected because of a select D3 problem which I encountered.
10-10-2020 - Feedback, working on visualisation
I've updated my wikim and tried to refactor some code
11-10-2020 - Filter with dots
Implemented a filter on the map with payment methods, so you can now press the button and the dot will apear on the map where you can pay at a certain point with the payment method.
12-10-2020 - Filter with dots
Implemented a barchart where you can compare prices with diffrent parking spots, this took me big time to fix with enter, exit and remove