6. KnetMaps.js: network visualization - Rothamsted/knetminer GitHub Wiki
The KnetMiner Network View, i.e., KnetMaps, uses cytoscapeJS and jQuery for visualizing the network graphs. It is now up and running on all KnetMiner instances using the following simple steps:
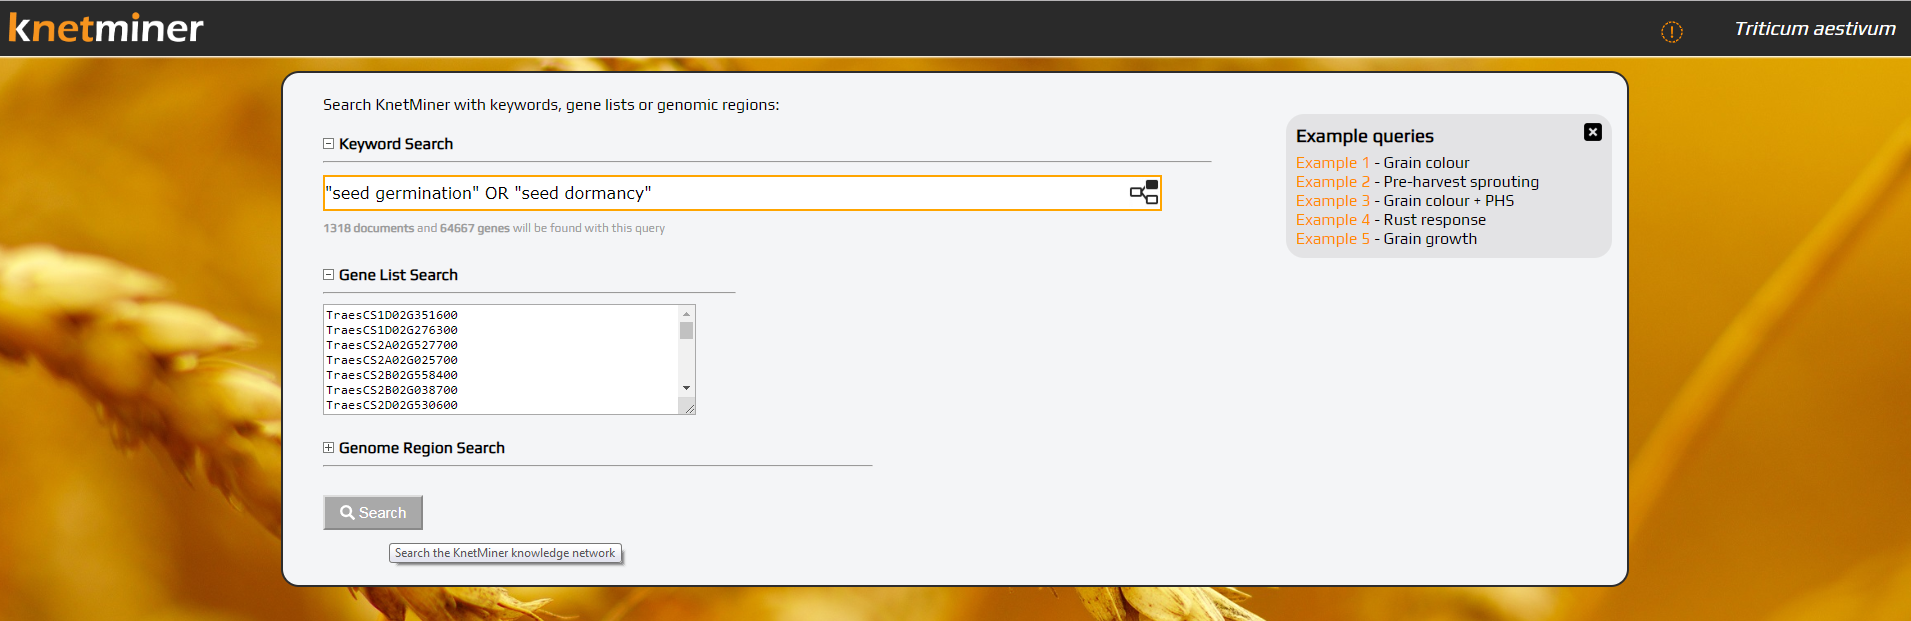
- Search the species-specific instance/ knowledge network using any query terms (e.g, using any of the example queries provided)
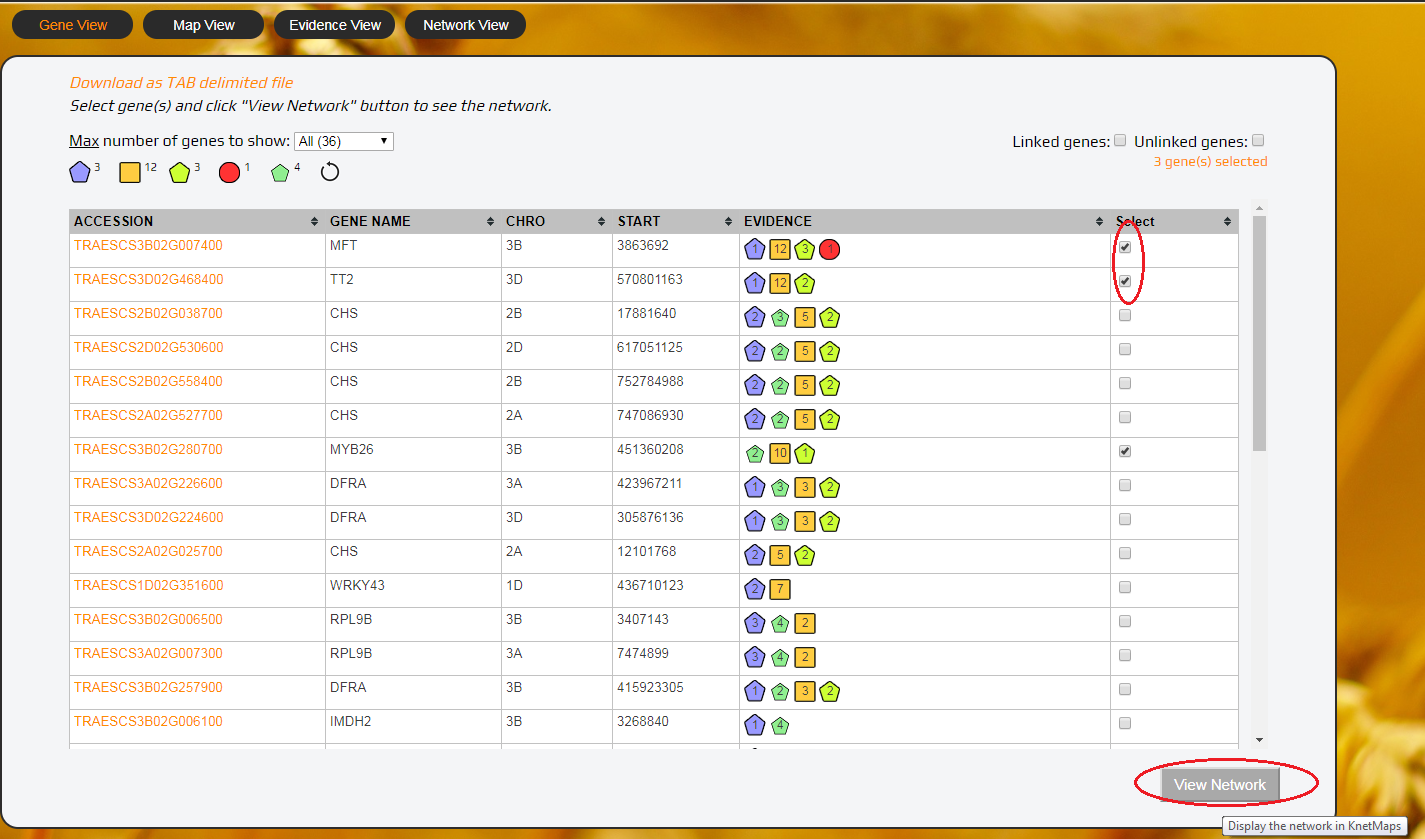
- Scroll down to the results (in the Gene View tab) and select one or more genes or click a gene.
- Click on the “View Network” button underneath of the table which will open KnetMaps in the Network View tab. KnetMaps can then be maximized to full screen.
1. Search...
2. Select genes...
3. View in KnetMaps...
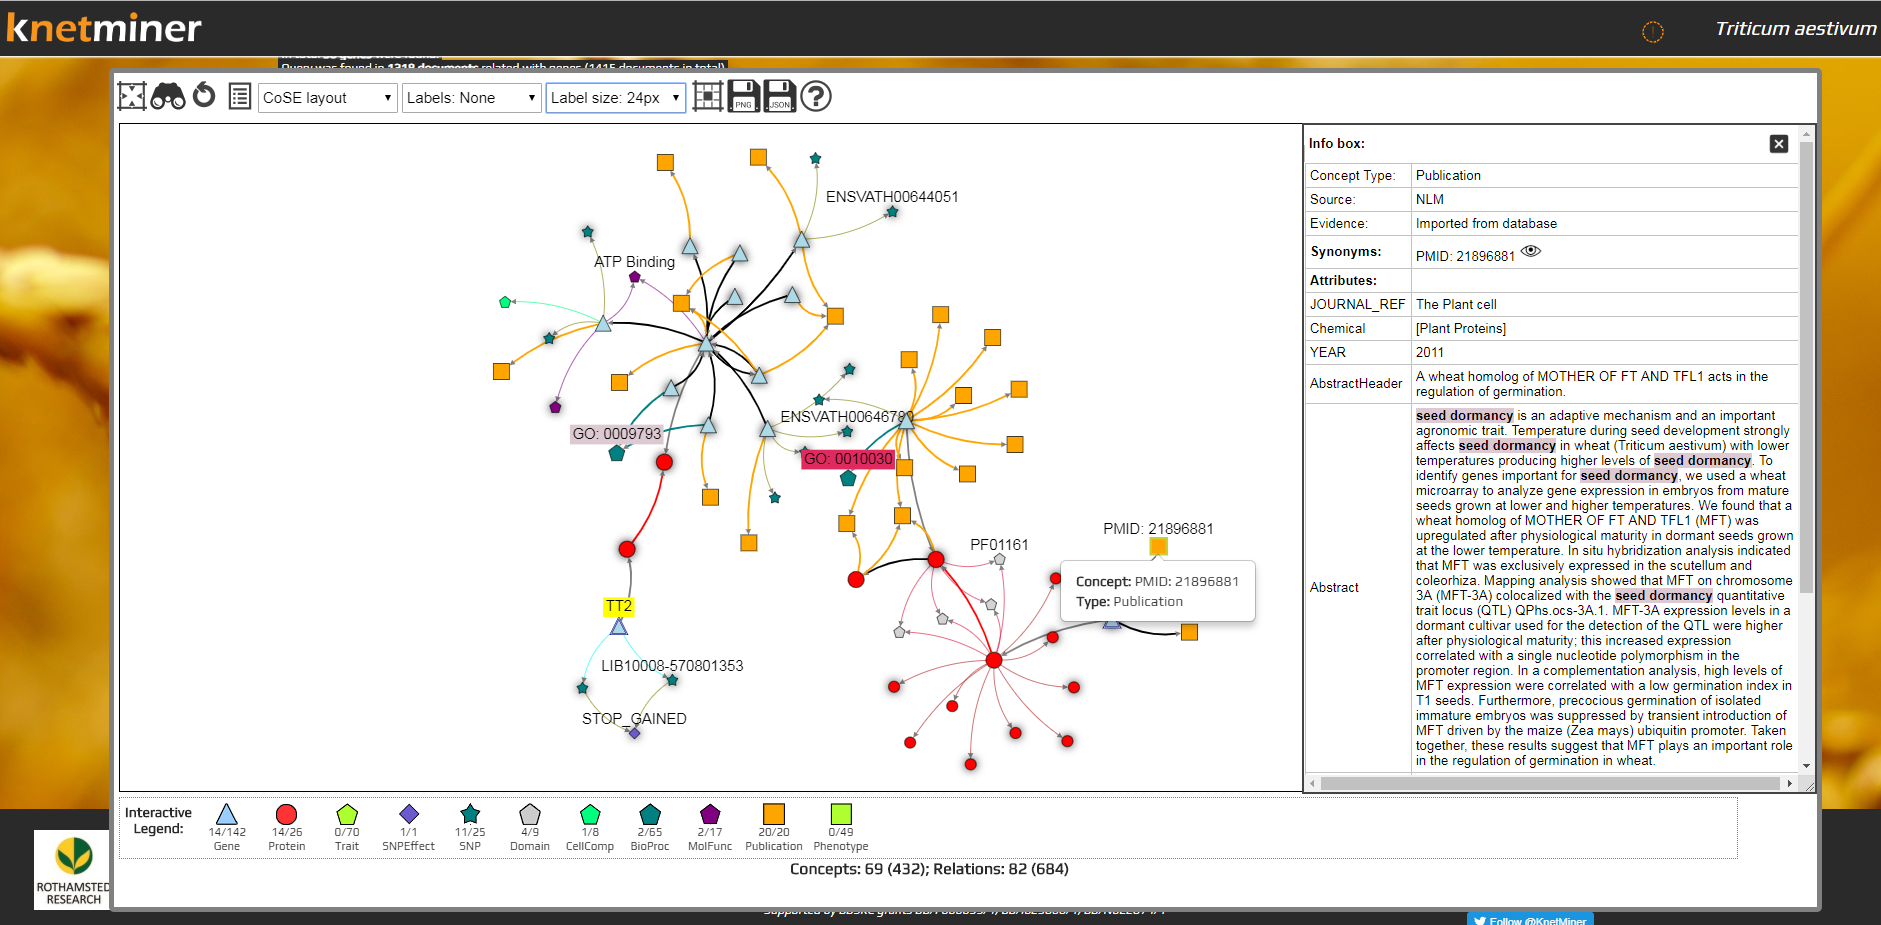
KnetMaps improves on the performance and rendering capabilities of the old Java applet-based Ondex Web Network View. Some of its features are detailed below to help new users get familiarised with it:
-
Concepts (nodes) are displayed using different symbols and colours like in the old Java version (detailed in the Legend below the graph). Relations (edges) too use various colours depending on the type of concept, as in the old Java version.
-
Touch gestures: KnetMaps can also be used with tough devices. Touch gestures such as tap (click), hold, drag, etc. have been incorporated within KnetMaps to enable interactive exploration of network graphs.
-
Flagged genes: All the genes are displayed as blue triangles but the gene(s) originally selected for viewing in the network window have a double border to visually distinguish them from other genes. These were shown in the old version with a blue flag next to them.
-
Users can left-click a concept or relation to view some more information about them or drag them (click and hold) to move them around. Users can also drag the entire network around by dragging the background viewport.
-
Labels on concepts and relations are disabled by default. These can however be enabled if the user wants. User’s search query terms, if found in these labels, are highlighted as well.
-
Concept sizes and Relation widths depend upon their importance in accordance with the user's original query terms.
-
Context menu: Right-clicking a concept or relation opens a circular context menu with features like Item Info. (to display specific information about the selected concept or relation), Show Links (to show hidden elements in its neighbourhood), Hide (to hide the selected concept or relation), Hide by Type (to hide all the concepts or relations of a particular type, i.e., the same type as the selected concept or relation), Label on/ off (to toggle the visibility of the Label on/ off for the selected concept or relation) and Label on/ off by Type (to toggle the visibility of Labels on/ off for all concepts or relations of a particular Type).
-
Update concept name: There are also eye icons next to concept synonyms and accessions in the Item Info. table. Clicking on such an icon updates the concept label in the network graph with this new value. This is useful in case users want to use their preferred names (from the synonyms or accessions) for concepts.
-
KnetMaps menubar: This allows users to:
- Change the graph’s Layout using force-directed layout algorithms. Some of the useful layout options are the default (CoSE), Force, Circular, Cose-Bilkent and Concentric.
- Re-layout the entire graph.
- Open the sliding Info box.
- Export graph data (and visual attributes) as JSON.
- Export graph as a .png Image.
- Reset the graph viewport.
- Make labels visible on concepts, relations or both
- Toggle label font size.
-
Info box: The information panel on the right is to display relevant information related to the selected concept or relation. It automatically slides open if users right-click a concept or relation and select “Show Info” option. The Info box is similar to the Item Info window in the old version and displays information such as concept/ relation Type, value, PID, relation label, relation source (from), relation target (to), Annotations, Attributes (such as publication abstracts, title, authors, amino-acid sequence, TAX ID, etc.) and Accessions (with links to TAIR, Ensembl, UniProtKB, PubMed, KEGG, IPRO, PFAM, etc., where relevant). User’s search query terms, where found, are highlighted in this Item Info. panel.
-
Show Links: Some concepts have a blur effect which denotes that they have hidden concepts connected to them. These can be displayed by right-clicking on a blurred concept and selecting “Show Links”. This displays the hidden neighbourhood for the selected concept.