Week 09 (W3 Jan18) London RE - Rostlab/DM_CS_WS_2016-17 GitHub Wiki
Summary:
- As our first predictive task, we decided to try and fill in the missing area measurement values for the listings using Probabilistic Neural Network. However, the predictions were not very accurate and therefore we decided that they can not cannot be used to fill in the missing values.
- Additionally, price predictions were also done using regression using exisiting data.
- We also downloaded fresh data off the Zoopla server to incorporate into our existing corpus. Around 10,000 listings were added.
Details of work done:
Area measurement prediction using PNN
Area measurements were not explicitly provided in the data set, but some property agents mentioned these in the property descriptions, which we were able to then extract by processing the description text and saving as a separate attribute. Area for around 35% of the listings were attained by this method. Because we believe that the area measurements for a property being either sold or rented is extremely important in making a decision, we decided to try and find the missing values for this attribute. We used the following attributes:
- Property type
- Number of bedrooms
- Property district
- Price
- Area measurement (derived attribute by us, also the target column)
Once we had the predicted values, a mere accuracy of only 0.28 was achieved. we believe this is because of the very small corpus of Area measurements. Thus we have decided to discard this approach and will look for alternatives.
Price prediction using regression
This week we also tried using Sci-kit-learn in attempt to predict property_price using regression.
K-means clustering and PCA
First, we decided to look at clustering to get a general idea on how our data set looks. This was done using the K-means model with the numeric data in our dataset. For the number of clusters we chose to do five. To display it in a plot, we created a principle component analysis model in order to reduce the dimensions of the set.
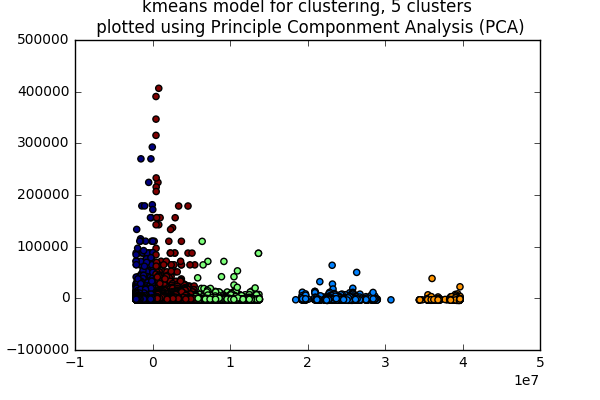
Here, we can see the distinct clusters. We can at a later time look into what factors are causing these listings to be listed together in each cluster.
Regression
Afterwards, we decided to venture into using regression to predict our property_price variable. We first took a look into the correlation between property_prices and other numeric variables and the following is the result.
| variable | correlation |
|---|---|
| property_longitude | -0.19 |
| property_listing_id | -0.05 |
| property_num_bathrooms | 0.27 |
| property_num_bedrooms | 0.50 |
| property_num_floors | 0.02 |
| property_num_recepts | 0.14 |
| property_price | 1.00 |
| property_rental_prices_per_month | 1.00 |
| property_rental_prices_per_week | 1.00 |
As one can see, the strongest correlation to the price is the property_num_bedrooms variable. We do not consider property_rental_prices_per_month or property_rental_prices_per_week as these are directly related to property_price. Also ''property_longitudeandproperty_listing_id`` have a negative correlation so they will also not be used in the regresson. This then leaves us with only four variables to build our Regression on and they do not appear to have very strong correlations at all.
We then used sci-kit-learn to split our dataset 80/20 for training/test. Now it was time to use the regression model for predictions. First we tried using the LinearRegression model and then took a look at using a RandomForestRegressor.
In order to check our error for the prediction, a mean square error was calculated. For the LinearRegression, the MSE was found to be 132995 pounds squared and for the RandomForestRegressor, 111789 pounds squared. These two numbers are way too high for our predictions to be accurate. These numbers indicate that the predicted prices are still off by an average of 330-370 pounds based on the regression type used.
Further steps
Because we only used numeric variables in these predictions, we are going to look into using other non-numeric variables. For instance, we believe that the post code may also have a strong correlation. Also we will look into the additional data we have gathered such as distance to public transit or the gathered apartment size from the description (however this will severly reduce our data set as only around a third of them have apartment sizes).