Week 03 (W48 Nov30) Global Climate Dataset - Rostlab/DM_CS_WS_2016-17 GitHub Wiki
Week 03 (W48 Nov30) Global Climate Dataset
1 - Summary
Last week we presented the analysis of data for the city of Delhi and also presented our procedure to merge data from 7 big cities of India, as well as analyzed the data from the supplementary WB dataset [3]. Finally, we did correlation for a few features. This week we merged the datasets from the 7 big cities of India, executed spline interpolation of order 2 to fill in the missing values, analyzed of data for the core features Tmin, Tmax, PRCP for 3 more cities of India (Mumbai, Bangalore and Chennai), as well as did correlation of features Tmin, Tmax, PRCP, SNWD of Delhi with 8 more features from the WB dataset [1][2]: (%Arable land, % Agriculture land, Cereal yield, Forest area, Agriculture value added, CO2 emissions, Access to Electricity, Methane Emissions). We observed that some features are positively correlated, some negatively and some others we cannot really make any valid predictions. The findings of this week will help us create more precise predictive models in the upcoming weeks.
2 - Dataset Stats
Global Climate Data (GCD) : Main Dataset
- Number of files: 100.791
- Format: .dly files (Complete Works Wordprocessing Template)
- Size: 26.5 GB
- Features: 46
- Source Date: 1763 - 2015
World Bank (WB) : Complementary Dataset
- Number of files: 1
- Format: .csv
- Size: ~15 MB
- Features: 82
- Source Date: 1960 - 2015
3 - Goals Achieved This Week
- Merged datasets GCD and WB from 1960 to 2015
- Applied interpolation to missing values
- Analysis of 3 core features (Tmin, Tmax, PRCP) for big cities of India Mumbai, Bangalore, Chennai
- Correlation of 4 core features (Tmin, Tmax, PRCP, SNWD) with 8 features from the WB dataset
4 - Merging of Datasets
We extracted the data of the 5 core features (Tmax, Tmin, PRCP, SNOW, SNWD) of the GCD dataset for the 7 biggest cities of India (Week 02) with 43.87% missing values. At the same time we extracted all features of the WB dataset with missing values 49.19%. We converted the data to yearly average for GCD and kept the data from 1960 to 2015. Finally we merged both datasets into one data frame with common index (years). Below is the visualization of our dataframe, that shows the missing values. The merged dataset contains in total 117 features with 61.18% missing values. This visualization accommodates up to 50 labeled variables. Past that range labels begin to overlap or become unreadable, and by default large displays omit them.
 Missing values of 5 core features (Tmax, Tmin, PRCP, SNOW, SNWD) in 7 big cities of India from GCD dataset and 82 features for India from WB dataset
We observe that we have a big amount of data missing from the cities of India, which results into less accurate conclusions based on data. Further we will try to interpolate some of the missing values of the features.
5 - Interpolation of Missing Values
What we also tried this week is filling the missing values with interpolation. We tried 3 types of interpolation: linear, spline of order 2 and barycentric. Below are the results of our interpolation results. It seems like spline of order 2 works better to express our data of Temperature, based on the existing data.
 Interpolation types for missing values of Tmax
6 - Analysis of Temperature and Precipitation of India's four biggest cities
 Map of India that shows 4 cities examined
Mumbai : West Coast of India
The Climate of Mumbai is a tropical wet and dry climate. Mumbai's climate can be best described as moderately hot with high level of humidity. Its coastal nature and tropical location ensure temperatures won't fluctuate much throughout the year. The climate station of Mumbai is station IN012070800 (Bombay santacruz).
- Average Maximum Temperature for Mumbai(santacruz) The Data for Maximum Temperature (TMAX) is available for the years 1957 - 1962 , then from 1973 - 2015. The Graph Below represents the mean average maximum temperature for all the available years(1957-1962,1973-2015)
 Average Maximum Temperature of Mumbai(santacruz)(Celcius)
Let's examine the percentage change from 1957 to 2015: The Graph below represents the average maximum temperature for Mumbai in the intervals of ten. In 1957, the TMAX was 30.91 degrees Celsius and in 2015 it was 33.27.
 Average Maximum Temperature in intervals of 10
The percentage change of mean maximum temperature = 33.27-30.91/33.27 * 100 = 7.093 %. Let's examine the data distribution for maximum temperature for Mumbai: The histogram below represents the data distribution of max. temperature for Mumbai with 10 bins. Also, the red color line at 31.99 degrees Celsius is the mean of overall data. The maximum distribution of data is around mean from 31.5 to 32.5.
 Histogram for Mumbai (Data Distribution for max temperature)
- Average Minimum Temperature for Mumbai(santacruz)
The Data for Minimum Temperature (TMIN)is available for the years 1957 - 1962 , then from 1973 - 2015. The Graph Below represents the mean average minimum temperature for all the available years(1957-1962,1973-2015).
 Average Minimum Temperature for Mumbai
Let's examine the percentage change from 1957 to 2015: The Graph below represents the average minimum temperature for Mumbai in the intervals of ten. In 1957 ,the TMIN was 23.92 Celsius and in 2015 it was 24.42.
 Average Minimum Temperature (In intervals of 10)
The percentage change of mean minimum temperature = 24.42 - 23.92/24.42 * 100 = 2.04 %. Let's examine the data distribution for minimum temperature for Mumbai santacruz: The histogram below represents the data distribution of min. temperature for Mumbai with 10 bins. Also, the red color line at 23.04 Celsius is the mean of overall data. The maximum distribution of data is ON left side of mean from 22 to 23.
 Histogram for Mumbai (Data Distribution for min temperature)
- Average Precipitation for Mumbai(santacruz) The Data for Precipitation (PRCP) is available for the years 1957 - 1962, then from 1973 - 2015. The Graph Below is represents the mean average precipitation for all the available years (1957-1962,1973-2015).
 Let's examine the percentage change from 1957 to 2015:
The Graph below represents the average precipitation for Mumbai in the intervals of ten. In 1957,the PRCP was 26.73 and in 2015 it was 29.44.
 Average Precipitation (years in the interval of 10)
The percentage change of mean maximum temperature = 29.44 - 26.73/29.44 * 100 = 9.2 %
Let's examine the data distribution for Precipitation for Mumbai (santacruz): The histogram below represents the data distribution of precipitation for Mumbai with 10 bins. Also, the red color line at 27.36 is the mean of overall data. The maximum distribution of data is on the left side of mean from 26.5 to 28.
 Histogram for Mumbai(Data Distribution for precipitation)
In conclusion, the mean maximum average temperatures is about 31.99°C (90 °F), while the average minimums are 23.05°C (77 °F). Average precipitation is 27.36 cm.The report according to the Indira Gandhi Institute of Development Research, Mumbai. About 7.1 million people in India would be affected by submergence of coastal lands if temperatures rise by 2 degree Celsius. The economic loss, quite naturally, would be high in urban zones such as Mumbai and Chennai. Studies conclude that Mumbai alone could suffer loses up to $48 billion due to projected submergence. Below is the concluding graph which represents TMAX, TMIN and PRCP together for Mumbai: Red line: TMAX Yellow line: TMIN Blue bars: Precipitation
 Max Temperature (red), Minimum Temperature (yellow), Precipitation (blue)
Bangalore : South part of India
Bangalore has a tropical savanna climate (Köppen climate classification Aw) with distinct wet and dry seasons. Due to its high elevation, Bangalore usually enjoys a more moderate climate throughout the year, although occasional heat waves can make summer somewhat uncomfortable. The climate station of Bangalore station IN009010100 (Bangalore).
- Average Maximum Temperature for Bangalore The Data for Maximum Temperature (TMAX) is available for the years from 1973 - 2015. The Graph Below is represent the mean average maximum temperature for all the available years(1973-2015)
 Average Maximum Temperature of Bangalore (Celsius)
Let's examine the percentage change from 1973 to 2015: The Graph below represents the average maximum temperature for Bangalore in the intervals of ten. In 1973 ,the TMAX was 27.8 Celsius and in 2015 it was 30.25.
 Average Maximum Temperature in intervals of 10
The percentage change of mean maximum temperature =( 30.25 - 27.8/30.25) * 100 = 8.09%. Let's examine the data distribution for maximum temperature for Bangalore Station : The histogram below represents the data distribution of max. temperature for Bangalore with 10 bins. Also, the red color line at 29.55 Celsius is the mean of overall data. The maximum distribution of data is around mean from 29.25 to 30.
 Histogram for BANGALORE(Data Distribution for max temperature)
- Average Minimum Temperature for Bangalore The Data for Minimum Temperature (TMIN) is available for the years from 1973 - 2015. The Graph Below is represents the mean average minimum temperature for all the available years (1973-2015).
 Average Minimum Temperature for Bangalore
Let's examine the percentage change from 1973 to 2015: The Graph below represents the average minimum temperature for Bangalore in the intervals of ten. In 1973, the TMIN was 18.48 Celsius and in 2015 it was 19.88.
 Average minimum temperature (in intervals of 10)
The percentage change of mean minimum temperature = 19.88 - 18.48/19.88 * 100 = 7.04%. Let's examine the data distribution for minimum temperature for Bangalore : The histogram below represents the data distribution of min. temperature for Bangalore with 10 bins. Also, the red color line at 19.01 Celsius is the mean of overall data. The maximum distribution of data is ON left side of mean from 19 to 19.5
 Histogram for Bangalore (Data Distribution for min temperature)
- Average Precipitation for Bangalore The Data for Precipitation (PRCP) is available for the years 1957 - 1962 , then from 1973 - 2015. The Graph Below is represents the mean average PRCP for all the available years (1957-1962,1973-2015).
 Average precipitation for Bangalore for all the years
Let's examine the percentage change from 1957 to 2015: The Graph below represents the average precipitation for Bangalore in the intervals of ten. In 1957, the PRCP was 23.47 and in 2015 it was 24.06.
 Average precipitation (years in the interval of 10)
The percentage change of precipitation = 24.06 - 23.47/24.06 * 100 = 2.45 %. Let's examine the data distribution for Precipitation for Bangalore: The histogram below represents the data distribution of precipitation for Bangalore with 10 bins. Also, the red color line at 23.64 is the mean of overall data. The maximum distribution of data is on the right side of mean from 23.5 to 24.
 Histogram for Bangalore (Data Distribution for precipitation)
In conclusion, The mean maximum average temperatures is about 29.55 Celsius, while the average minimums are 19.01 Celsius. Average precipitation is 23.64 cm. Below is the Concluding graph which represents TMAX, TMIN and PRCP together for Bangalore : Red line: TMAX Yellow line: TMIN Blue bars: Precipitation
 Max Temperature (red), Minimum Temperature (yellow), Precipitation (blue)
CHENNAI : South eastern coast of India
Chennai has a tropical wet and dry climate (Köppen: Aw). The city lies on the thermal equator and is also on the coast, which prevents extreme variation in seasonal temperature. Only Precipitation data available for Chennai from 1929 - 1966.
- Average Precipitation for Chennai
 Average precipitation for Chennai for all the years
Let's examine the percentage change from 1929 to 1966: The Graph below represents the Precipitation for Chennai in the intervals of ten. In 1929, the PRCP was 13.2 mm and in 1966 it was 10.4 mm.
Average precipitation (years in the interval of 10)
The percentage change of mean precipitation = 10.4 - 13.2/13.2 * 100 = -9.2 %. Let's examine the data distribution for Precipitation for Chennai: The histogram below represents the data distribution of precipitation for chennai with 10 bins. Also, the red color line at 22.496 is the mean of overall data. The maximum distribution of data is on the left side of mean from 15 to 20.5.
 Histogram for Chennai(Data Distribution for precipitation)
In conclusion, The average annual rainfall is about around 200 cm .
DELHI : North India
Analysis for data about Delhi have been presented thoroughly during week 02.
7 - Correlation
In correlation analysis, we estimate a sample correlation coefficient, more specifically the Pearson Product Moment correlation coefficient. The sample correlation coefficient, denoted r, ranges between -1 and +1 and quantifies the direction and strength of the linear association between the two variables. The correlation between two variables can be positive (i.e., higher levels of one variable are associated with higher levels of the other) or negative (i.e., higher levels of one variable are associated with lower levels of the other) [4].
The sign of the correlation coefficient indicates the direction of the association. The magnitude of the correlation coefficient indicates the strength of the association.
For example, a correlation of r = 0.9 suggests a strong, positive association between two variables, whereas a correlation of r = -0.2 suggest a weak, negative association. A correlation close to zero suggests no linear association between two continuous variables.
This week we did correlation for the features of Tmax, Tmin, PRCP, SNWD of Delhi from the GCD dataset with the following features from WB dataset:
- % Arable land
- % Agriculture land
- Cereal yield (per hectare)
- Forest area (sq. km.)
- Agriculture value added (% of GDP)
- CO2 emissions (metric tons per capita)
- Access to Electricity (% of population)
- Methane Emissions (% change)
We observe that some of the features are positively or negatively correlated, while some others we cannot really predict them. It is also important to understand that just because a correlation is shown positive or negative does not necessarily mean there is an actual correlation of features with physical meaning.
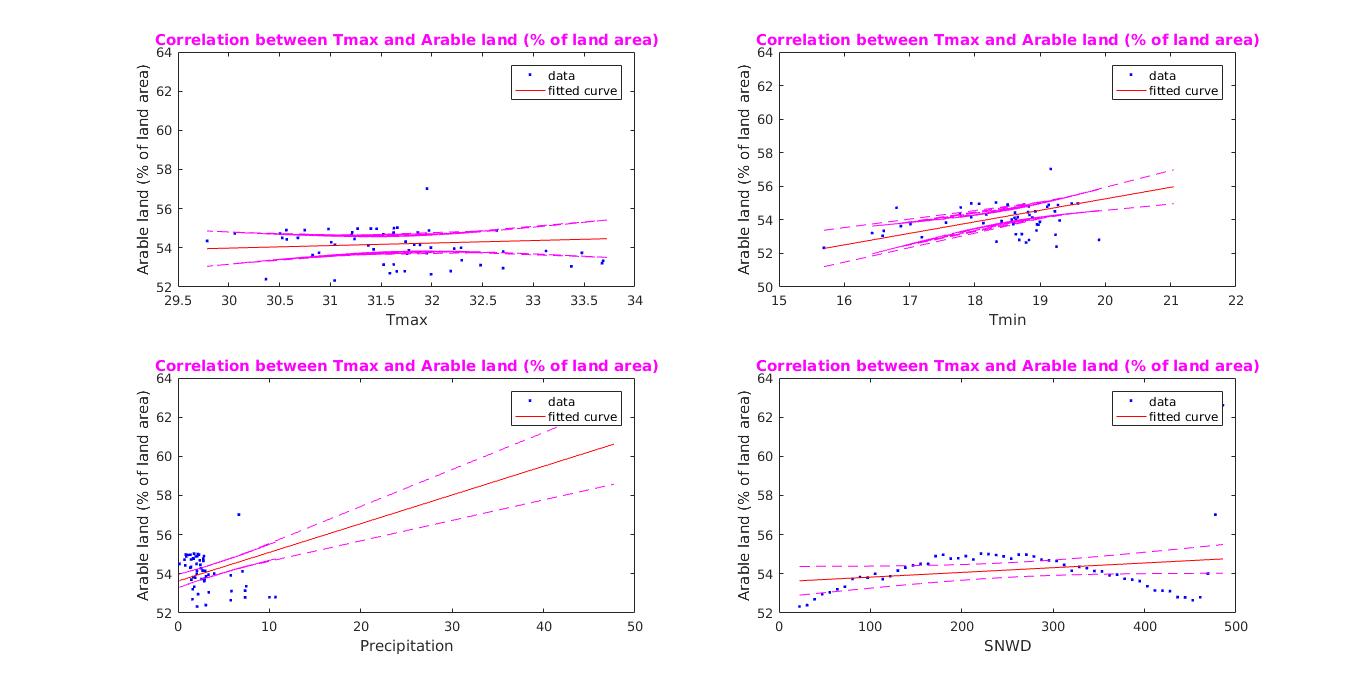 Correlation between % Arable land and Tmin, Tmax, PRCP, SNWD for Delhi (Arable land: land able to be plowed and used to grow crops)
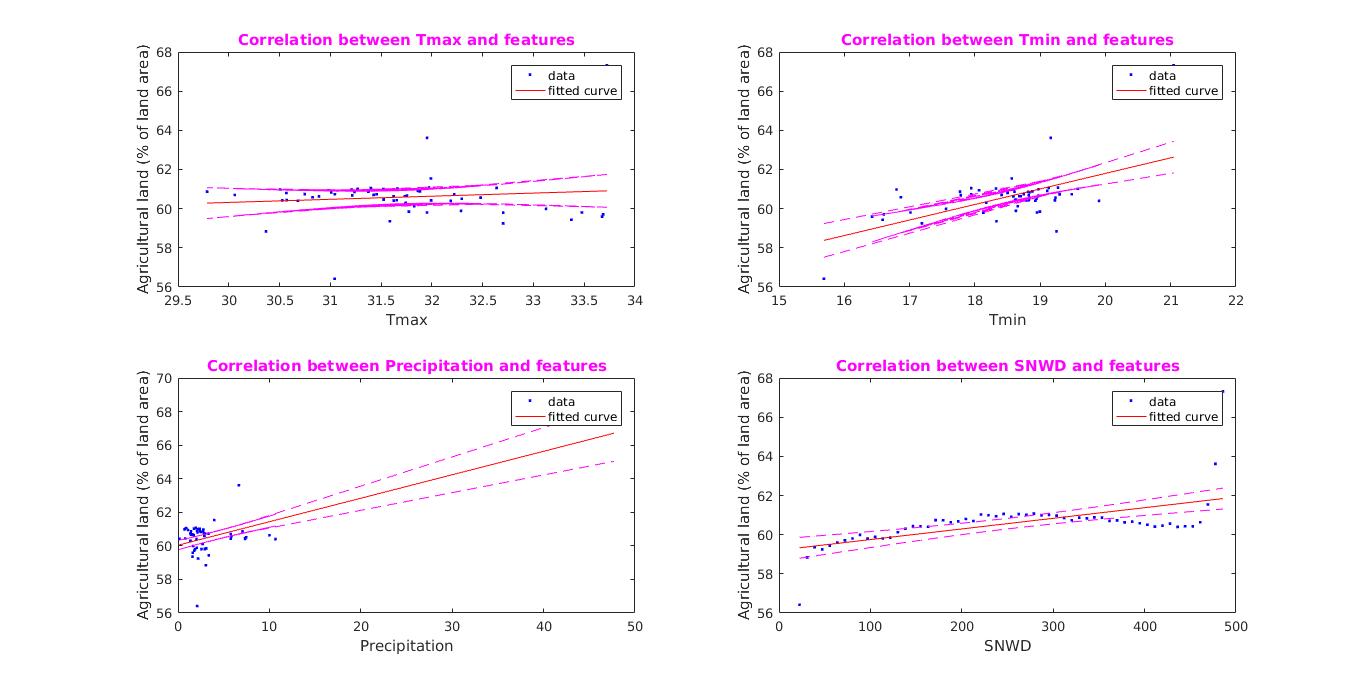 Correlation between % Agriculture land and Tmin, Tmax, PRCP, SNWD for Delhi
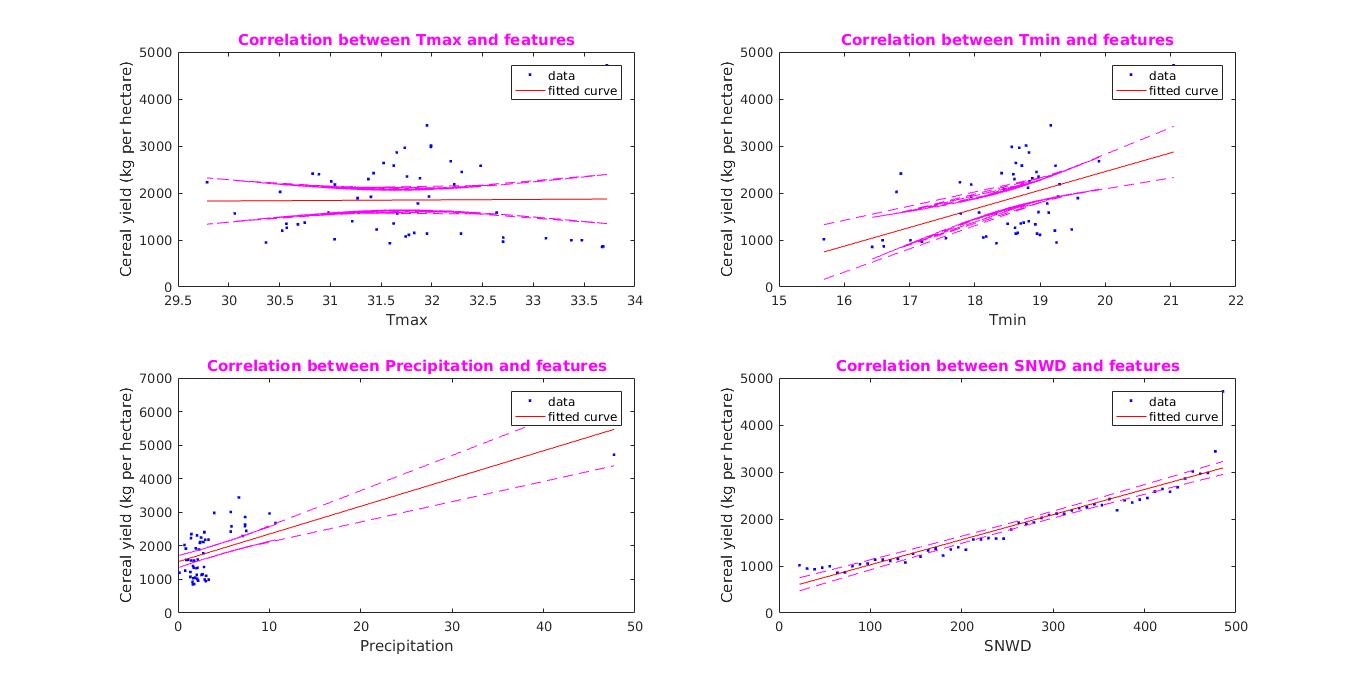 Correlation between Cereal yield (per hectare) and Tmin, Tmax, PRCP, SNWD for Delhi
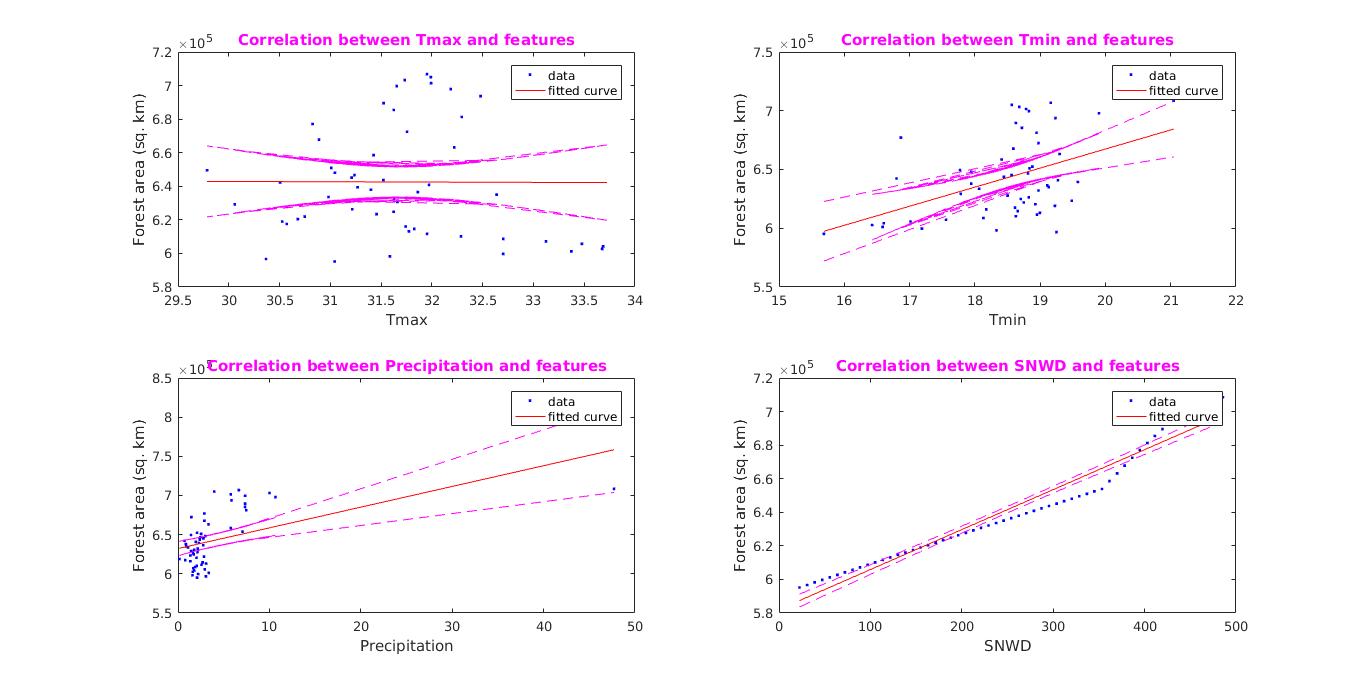 Correlation between Forest area (sq. km.) and Tmin, Tmax, PRCP, SNWD for Delhi
 Correlation between Agriculture value added (% of GDP) and Tmin, Tmax, PRCP, SNWD for Delhi
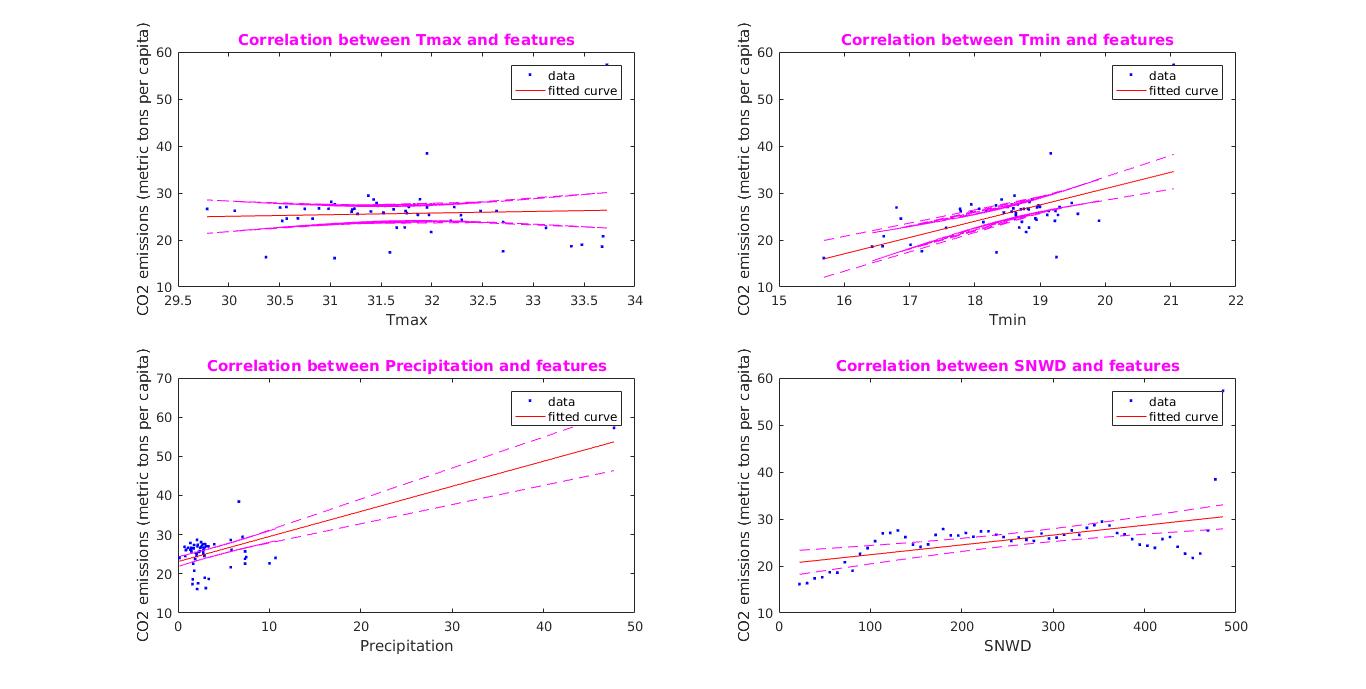 Correlation between CO2 emissions (metric tons per capita) and Tmin, Tmax, PRCP, SNWD for Delhi
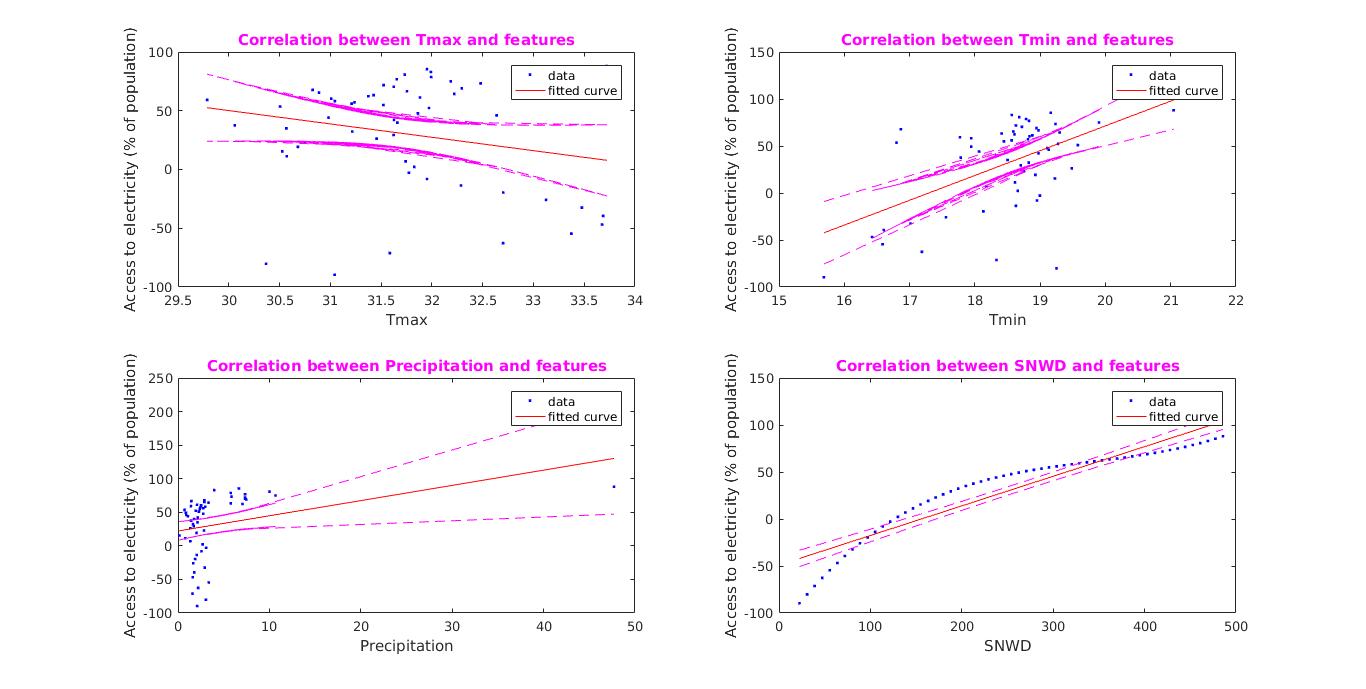 Correlation between Access to Electricity (% of population) and Tmin, Tmax, PRCP, SNWD for Delhi
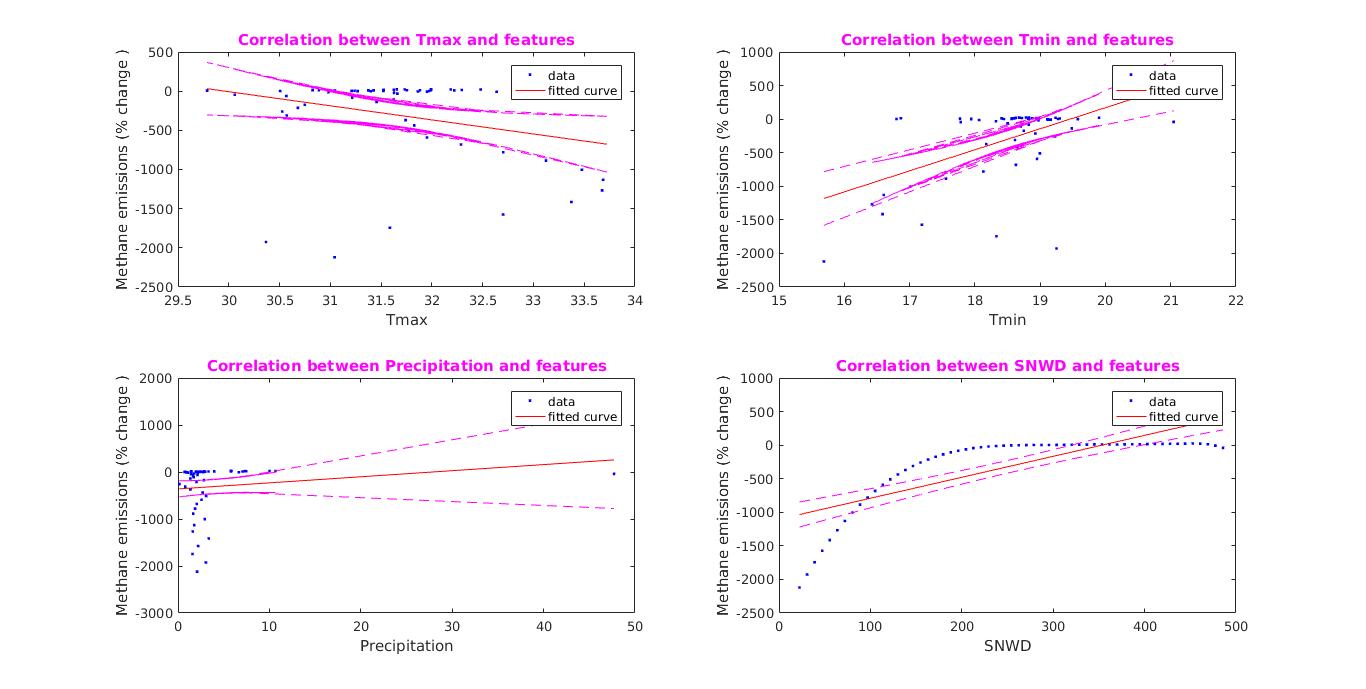 Correlation between Methane Emissions (% change) and Tmin, Tmax, PRCP, SNWD for Delhi
8 - Next Week Goals
- Do correlation for the rest of the features
- Attempt to create predictive models for data of both datasets
9 - Presentation Link
References
- Menne, M.J., I. Durre, R.S. Vose, B.E. Gleason, and T.G. Houston, 2012: An overview of the Global Historical Climatology Network-Daily Database. Journal of Atmospheric and Oceanic Technology, 29, 897-910, doi:10.1175/JTECH-D-11-00103.1.
- Menne, M.J., I. Durre, B. Korzeniewski, S. McNeal, K. Thomas, X. Yin, S. Anthony, R. Ray, R.S. Vose, B.E.Gleason, and T.G. Houston, 2012: Global Historical Climatology Network - Daily (GHCN-Daily), Version 3. [indicate subset used following decimal, e.g. Version 3.12]. NOAA National Climatic Data Center. http://doi.org/10.7289/V5D21VHZ
- http://data.worldbank.org
- http://sphweb.bumc.bu.edu/otlt/MPH-Modules/BS/BS704_Multivariable/BS704_Multivariable5.html