Week 01 (W46 Nov16) Crimes in the UK - Rostlab/DM_CS_WS_2016-17 GitHub Wiki
Week 01 (W46 Nov16) Crimes in the UK
Note: For unknown abbreviations and terms, please consider the glossary. If anything is missing, please just create an issue or write us an email and we will add it.
Content
- Dataset - General Information
- Results
- Ideas for Data Enrichment
- Working Log
- Plan for Next Week
- Sources
Dataset - General Information
Data Organization
The dataset is structured in 70 folders. Each folder represents the crime data for a single month of the respective year, broken down by territorial police force. The data range starts from december 2010 till September 2016 . Each folder comprises the following three types of data sets for each police force:
- Street-level crime
- Outcome
- Stop and search information
Data Description
- The total size of the data is around 13.2 GB.
- Format of the source files is csv.
- Number of attributes:
- Street: 12
- Outcome: 10
- Stop and search: 14
- Crimes (Street joined with Outcome): 15
- Number of rows:
- Street: 35,000,000
- Outcome: 17,623,000
- Stop and search: 584,000
- Crimes (Street joined with Outcome): 38,550,000
Results
This section represents descriptive statistics about each of the tables “Crimes” and “Stop and search” separately as well as information about further potential enrichment datasets. Salient properties will be highlighted with a different background colour to serve as a finding and a reference for the team in later stages of the course.
Data Quality with Respect to Outcome
- Crimes without outcome type: 20,765,000 (53.87%)
- Street without last_outcome_category: 18,535,000 (52.96%)
- S&S without outcome: 17,000 (3.07%)
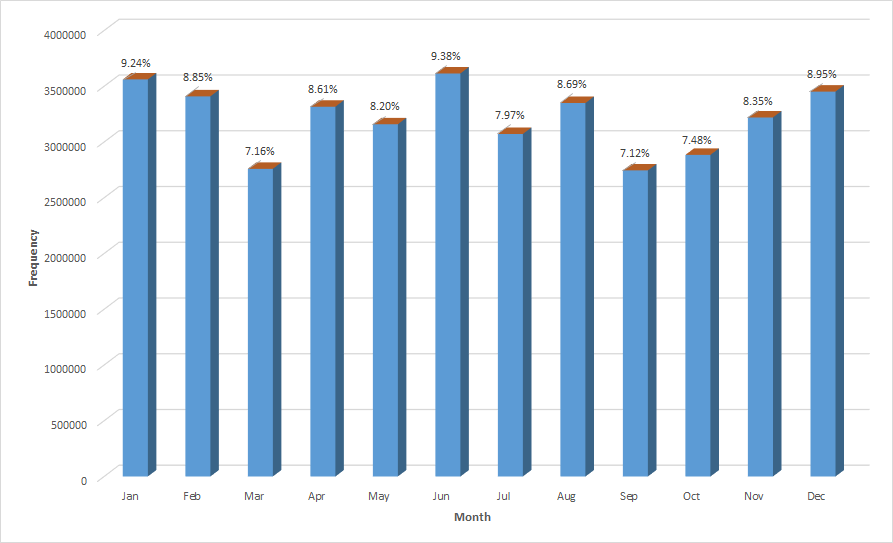
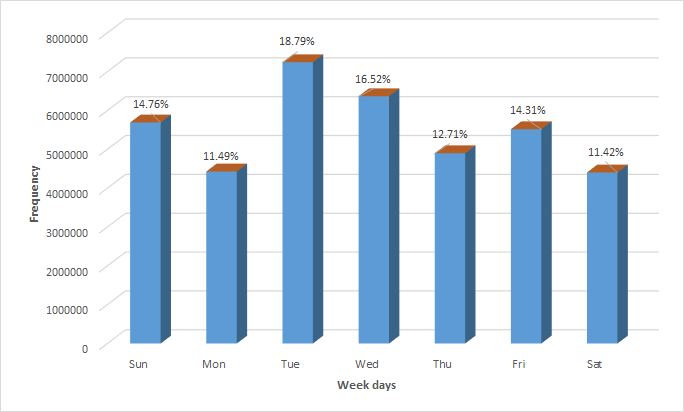
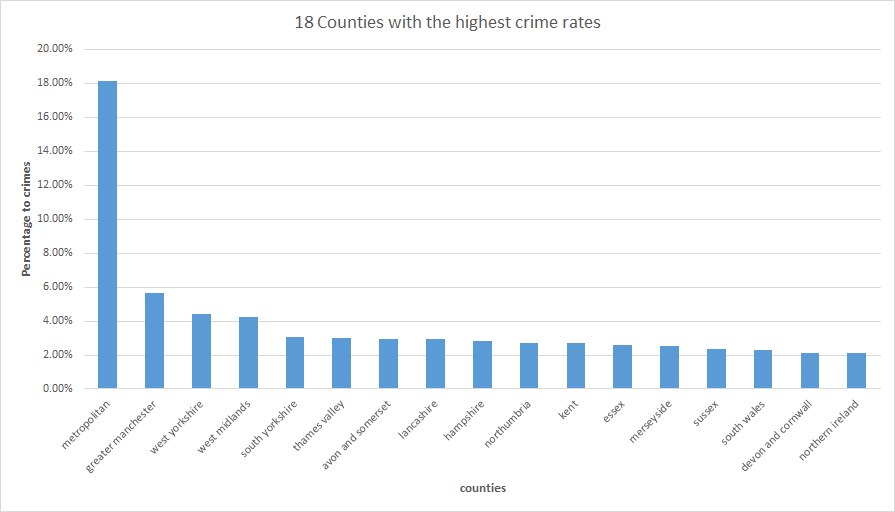
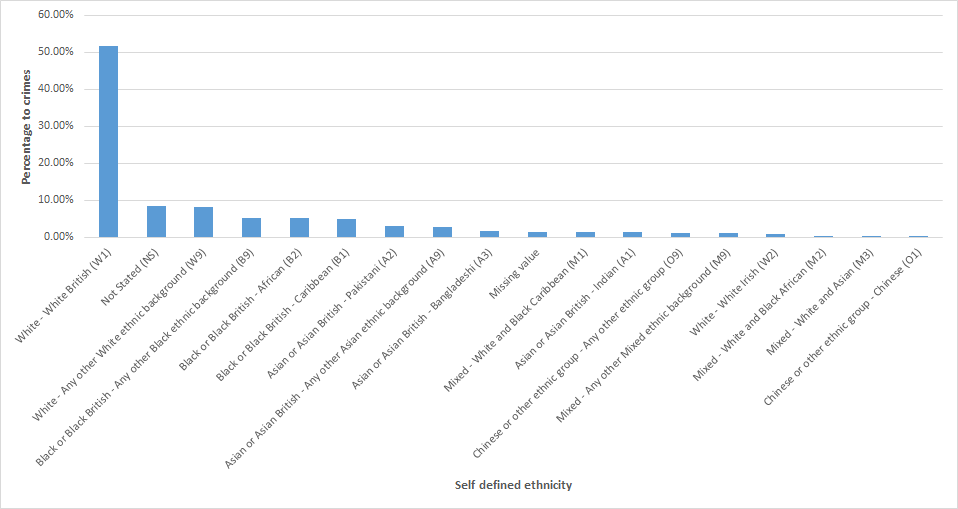
Crimes (Join of Outcome and streets)


![Crimes with outcome] (https://github.com/chaoran-chen/data-mining-lab-ws1617-crimes-in-uk/blob/master/wiki/week-01/images/2016_09_drugs_robbery_violence.png)
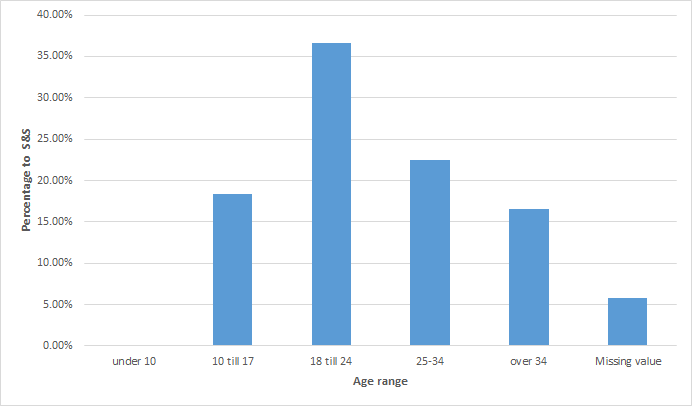
Stop and search

Ideas for Data Enrichment
- Neighborhood statistics using LSOAs: Lower Layer Super Output Areas (LSOA) is code given by the office of national statistics to represent a wide range of geographical areas in the UK. It is used for reporting of small area statistics. One LSOA is around 4 - 6 output area siwh a population of around 1500. This website provides the following statistics about LSOAs:
- Education attainment, enrolment to higher education, number of students
- Health and care
- People and Society: Income and lifestyle
- Work deprivation
- ...
- Points of Interest: The following website [3] provides datasets with different POIs in the UK like:
- ATM
- Attraction
- Bank
- Entertainment
- Food & Drink
- Holiday parks
- Transport
- …
- Weather data: A possible attribute to be considered would be the weather on the day of the crime. Here are some links to potential apis and data for historical weather reports[4]
Working Log
This section provides detailed information about the activities and tasks the team achieved this week in terms of our followed approach, faced challenges, implementation details, and justification for our decisions.
Reading row data into database
We wrote a python script for reading the row data from the files structure described above into MySQL database. We encountered a problem with the first version of the script while reading tuples with cells which includes quotation marks. As a result we lost about 20.000 tuples. However, we were able to solve this problem in the latest version of the script by escaping the quotation marks in the cells and were therefore able to read the full dataset into the database.
Problems with MySQL
We faced performance issues while executing SQL queries for statistical purposes in MySQL. Furthermore we were not able to join the two tables “Outcome” and “street” on MySQL. As a potential solution for this issue, we tried to access database systems on the student server but we didn’t have the rights to use them.
Join of Outcome and Street
Given the absolute similarity between the two tables “Street” and “Outcome”, we decided to join the two tables to conduct more informative, redundancy free, statistics. After failing to execute the join on our machines with MySQL, we decided to give it a try with another Database system: It finally worked with PostgreSQL.
Drawing samples and then throwing them away
After failing to execute SQL queries on the database in MySQL, which we needed for conducting the statistics, we decided to draw smaller dataset to work with. The first sample was for only 6 police forces, the second was for London, and the last was for Cleveland. After solving the db performance issues by working with PostgreSQL, we decided not to use those samples but the whole dataset in order to conduct more representative statistics.
Visualization Tools
We used the data visualization tool named Qlik Sense for plotting the geo data of the crimes on the map. For the other graphs we used R and Excel graphs.
Plan for Next Week
- Consolidate the final table
- Data cleansing and preparation
- Join “Crimes” and “Stop and search” datasets by aggregating information about the nearest “Stop and search” tuples located within a given range in km (not specified yet) from the respective crime
- Write the python script for finding the nearest Stop&Search tuples
- Further investigation of the possibility of including Neighborhood statistics using LSOAs in the final table
- Further investigation of the possibility of including Points of Interest (POI) information in the final table
Sources
[3] http://www.pocketgpsworld.com/tomtompoi.php
[4] http://www.metoffice.gov.uk/public/weather/climate-historic/#?tab=climateHistoric