Detection - RecycleAI/RecycleIT-A GitHub Wiki
1. Intersection Over Union
Intersection over Union (IoU) is a metric that quantifies the degree of overlap between two regions. IoU metric evaluates the correctness of a prediction. The value ranges from 0 to 1. With the help of IoU threshold value, we can decide whether a prediction is True Positive, False Positive, or False Negative.
IoU is useful through tresholding, that is, we need a threshold (α, say) and using this threshold we can decide if a detection is correct or not.
2. Confusion Matrix

In object detection, the correctness of the prediction (TP, FP, or FN) is decided with the help of IoU threshold. Whereas in image segmentation, it is decided by referencing the Ground Truth pixels. Ground truth meaning known objects.
Object detection predictions based on IoU
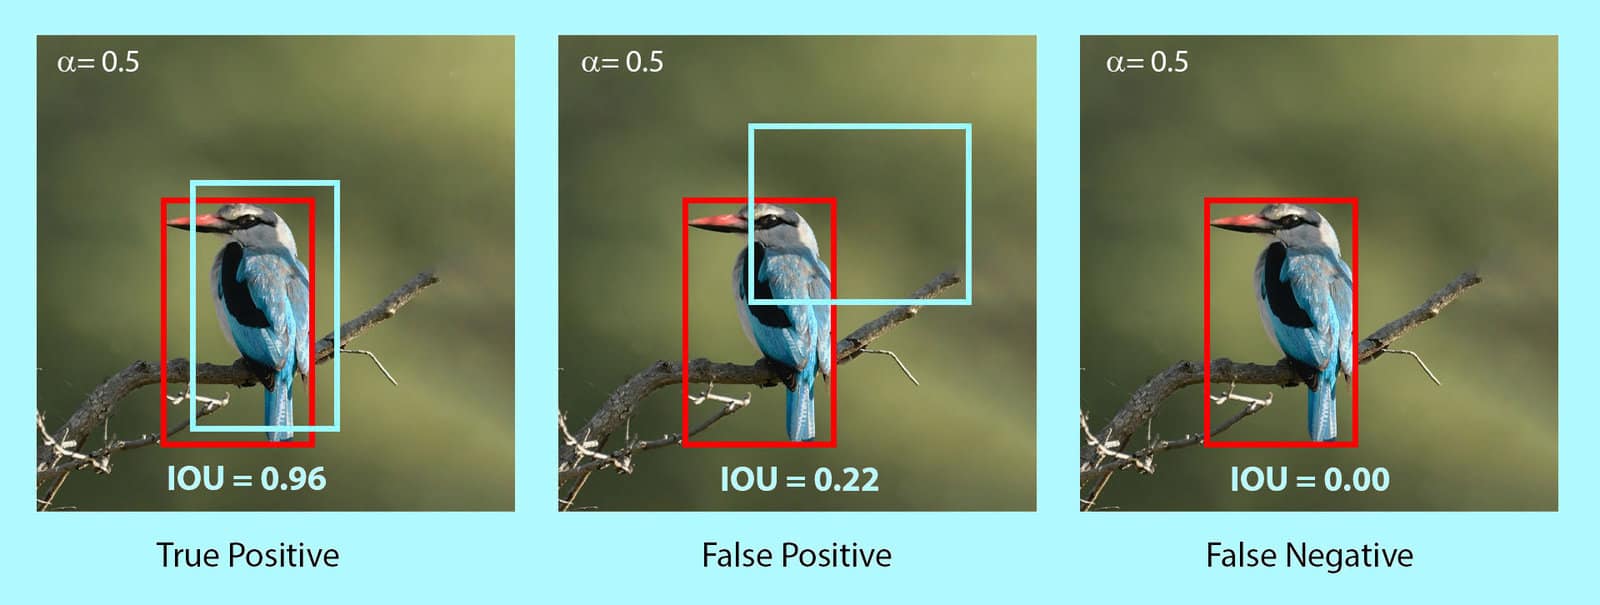
Image segmentation predictions based on Ground Truth Mask

3. Precision
P = TP/(TP + FP)
4. Recall
R = TP / (TP + FN)
5. Average Precision(AP)
it is the area under the precision-recall curve. APα means that AP precision is evaluated at α IoU theshold. AP is calculated individually for each class.
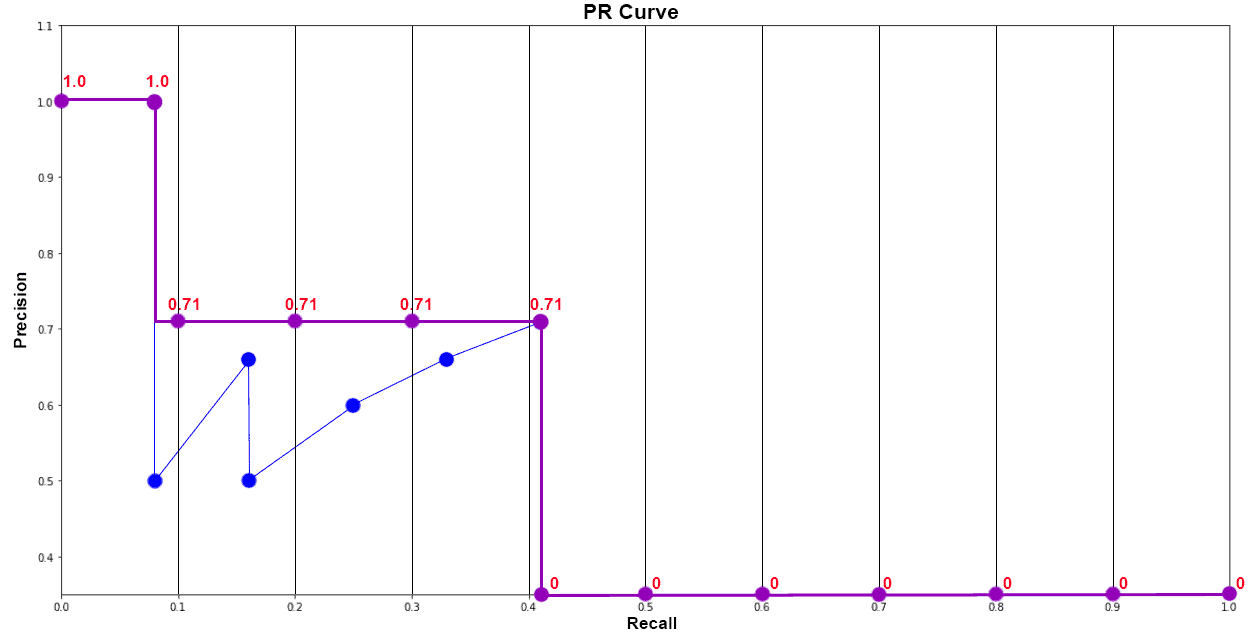
6. mAP Mean Average Precision or mAP is the average of AP over all detected classes.
mAP = 1/n * sum(AP), where n is the number of classes.
7. Average recall
Average recall (AR) is also a numerical metric that can be used to compare detector performance. In essence, AR is the recall averaged over all IoU ∈ [0.5, 1.0] and can be computed as two times the area under the recall-IoU curve:
AR = 2∫recall(o)do ,where o is IoU
8. Mean average recall
Mean average recall is defined as the mean of AR across all K classes.
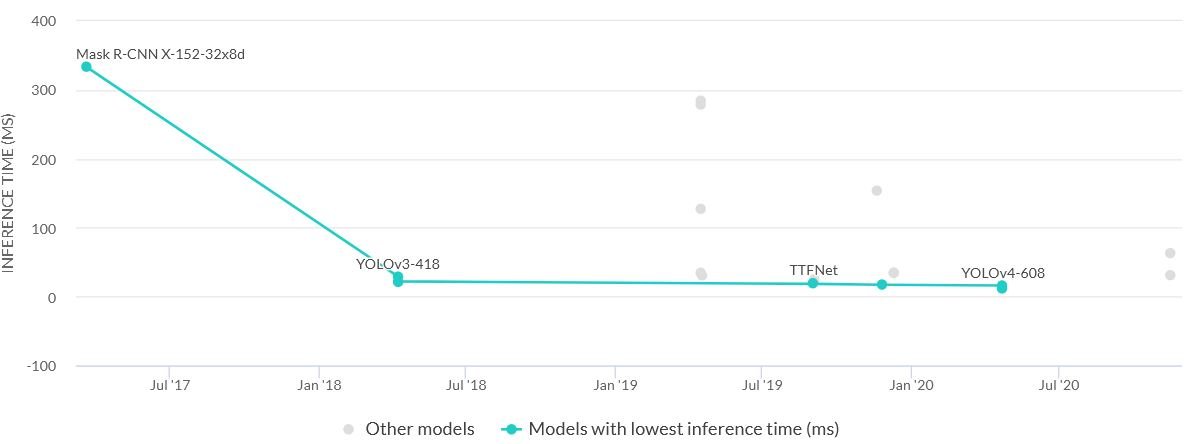
9. Inference Time
The inference time is how long is takes for a forward propagation. To get the number of Frames per Second, we divide 1/inference time.
The state-of-the-art object detection methods can be categorized into two main types: One-stage vs. two-stage object detectors. n general, deep learning based object detectors extract features from the input image or video frame.
An object detector solves two subsequent tasks:
-
Find an arbitrary number of objects (possibly even zero).
-
Classify every single object and estimate its size with a bounding box.
1. Two-stage detectors
- The two-stage architecture involves (1) object region proposal with conventional Computer Vision methods or deep networks, followed by (2) object classification based on features extracted from the proposed region with bounding-box regression.
- Two-stage methods achieve the highest detection accuracy but are typically slower. Because of the many inference steps per image, the performance (frames per second) is not as good as one-stage detectors.
- Various two-stage detectors include region convolutional neural network (RCNN), with evolutions Faster R-CNN or Mask R-CNN. The latest evolution is the granulated RCNN (G-RCNN)
2. One-stage detectors
- One-stage object detectors prioritize inference speed and are super fast but not as good at recognizing irregularly shaped objects or a group of small objects.
- The most popular one-stage detectors include the YOLO, SSD, and RetinaNet. The latest real-time detectors are YOLOv4-Scaled (2020) and YOLOR (2021). View the benchmark comparisons below.
- The main advantage of single-stage is that those algorithms are generally faster than multi-stage detectors and structurally simpler.
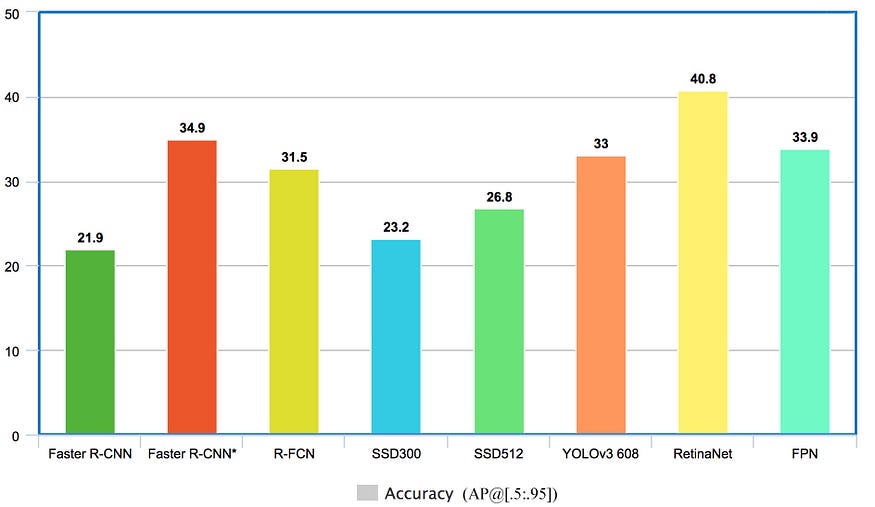
3. Comparison above different types of detection algorithms Frames per second

Accuracy
Models with lowest inference time
Models with hieghest MAP
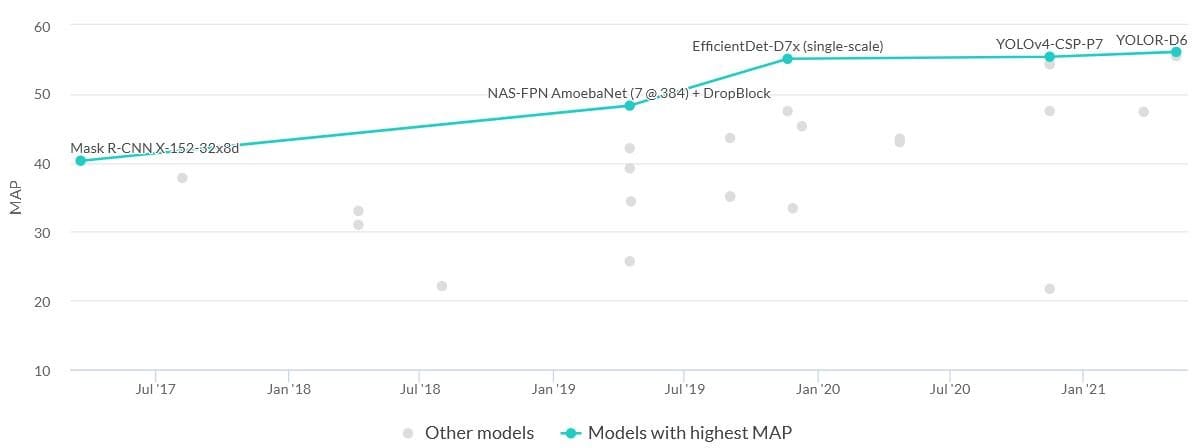
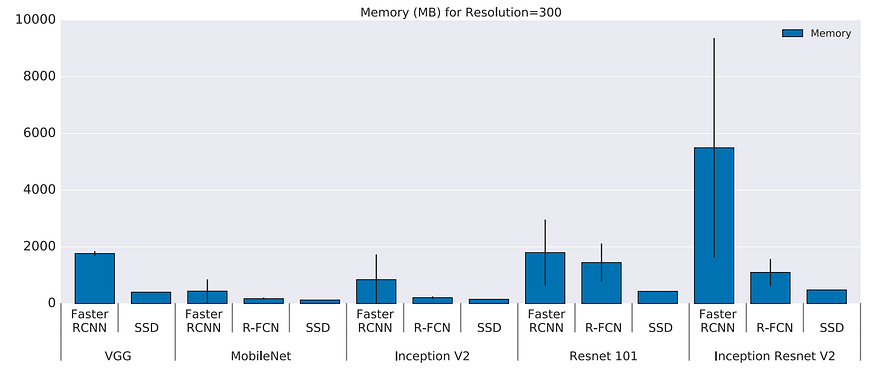
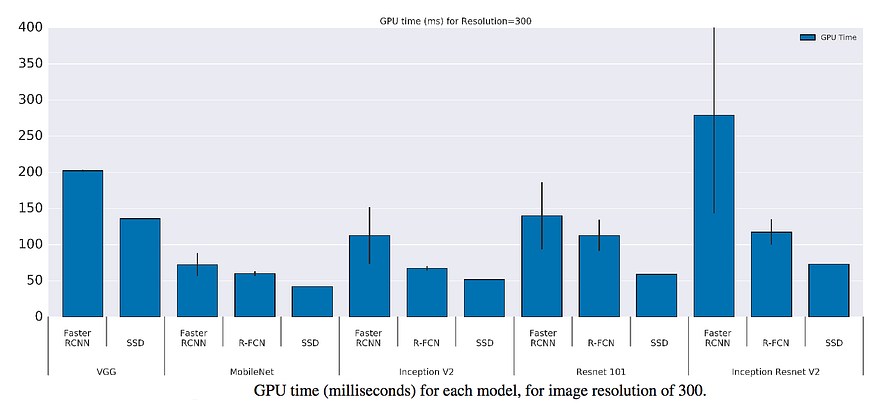
Comparison of two-stage and one-stage detection models
Memory usage
GPU time
by https://github.com/WongKinYiu
| Model | Test Size | APtest | AP50test | AP75test | batch 1 fps | batch 32 average time |
|---|---|---|---|---|---|---|
| YOLOv7 | 640 | 51.4% | 69.7% | 55.9% | 161 fps | 2.8 ms |
| YOLOv7-X | 640 | 53.1% | 71.2% | 57.8% | 114 fps | 4.3 ms |
| YOLOv7-W6 | 1280 | 54.9% | 72.6% | 60.1% | 84 fps | 7.6 ms |
| YOLOv7-E6 | 1280 | 56.0% | 73.5% | 61.2% | 56 fps | 12.3 ms |
| YOLOv7-D6 | 1280 | 56.6% | 74.0% | 61.8% | 44 fps | 15.0 ms |
| YOLOv7-E6E | 1280 | 56.8% | 74.4% | 62.1% | 36 fps | 18.7 ms |
| Model | size (pixels) |
mAPval 0.5:0.95 |
mAPval 0.5 |
Speed CPU b1 (ms) |
Speed V100 b1 (ms) |
Speed V100 b32 (ms) |
params (M) |
FLOPs @640 (B) |
|---|---|---|---|---|---|---|---|---|
| YOLOv5n | 640 | 28.0 | 45.7 | 45 | 6.3 | 0.6 | 1.9 | 4.5 |
| YOLOv5s | 640 | 37.4 | 56.8 | 98 | 6.4 | 0.9 | 7.2 | 16.5 |
| YOLOv5m | 640 | 45.4 | 64.1 | 224 | 8.2 | 1.7 | 21.2 | 49.0 |
| YOLOv5l | 640 | 49.0 | 67.3 | 430 | 10.1 | 2.7 | 46.5 | 109.1 |
| YOLOv5x | 640 | 50.7 | 68.9 | 766 | 12.1 | 4.8 | 86.7 | 205.7 |
| YOLOv5n6 | 1280 | 36.0 | 54.4 | 153 | 8.1 | 2.1 | 3.2 | 4.6 |
| YOLOv5s6 | 1280 | 44.8 | 63.7 | 385 | 8.2 | 3.6 | 12.6 | 16.8 |
| YOLOv5m6 | 1280 | 51.3 | 69.3 | 887 | 11.1 | 6.8 | 35.7 | 50.0 |
| YOLOv5l6 | 1280 | 53.7 | 71.3 | 1784 | 15.8 | 10.5 | 76.8 | 111.4 |
|
YOLOv5x6 + [TTA][TTA] |
1280 1536 |
55.0 55.8 |
72.7 72.7 |
3136 - |
26.2 - |
19.4 - |
140.7 - |
209.8 - |
| Model | Test Size | APval | AP50val | AP75val | APSval | APMval | APLval | FLOPs | weights | batch1 throughput |
|---|---|---|---|---|---|---|---|---|---|---|
| YOLOR-P6 | 1280 | 52.5% | 70.6% | 57.4% | 37.4% | 57.3% | 65.2% | 326G | yolor-p6.pt | 76 fps |
| YOLOR-W6 | 1280 | 54.0% | 72.1% | 59.1% | 38.1% | 58.8% | 67.0% | 454G | yolor-w6.pt | 66 fps |
| YOLOR-E6 | 1280 | 54.6% | 72.5% | 59.8% | 39.9% | 59.0% | 67.9% | 684G | yolor-e6.pt | 45 fps |
| YOLOR-D6 | 1280 | 55.4% | 73.5% | 60.6% | 40.4% | 60.1% | 68.7% | 937G | yolor-d6.pt | 34 fps |
| YOLOR-S | 640 | 40.7% | 59.8% | 44.2% | 24.3% | 45.7% | 53.6% | 21G | ||
| YOLOR-SDWT | 640 | 40.6% | 59.4% | 43.8% | 23.4% | 45.8% | 53.4% | 21G | ||
| YOLOR-S2DWT | 640 | 39.9% | 58.7% | 43.3% | 21.7% | 44.9% | 53.4% | 20G | ||
| YOLOR-S3S2D | 640 | 39.3% | 58.2% | 42.4% | 21.3% | 44.6% | 52.6% | 18G | ||
| YOLOR-S3DWT | 640 | 39.4% | 58.3% | 42.5% | 21.7% | 44.3% | 53.0% | 18G | ||
| YOLOR-S4S2D | 640 | 36.9% | 55.3% | 39.7% | 18.1% | 41.9% | 50.4% | 16G | weights | |
| YOLOR-S4DWT | 640 | 37.0% | 55.3% | 39.9% | 18.4% | 41.9% | 51.0% | 16G | weights | |
Yolov7 and Yolov5 labels should be in text format and images should be in jpg format.