Visualizer Wow and Flutter - QuantAsylum/QA40x GitHub Wiki
The Wow and Flutter Visualizer is accessible from the Visualizer menu. The visualizer helps to understand frequency modulation present on the signal. Most have experienced this as Wow and Flutter, which is a common measurement for turntables and tape equipment. With a turntable, if the spindle hole on the record isn't precisely located at the center of the pressing, the result will be slight changes in RPM, which will manifest as pitch changes. Motor drive issues can also cause similar issues. On tape machines, if drive capstans are out of round a similar problem occurs.
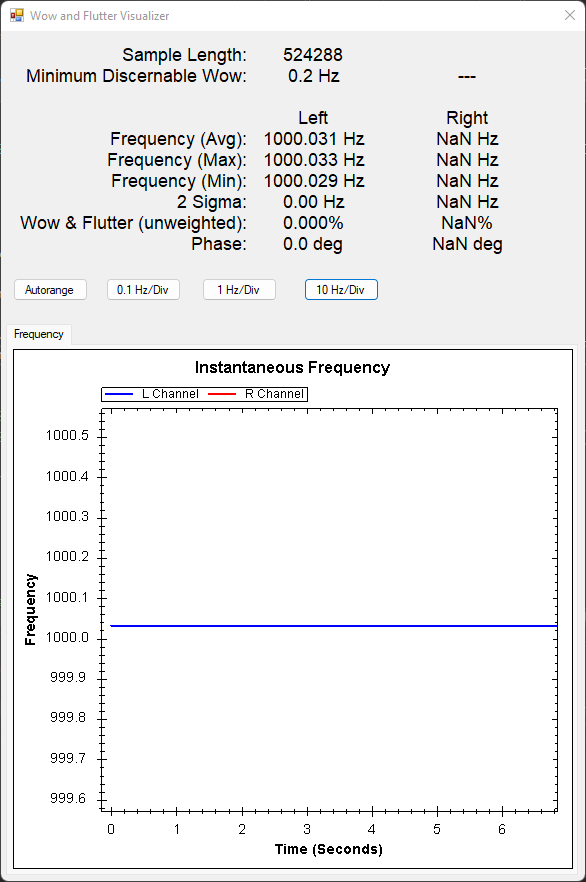
A plot of the visualizer is shown below. This is a measurement taken in loopback on the QA403 hardware, and as we'd expect the cycle-to-cycle variation in frequency is non-existent and at the limits of the algorithm. The algorithm used by the visualizer interpolates zero crossings of every cycle to determine the precise frequency of each cycle. Statistics are kept on the results, allowing average, minimum, maximum and 2-sigma to be determined.
Some things to keep in mind: Stronger signals will allow better zero crossing to estimated. Having the attenuator switched off will help there too. Longer FFTs will also give more data for the algorithm to work with, improving the results.
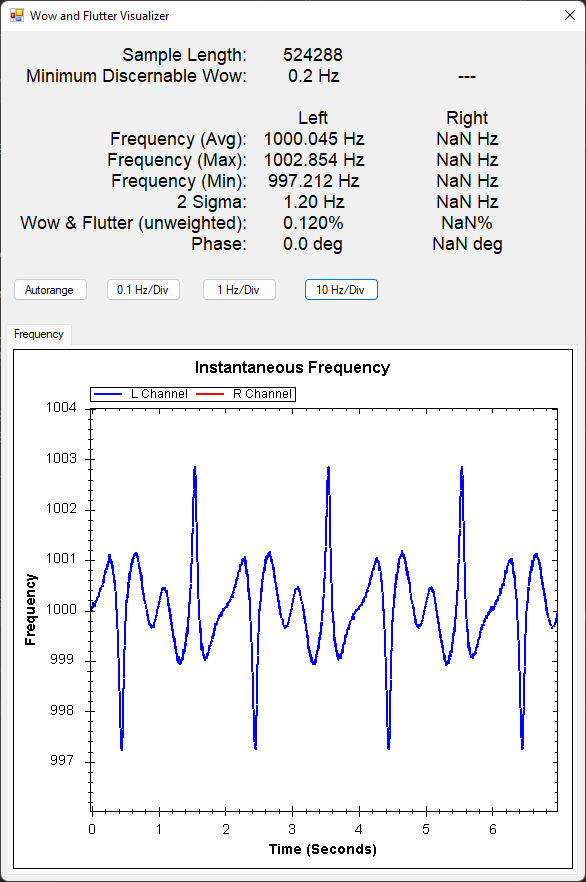
Many guitar effects processors modulate the signal to make it appear more rich. For example, a vibrato effect with a modulation frequency of 0.5 Hz yields the following on a 1 kHz signal:
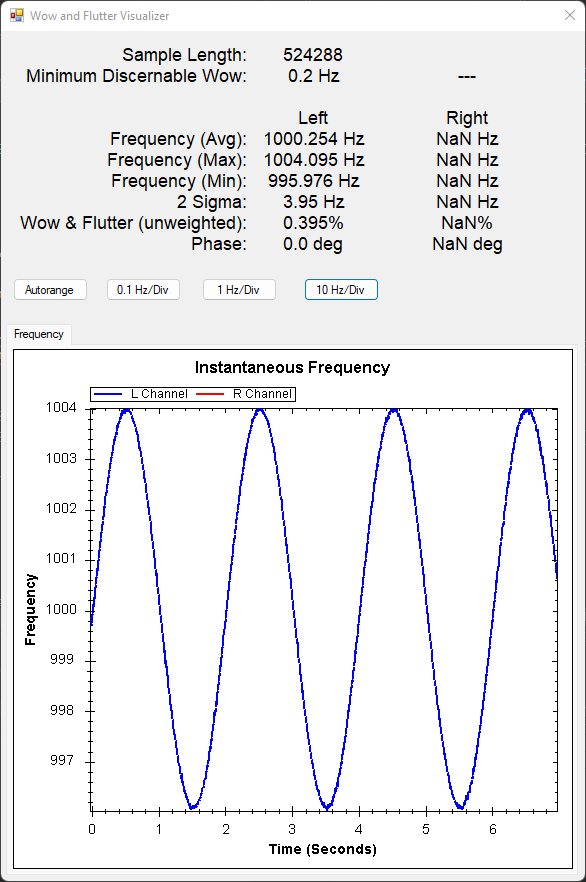
A chorus effect yields the following:
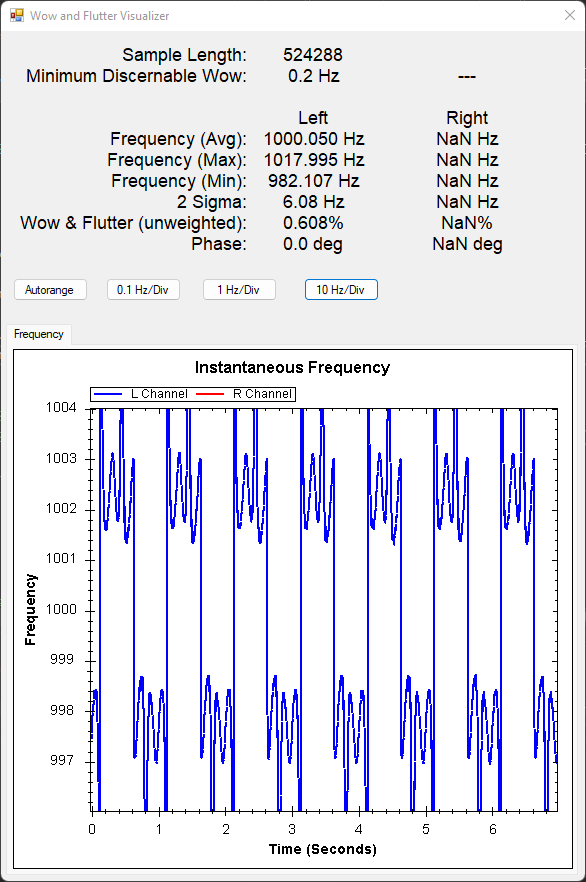
A flange effect yields the following: