THD Bargraph Display - QuantAsylum/QA40x GitHub Wiki
The THD Bargraph Display is available from the "Visualizers" menu. This visualizer makes it easy to see just the harmonic content of the signal you are analyzing. The plot below is from a Valeton GP-200 guitar effect. From the plot, we can see the summary bar graph agrees with the markers on the spectrum plot.
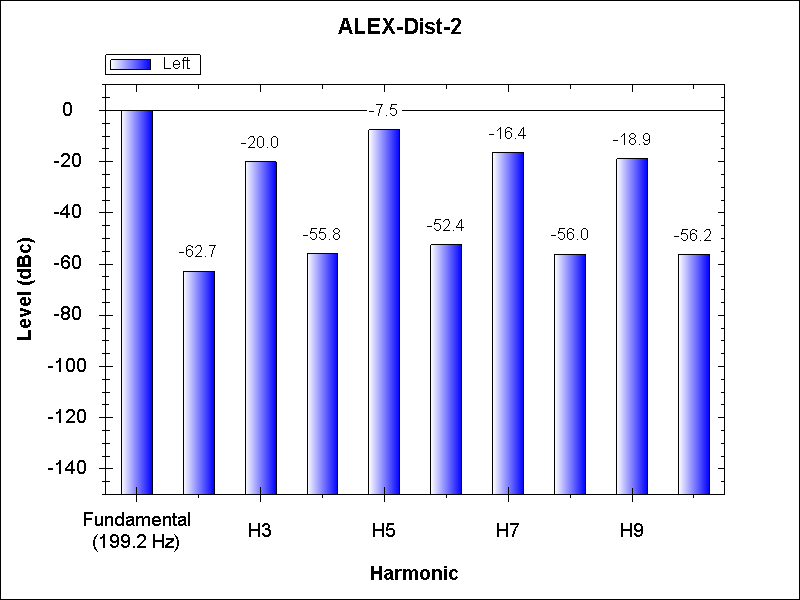

Note that you can select to display left or right channels, or both. But the left channel signal must be present for the visualizer to make the correct determination of the fundamental frequency.