SPKR Chirp Compression - QuantAsylum/QA40x GitHub Wiki
The SPKR Chirp Compression plug-in will subject the speaker DUT to a range of chirps at increasing levels. The resulting graph makes it easy to determine where the compression begins in terms of SPL. There are two types of speakers to consider. The first is a standalone speaker that is driven by an a separate amplifier. The second is a powered speaker, which is a speaker with an integrated amplifier.
The integrated amp + speaker are getting smarter and smarter, and there's often a DSP inside the box (before the amp) to make sure the speaker isn't overdriven. What this means is that instead of the speaker getting to a point where it begins to fail or tear itself apart mechanically, the DSP will instead simply compress the signal to ensure the speaker is protected.
A compression curve for a single frequency typically appears as follows:
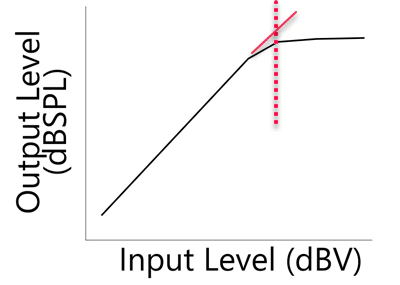
Normally, when the input is increased by 1 dB, then the output also increases by 1 dB. But as you hit the compression "knee", things change and an extra dB of input will result in a smaller output increase. Eventually, you get to he point where the DSP is acting as a hard limiter, and no matter how much you increase the input level, the output level remains the same.
Test Setup for Measuring Compression
The plot above shows compression for a single frequency. Other frequencies might have a different response. Instead of using a single tone to look at compression, we can use a chirp and look across the entire audio band in a brief sweep.
Take a look at the test setup below. In this setup, the QA401's left + output is going into the powered speaker. This speaker can be just about any power level you might anticipate, with the caveat that the max output level on the QA401 is about +6dBV (the QA402 and QA403 max output is +18 dBV).
The QA470 captures the sweep from a measurement mic, gains that up 20 dB, and then sends that to the QA401's left channel + input. The - input is shorted to reduce the noise of the un-needed input.
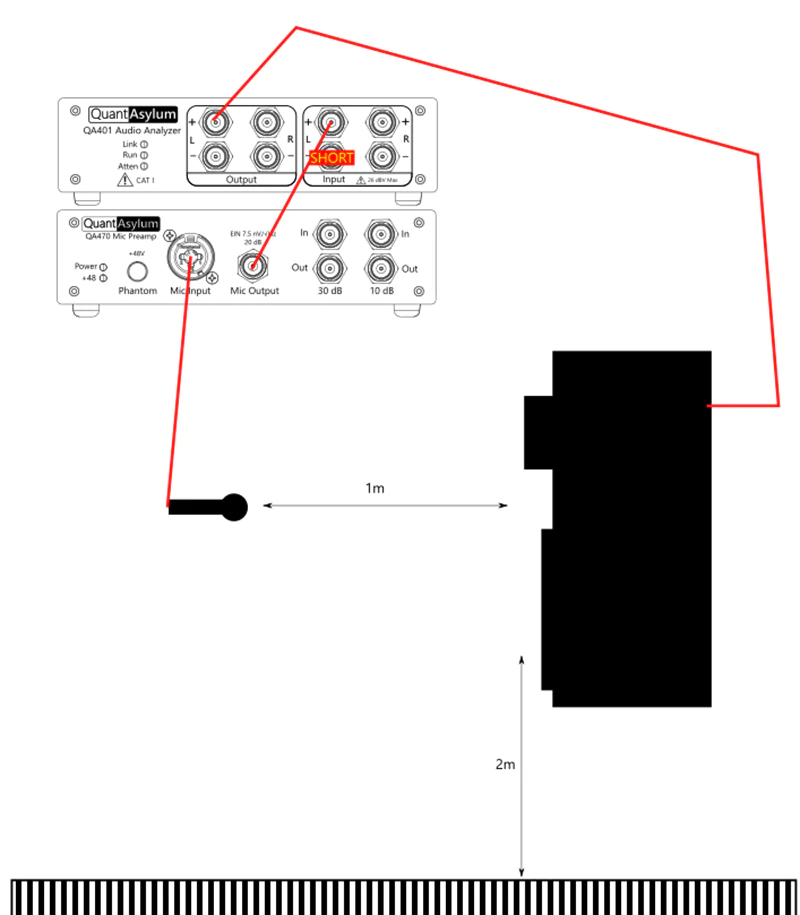
The microphone should be a measurement microphone--one for which you have a calibration curve ideally. Note above that distances are specified. The mic should be 1m from the center of the speaker (split between speaker and driver). And the speaker should be located about 2m off the ground. This will give a distance for the first reflection off the ground of about 4.1 meters. Since sound travels about 2.9 mS per meter, this means the direct path will take about 2.9 mS and the ground reflection will arrive about 4.1 * 2.9 = 11.9 mS, so 11.9 mS - 2.9 mS = 9 milliseconds after the direct path has arrived. Similarly, clear out everything within 2 meters of the setup (desks, chairs, etc) and make sure the ceiling is at least 2 m from the top of the speaker. This arrangement should let you measure reasonably well down to about 100 Hz and the clearances involved should be easy to achieve in a high-bay storage area. If you'd like your math checked here, just drop us a line and we can help.
The purpose for the above is because we're going window the impulse response that we measure. This was discussed in more detail at the link HERE. For now, just be sure you have ensured there are no reflectors for about 2 m all the way around of your setup (including floor and ceiling). If you can ensure this, you'll have a very repeatable set of measurements that can be made days apart.
In the QA40x application (version 1.149 or later), the plug-in appears on the Automated Tests menu as shown below:
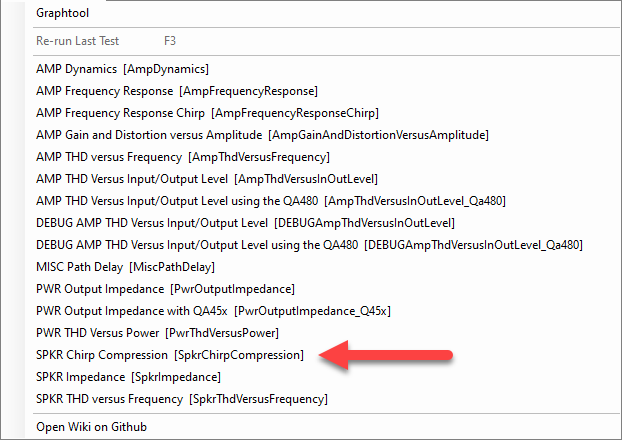
Select the plug-in and you'll be greeted by the following:
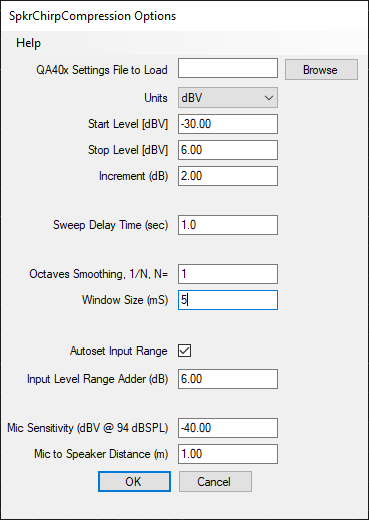
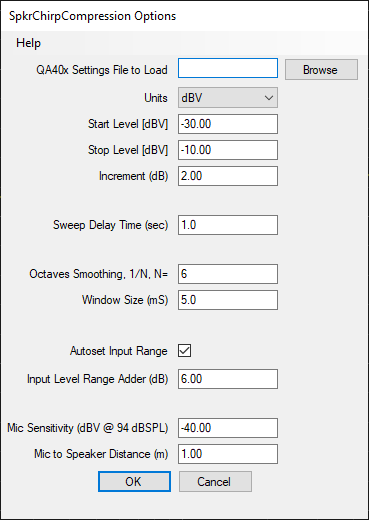
The settings for this plug-in are as follows:
The Start Level, Stop Level and Increment determine the steps in output you want to the QA401 to make. Be careful here, because if you specify too large of values you might overstress the speaker. Understand that line-level equipment is around 0 dBV. So, a level of -15 dBV is well below line level. But don't start too big. Sneak up on the where you want to be until you are familiar with the equipment. As shown above, the QA40x will output a sweep at -30 dBV, then another at -28 dBV, then another at -26 dBV, and it will repeat until it emits the final sweep at -6 dBV. Start small and work your way up, especially if you are using an amp that much more powerful than the speaker.
The Sweep Delay Time parameter is the amount of time the plug-in will "rest" between sweeps. Primarily this is anticipation of your sweeps being done in a very "live" room (such as a warehouse) and you want to allow time for the reverberations to die away before starting the next sweep. Generally 1-2 seconds will work well.
The Octaves Smoothing is the denominator of the smoothing interval. For example, 6 means 1/6th octave smoothing. Small numbers (eg 1) will give overly smoothed results, and large numbers will give (eg 96) will give no smoothing at all.
The Window Size is determined by the amount of space we have around the setup. For the setup used to generate the data in this post, 5 mS was used. This should give good confidence with the low-end response down to about 200 Hz. Because of this, you'll see the low-end truncated at 200 Hz in the plots below.
The Autoset Input Range checkbox will automatically adjust the full scale input level if requested. When checked, before the measurement is run a measurement will be made and the gain of the system will be be determined. And then, the full scale input will will be automatically adjusted to ensure the incoming signal is at least the specified level (in the Input Level Adder (dB) field.
The Mic Sensitivty is about -40 dBV at 94 dBSPL. This is provided by the manufacturer. We did NOT use a calibrated mic on this measurement. But if we did, we'd use the 1 kHz figure that came with the calibration certificate and we'd also load a user-weighting of the calibration file before we ran the plug-in.
Finally, the distance between the mic and speaker is set to 1m in the Mic to Speaker Distance (m) field. This will adjust the plotted SPL level. 1m of distance will result in no adjustment to the plotted data. If you specify 2m, the plotted data will increase by 6 dB to account for the increased distance. The plug-in applies a far-field correction factor of 6 dB per doubling if distance.
By knowing the above, we can readily compute dBSPL. We know that the mic produces -40 dBV for a 94dBSPL signal. That is gained up to 20 dBV by the QA470. We can then add (94 + 20) = 114 dB to the measurement to get the level in dBSPL. The gain of any mic preamp is set in the "input gain" section of the dBV context menu (right click on the dBV button in the Axis control group on the main screen).
This is the benefit of using no-cal equipment with fixed, known gains (QA470 and QA401) that don't have gain adjustment knobs.
MEASUREMENT RESULT
The speaker tested was an Alto TS112A. This is an 800W speaker with a 12" low frequency speaker and a 1" driver and a passive crossover. The maximum dBSPL at 1m is rated for 125 dB peak and 122 dB continuous. The measured plot is shown below. We'll dissect the key regions of operation in more detail below.
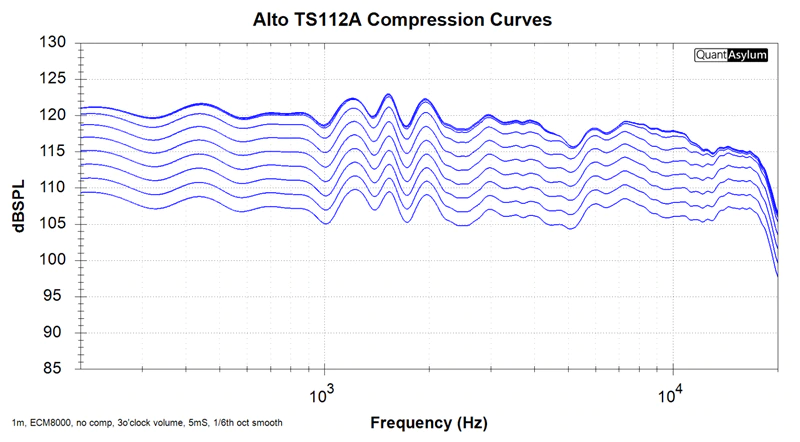
This plot was made with an uncalibrated Behringer ECM8000 microphone 1m away from the cabinet, with the cabinet volume at 3 o'clock, 5 mS windowing and 1/6th octave smoothing.
The settings used are shown below:
There are 11 sweeps plotted. The first sweep went out at -30 dBV, and that resulted in an amplitude of 105 dBSPL at 1 kHz. The next weeks went out at -28 dBV, and that resulted in an amplitude of 107 dBSPL. This continues until we get to about 118 dBSPL: There we can see the last 3 chirps are all bunched up together even though they were at different levels. This is close to the manufacturer's spec of 122 dBSP, but it could be argued that it's too optimistic--without a calibrated mic it's hard to be certain. However, the test repros very well, and being able to replicate it in an untreated space is huge.
While a calibrated mic won't have much difference at 1 kHz, it would address the rolloff between 10 k and 20 k as these mics generally have 5 to 7 dB of rolloff between 15 and 20 kHz.The Dayton EMM6 will be used for a subsequent post.
Digging In
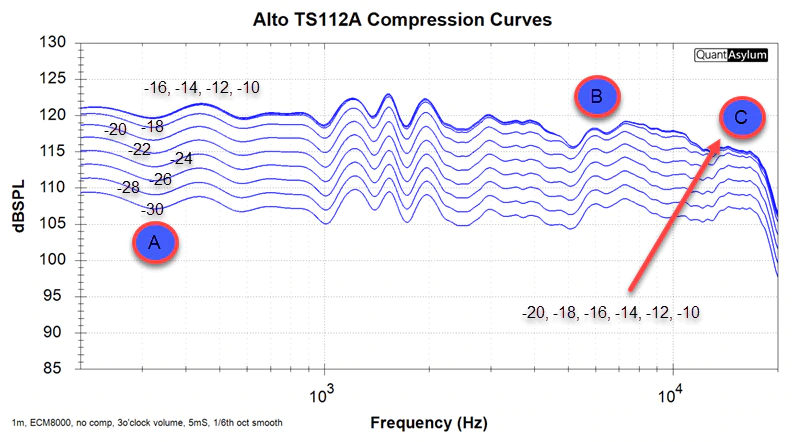
Below is the same plot with some annotations attached. In region A, you can see that the difference between the -30 and -28 dBV curve is 2 dBSPL. The curves there are 2 dB apart. But notice at the low end the difference between -18 dBV of input and -10 dB of input is just 1 dB. The amp/speaker combo is deep into compression at this point. From 100 Hz to 1 kHz, this speaker will not get louder than about 120 dBSPL no matter how hard you hit it.
While region A shows 7 unique traces and 4 bunched traces, region B shows just 6 unique traces and 5 bunched traces. And region C shows just 5 unique traces. What does this mean?
This says the amp/speaker combo aren't going into compression uniformly across the band. At higher frequencies, the combo goes into compression sooner.
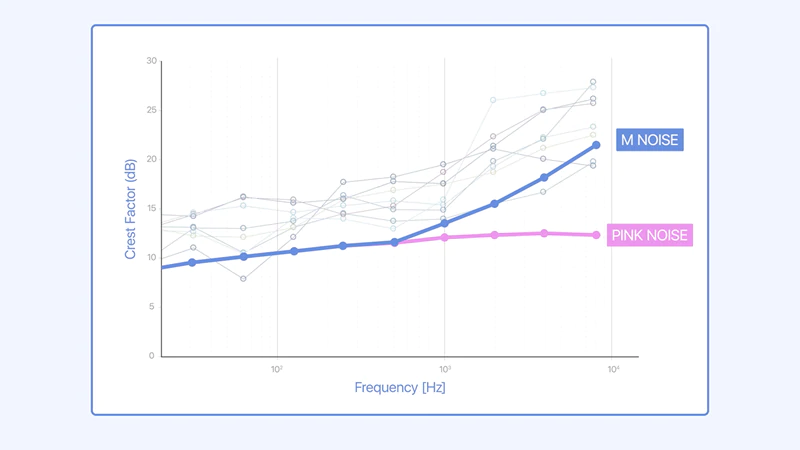
The upshot of this gets even more interesting. When playing music, you need headroom. How much headroom depends on the type of music you are playing. Meyer Sound has shared some graphs with the industry of the crest factor (headroom) they believe is needed for live sound. Their conclusion is that the crest factor depends on the frequency. At 1 kHz you might want 12 dB of headroom, and at 10 kHz you might want 18 dB. In other words, you need a lot more headroom at higher frequencies than lower frequencies. And if you don't have it, the result will look like an shelving EQ is being engaged at the high-end of the spectrum during loud passages.
So, if you are looking for a high quality live-sound listening experience, your RMS output should be about 15 dB below your max output at 10 kHz. If you speakers can hit 120 dB at 10 kHz with just slight compression, then, your RMS should be about 105 dB out of the speaker at 1 meter.
Since sound falls off about 6 dB per doubling of distance, a person sitting 8m/24 feet (18 dB) from the speaker would experience an RMS level around 105 - 16 = 89 dB for a person standing 24 feet from the speaker.
Watch the Mic!
Most active mics will have an acoustic overload point (AOP) of around 130 dBSPL. If you want to know where you mic hits its overload point, then move the mic directly in front of the speaker on the cabinet. The move from 1m to nearly contacting the grill will increase the level into the mic by about 40 dB. This will let you see where the mics overload as the mics will exhibit their own curve compression.
If you are using a dynamic mic (such as SM57) then the overload point of that mic will be far beyond 130 dB and you won't need a pre-amp either.
Keep in mind that if the mic delivers -40 dBV at 94 dBSPL, then at 130 dBSPL you are approaching 0 dBV out of the mic. With the +20 dB gain from the mic preamp, that's nearly 20 dBV out of the mic preamp. Know where your mic preamp clips! Most mics cannot handle this and will need to be moved back (and reflection times adjusted), or a lesser pre-amp gain should be used.
The key is that you need to be aware of the signal chain limits.
Summary
Whether you are designing new speakers, or renting powered cabs and need to verify the performance after a rental comes back, you needn't be in the dark as to whether or not your gear is performing as expected or not.