Filter Explorer - QuantAsylum/QA40x GitHub Wiki
The Filter Explorer Visualizer makes it easy to measure filter characteristics, and is available from the Visualizers menu.
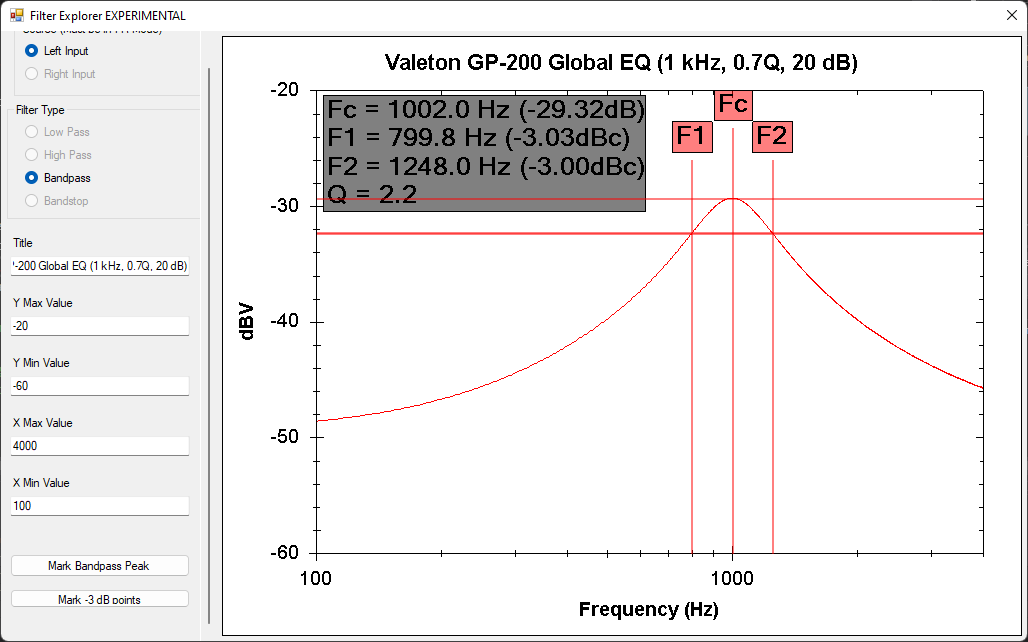
In the plot below, a bandpass filter Q, gain and center frequency are measured.
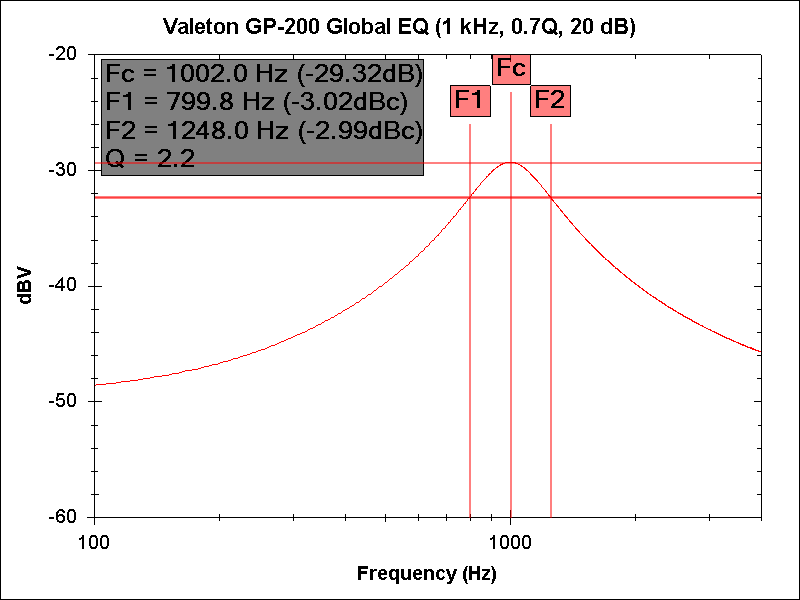
The bandpass measurement provides two buttons--the first to mark the bandpass peak, and the second to mark the -3 dB points. Additionally, the graph title can be set, as well as X and Y limits.