In Depth Tutorial - Progradius/PhytoController GitHub Wiki
For this tutorial I will assume that you have no prior knowledge on the subject and I will go through each step in details to help you in your journey.
If you have no experience with electricity I recommend that you don’t dive in this project right away, first seek help and knowledge about basic electrical stuff.
This project is handling high voltages to drive outlets through the relay board, if not handled correctly, you can shock yourself or destroy the equipment wired to it. Therefore you will understand why I’m cautious, so please do the same ^^
In any case, remember that this open source project, as per the license, is provided as it, without guaranty or service.
This project allows you to log data from sensors and to control four outlets, two in daily timer mode, and two in cyclic timer mode.
Another outlet is reserved for a centrifugal motor, and his speed is driven relative to the temperature sensor.
You can also access a web ui, offering you an easy way to configure the ESP32 settings.
The ESP32 handle sending data from sensors, timers and motor logic as well as its own web API.
The distant host machine, which can be whatever you want, handles the influx database and the grafana web application (and later the web front-end).
More features are planned such as DLI and VPD calculation, automatic light/canopy height adjustment, UV supplementation …
- An ESP32
Recommended model WROOM-32E (works also with older version)
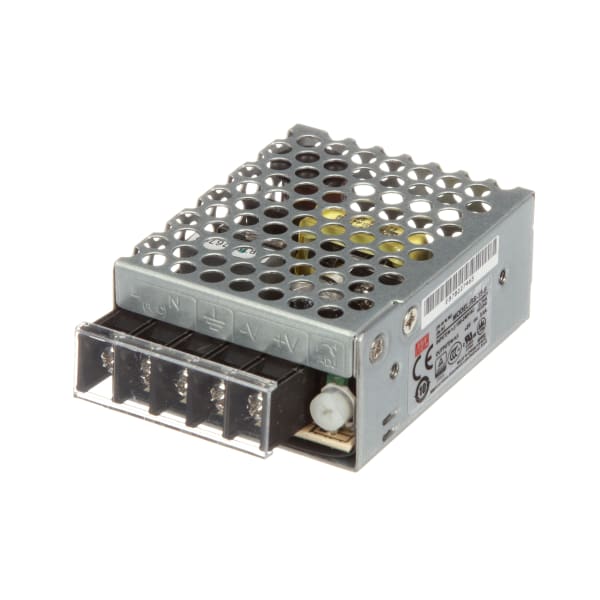
- A DC-5v power supply with at least 2a current
Recommended model Meanwell RS15-5 (works also with a USB power brick)
- Dupont Wire
At least 30 wires are required, my setup is use female/female wires, but yours may be different.
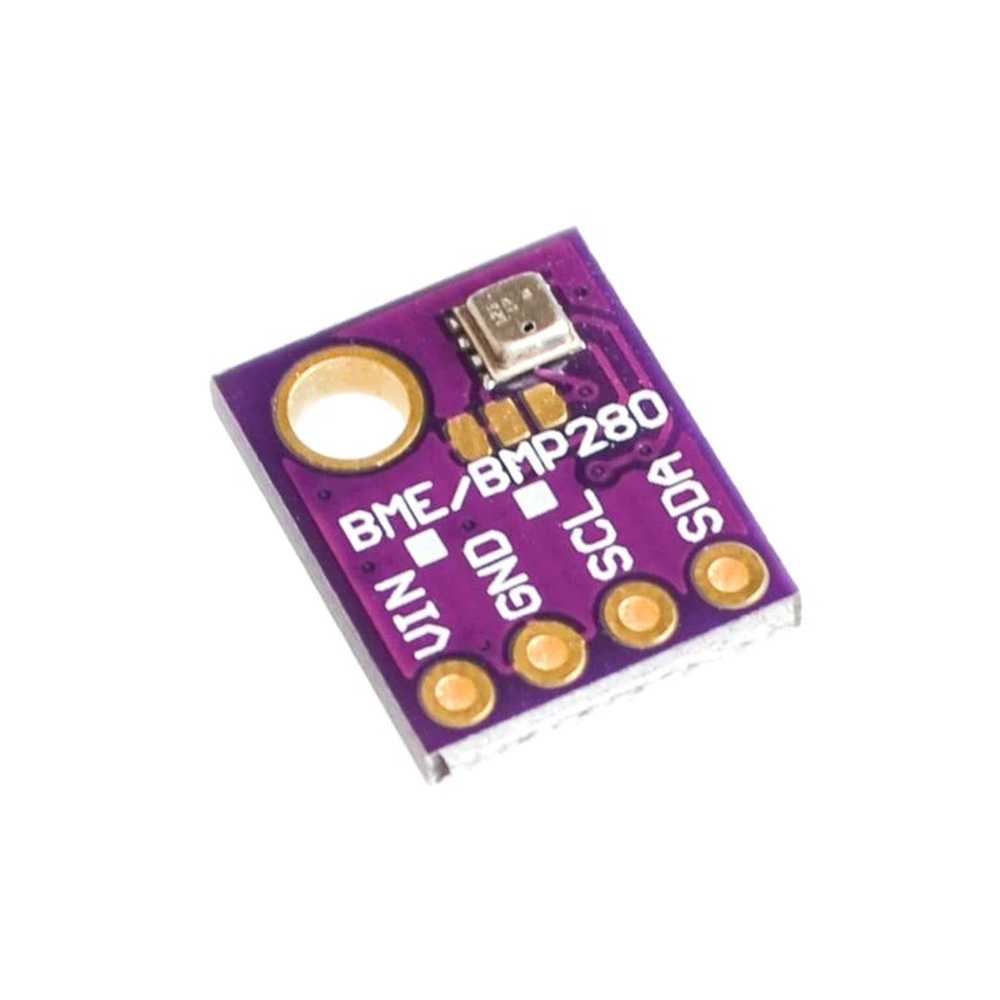
- BME280
Recommended : a breakout board in 3.3v
- DS18B20 x3
Recommended : the waterproof version
- TSL2591
Recommended : a breakout board in 3.3v
- VEML6075
Recommended : a breakout board in 3.3v
- HCSR04
The host machine can be anything, your laptop, desktop, homelab, pi zero … Choose it to your liking.
Install the following packages on host machine
(Raspberry Pi based example, see your OS documentation for more accurate information)
Like before, you’ll need to add the influx’s key and repository, then you’ll install it and activate it’s service
1 - Add the APT key used to authenticate packages:
wget -qO- https://repos.influxdata.com/influxdb.key | sudo apt-key add -
source /etc/os-release
2 - Add the Influxdb APT repository:
echo "deb https://repos.influxdata.com/debian $(lsb_release -cs) stable" | sudo tee /etc/apt/sources.list.d/influxdb.list3 - Install Influxdb:
sudo apt update && sudo apt install -y influxdb4 - Enable and start Influxdb service:
sudo systemctl enable influxdb.service
sudo systemctl start influxdb.service
The next step now that influx is installed, is to create a database and a user with the all the rights on it. Don’t forget your credentials and the database’s name, you’ll need them in a moment!
5 - Use the CLI by entering influx and create a database and a user:
create database <databasename>
use <databasename>
create user <username> with password '<password>' with all privileges
grant all privileges on home to grafana
You can access influxb's database on port 8086 (will be used to link grafana to influx)

You first need to add the grafana apt key and repository to the system, then you will install the grafana package and activate it’s service
1 - Add the APT key used to authenticate packages:
wget -q -O - https://packages.grafana.com/gpg.key | sudo apt-key add -2 - Add the Grafana APT repository:
echo "deb https://packages.grafana.com/oss/deb stable main" | sudo tee -a /etc/apt/sources.list.d/grafana.list3 - Install Grafana:
sudo apt-get update && sudo apt-get install -y grafana4 - Enable and start Grafana service:
sudo systemctl enable grafana-server
sudo systemctl start grafana-server
Grafana is now reachable on http://localhost:3000 with the login admin:admin
With the previously created database and credentials, use the official Documentation to add a datasource to Grafana: Documentation
ampy is a python tool enabling you to communicate with the microcontroller using the serial port.
Install ampy following the official documentation for your chosen OS: Documentation
1 - Flash micropython firmware on your ESP32
- Check micropython's documentation and flash a firmware built with ESP-IDF v3.x
- ESP32-Documentation
- Micropython for Generic ESP32 Module
2 - Clone the PhytoController repository on the host machine
git clone https://github.com/progradius/PhytoController.git3 - cd into the newly created directory
cd PhytoController/ 4 - Open param.json and configure it:
Detailed Breakdown of param.json
- Enter your wifi credentials
- Enter your influxdb credentials
- Check the defaults GPIO pins and modify them to fit your board if necessary
- Enable the sensors that you possess by setting their fields to "enabled" (in initial configuration, only the DS18B20 is active.)
5 - Wire the components: Wiring diagrams to be written WARNING! Be careful with sensor voltage while wiring it, some of them exist in 5v or 3.3v versions.
Order yours wisely (3.3v version should be preferred when available) and wire them properly).
Respect the chosen GPIO set in param.json, relays board are handling high voltages so please be extra careful.
6 - Connect the ESP32 to the host machine
7 - Use ampy to upload the project's files:
ampy --port /dev/ttyUSB0 put boot.py
ampy --port /dev/ttyUSB0 put main.py
ampy --port /dev/ttyUSB0 put function.py
ampy --port /dev/ttyUSB0 put param.json
ampy --port /dev/ttyUSB0 put controller
ampy --port /dev/ttyUSB0 put model
ampy --port /dev/ttyUSB0 put lib
8 – Reboot.
The ESP32 will start logging data right after boot, you can observe it’s behavior by accessing the REPL


.png/1200px-Raspberry_Pi_3_B%2B_(39906369025).png)