Conditional formatting - Profitbase/PowerBI-visuals-FinancialReportingMatrix GitHub Wiki
available from v8.3.x
Apply formatting to column headers:
Add conditional formatting, and select "Apply to" Column headers. Then select the condition, and select the formatting.
Color scales:
In "Formatting type", select "Color scale" and which type of scale:
Diverging lets you pick two colors, and a number of ranges:
Sequential lets you pick a number of color ranges and a color palette. Then select where the formatting should be applied; Font or Background:
available from v8.2.x
Using Row Options as conditions:
The conditions field has new options where you can chose to apply a formatting to cells based on selected row options:
Improved formatting
available from v8.1
Youtube tutorial:

New conditional formatting pane and options:
You can now name the step, so it's easier to find the correct formatting step, should you want to alter it. "Apply to" will show which measure or column this is applied to. Column Hierarchy levels will decide where the formatting should be applied: values, totals or both. Conditions are more flexible than before. You can also add additional conditions.
Appyly style has been updated.
Selecting "Default" will allow you to chose the normal custom1 to custom 6.
By selecting "Custom" you are free to format as you please:
You can apply conditional formatting to Value columns from the data model, subtotal columns, and custom columns by right-clicking their headers and choosing “Add conditional formatting”.
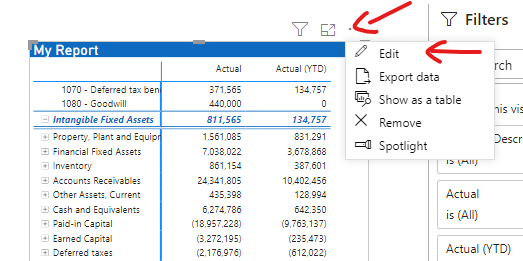
To apply conditional formatting to a column, perform the following 3 steps:
- Ensure you are in edit mode.
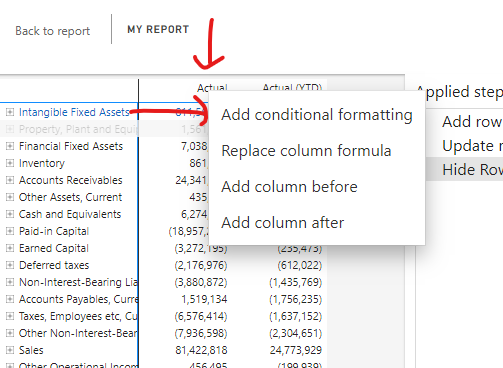
- Right-click the column header and choose “Add conditional formatting”.
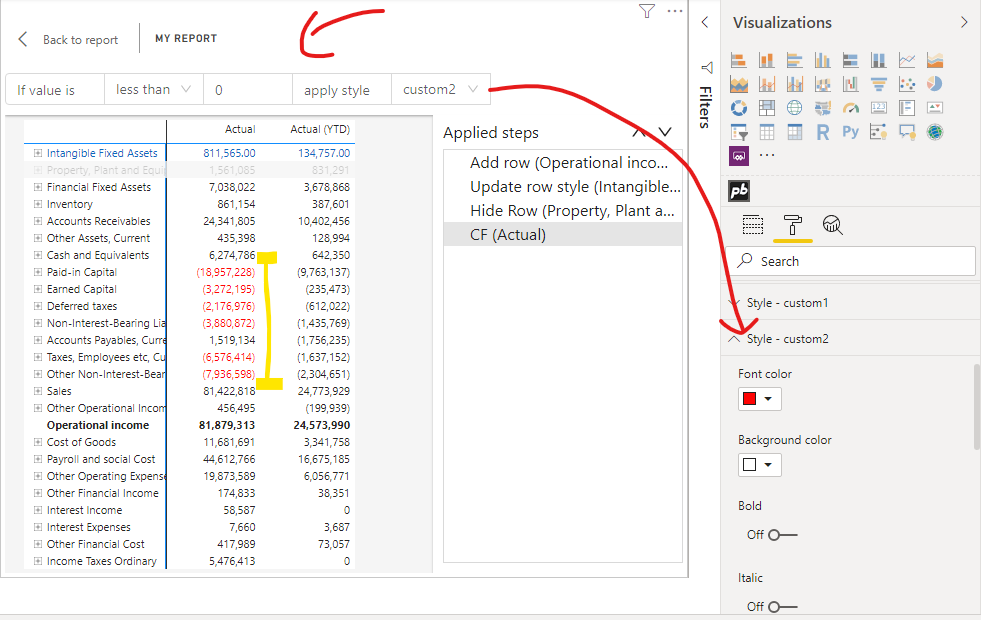
- Set the conditions and choose the style(s).
Step 1
Step 2
Step 3
Conditional Formatting using column index
Available from version 9.0.0.0
You can now apply formatting to a column based on its position (column index) rather than its name or data binding. This ensures your column formatting remains intact even if the column's name or underlying data changes over time.
To apply formatting based on the column index, follow these steps:
-
Ensure you are in Edit mode.
-
Right-click the column header and choose Add conditional formatting. (Note: Do not use "Add column conditional formatting", as the index option is only valid for standard conditional formatting).
-
In the formatting pane under the Conditions section, select Column Index from the dropdown.
-
Once Column Index is selected, the visual will temporarily display zero-based index numbers (0, 1, 2, 3...) above the columns to help you easily identify the correct position.
-
Indicate your condition range (e.g., greater than, equals) using the provided index numbers.
-
Choose your formatting style and click Apply. The formatting will only be applied to columns that match your index criteria for the selected measure.
In the example below, we apply custom1 style to the first quarter in the current context:
If the end user filters the report page to only show Q3 and Q4, the style will be applied to Q3, as it has column index 0:
How Indexing Works (Rules & Scenarios)
The column index feature follows strict rules to ensure consistent layout formatting:
- Lowest level formatting: The system assigns a zero-based index (starts at 0) to each visible column on the lowest level, counting from left to right, linked to the selected measure.
- Custom columns are excluded: Any custom columns you have added are skipped and not included in the indexation count.
- Hidden columns are included: If there are hidden columns in your dataset, the system still counts them in the background calculation to maintain stable indexing.
- Collapsed column groups: If you use column expansion and a group is collapsed, the system still calculates the index of the collapsed columns. However, it will only visually show the user the indexes for the columns that remain visible.
- Column hierarchy levels (Totals): When configuring the formatting, pay attention to the Column hierarchy levels setting. Even though a Total column gets an index number (shown in the UI), the formatting will only apply if the hierarchy level is set to include Totals (e.g., Values and Totals vs just Values).
- Measures above columns Layout: If your visual is configured with "Measures above columns", the system calculates the measure index based on the default positioning, but the visual will display the column index number next to the lowest level value instead of above the header.