Portfolio (Detail Page) - Platinum-PMO-LLC/amigo-wiki GitHub Wiki
-
Introduction
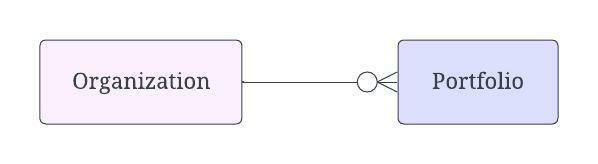
- Key Relationship
- Important Field Dependencies
- Available features
- Highlights Panel
-
Portfolio Tabs
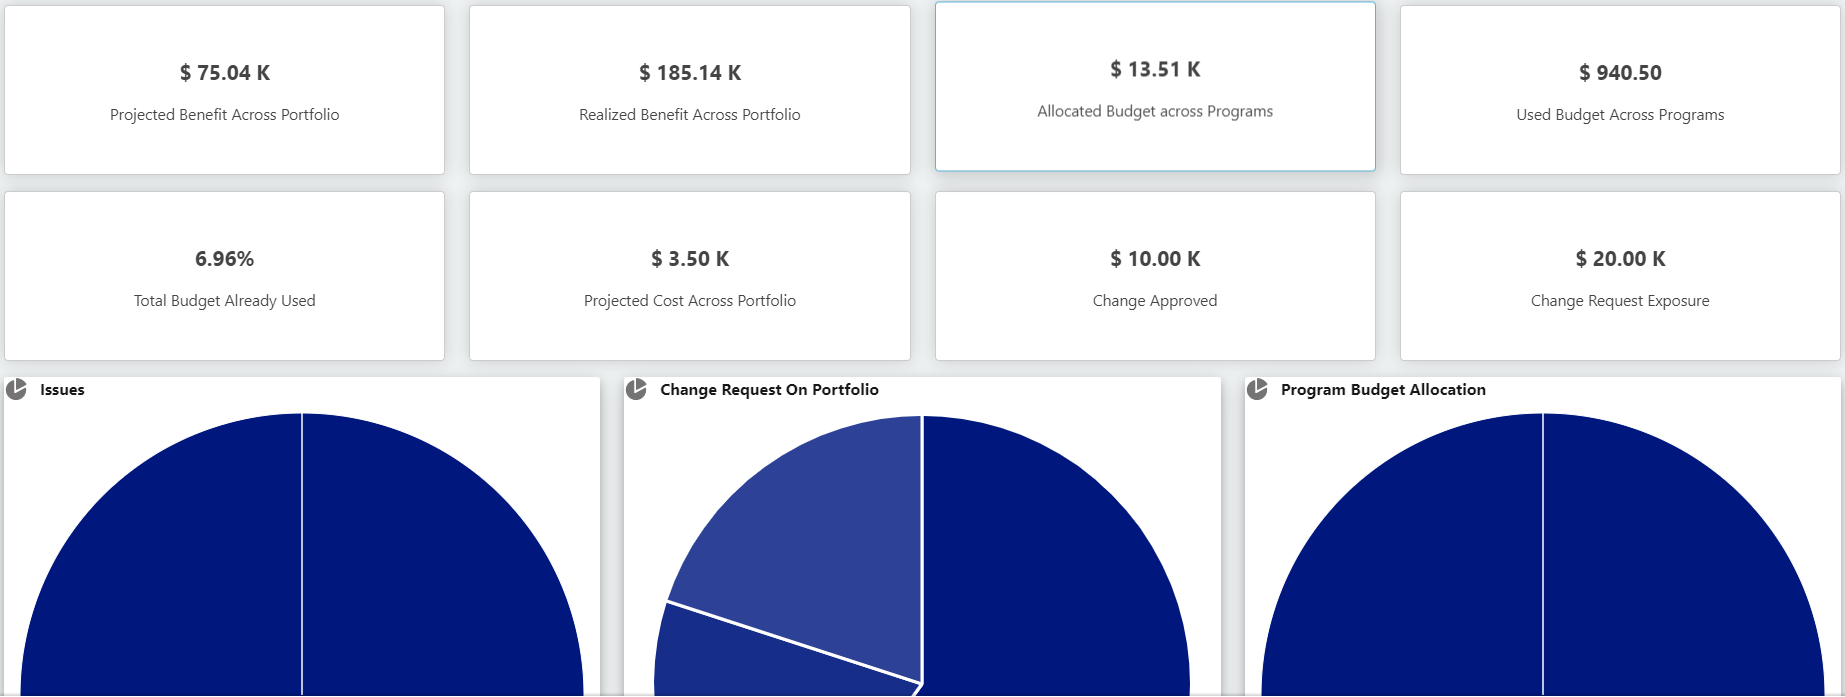
- Dashboard
- Projected Benefit Across Portfolio
- Realized Benefit Across Portfolio
- Allocated Budget across Programs
- Used Budget Across Programs
- Total Budget Already Used
- Projected Cost Across Portfolio
- Change Approved
- Changes Request Exposure
- Issues
- Change Request On Portfolio
- Program Budget Allocation
- Benefit Analysis
- Cost Analysis
- Portfolio Risk Profile
- Approvals/Decisions Pending
- Details
- Portfolio Level Users
- Portfolio Evaluation Request
- Evaluation Dashboard
- Portfolio Evaluators
- Programs
- Insights & Accelerators
-
Other Related
- [References - Organization]
A portfolio is where you're going to house all the different initiatives or programs that your organization has the desire to accomplish. Now, one of the key challenges that just about every organization I've ever been involved with has is that they have many more programs or initiatives that they want to run than they have the resources or the finances to accomplish.
| Object | Usage Notes | Visibility | Filter & Search Criteria |
|---|---|---|---|
| Organization | Any changes in the Organization record will be updated in Portfolio | The users Invited in the Organization record will have the access to the particular Portfolio | Organization |

In the Portfolio page layout, there is an action button - Add Program. To add a Program object record associated with the current Portfolio, users need to click on the Add Program button, which will bring up a modal form containing the fields which are needed to fill for creating a new Program record. After saving it, the Program will be saved and added to the Program tab-related list.
Using this action button System Admin/s can Invite Portfolio Level Users (Note: Profile Hyperlink) to the Portfolio. And the invited users will have access to the Portfolio Level Records.
Action Button Reference image from AMIGO App (below image)

Other than this, using this action button System Admins can also map Organizational Resource Hierarchy for other Level Users Like Portfolio Level (Note: Profile Hyperlink) and Program Level Users (Note: Profile Hyperlink). When Inviting a Portfolio/ Program Level User they will not directly get access to the Organizational Level, but Admin/ Org Level User have to invite them to Portfolio or, Program Level Records to give access.
To Invite a Program Level User to Program records please refer to this ref: Click Here
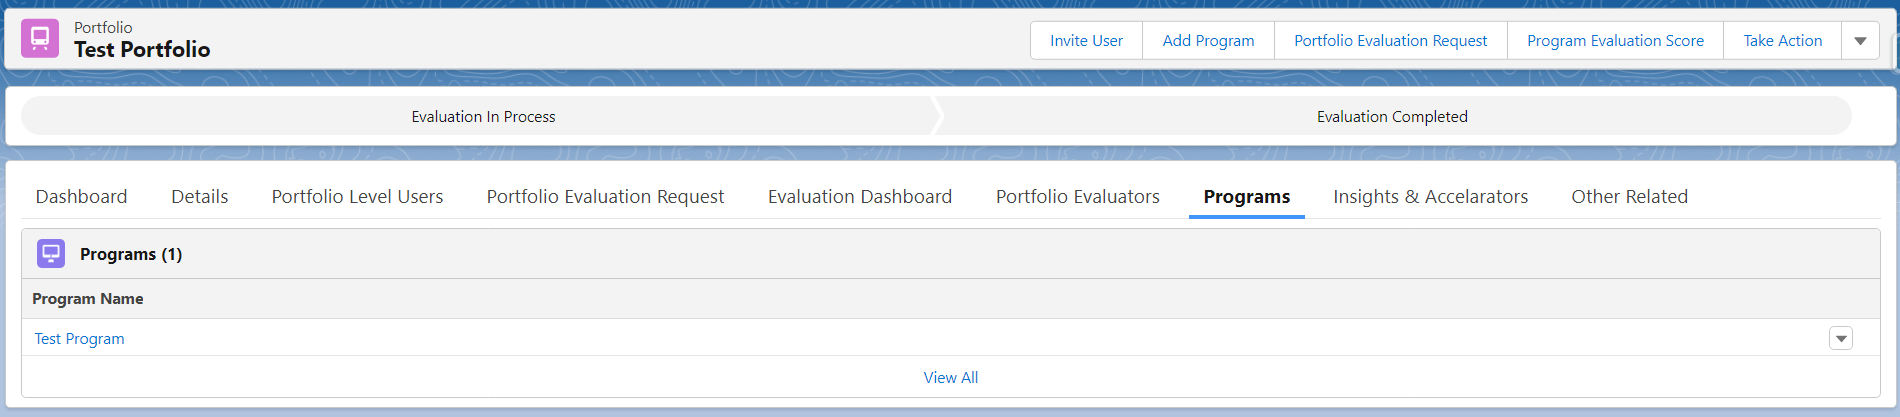
The Portfolio has Approvals which go through two stages - Evaluation In Process and Evaluation Completed. The Users will be able to send the record in Evaluation and complete the Evaluation Process. Let's discuss the Portfolio Evaluation Process which involves two phases with the help of two Quick Actions - Portfolio Evaluation Request and Program Evaluation Score.
When Evaluation In Process

When Evaluation Completed

The first stage for submitting the Portfolio for Evaluation involves the quick action - Portfolio Evaluation Request. Pre-requisite for performing the Evaluation process in a Portfolio record:
- You have to be the Portfolio Owner of this record to submit and complete the Portfolio Evaluation.
- You must keep in mind that if the Portfolio Evaluation is in the process (already submitted for an Evaluation) then you cannot add an evaluation.
- If you want to submit Portfolio Evaluation Request then the Portfolio status must not be in Process.
- The Program (selected during filling Evaluation form) should not be in Approved or in Auto Approved status.
- You can add Organization Level User or System Admin User as an Evaluator.
Perform the Portfolio Evaluation Request Action- The user needs to click the action button Portfolio Evaluation Request after which a form will pop up, and the user has to fill in all the fields.
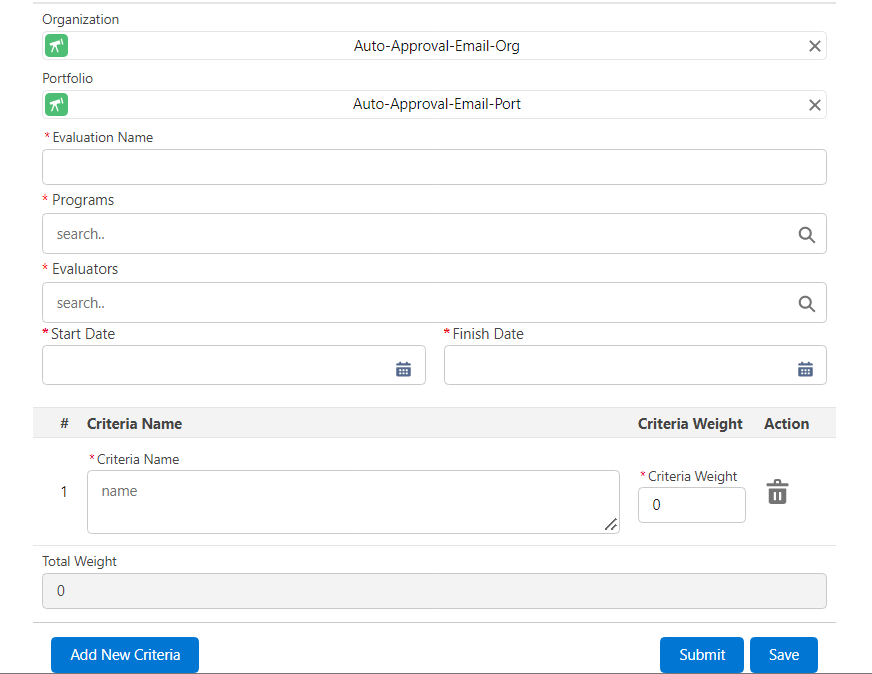
The Organization and Portfolio field will populate automatically, and then the users need to fill in the other mandatory fields - Evaluation Name, Programs, Evaluators, Start Date, Finish Date, Criteria Name and Criteria Weight. The user is allowed to add more than one criterion here, but one thing that should be kept in mind while adding criteria is - Total weight of Criteria must be equal to 100 not more or less. You can add as many Criteria using the Add New Criteria button as per requirement but keep the total weight equal to 100. The best practice is to save the evaluation request form before the final submission so that users can have the option to review the information they filled in and make any changes if needed. After submission, the Portfolio will be in 'Evaluation in Process'. After submitting the Portfolio Evaluation, if the user clicks on the Portfolio Evaluation Request then a modal will pop up and show 'Portfolio Evaluation is In Process. You can not add/update further Portfolio Evaluation Criteria.'

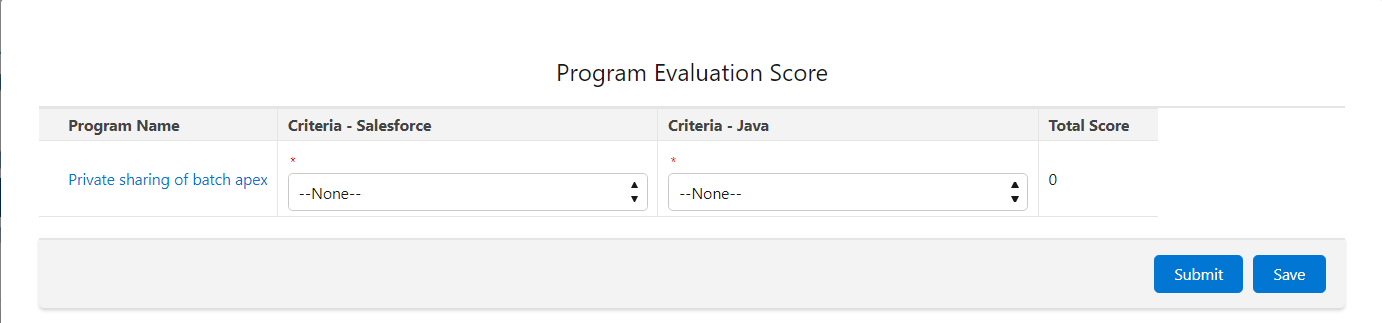
Now, after the first stage of the Portfolio Evaluation, here comes the second stage where the users have to use this quick action Program Evaluation Score. A modal will appear and the users need to fill in the Criteria Score when the Program Evaluation Score button is clicked. The Total Weight depends on the Criteria Score since the Total Weight is equal to the Sum of the (Criteria Weight * Program Score selected per criteria). As mentioned before, in this case, the users should save before submitting the score for best practice so that you can perform as many changes as per their requirement before final submission. Because the Total Weight changes based on the given Program score per Criteria. After submitting it, the Program Score gets reflected on the Evaluation Dashboard. To learn more about this part refer to [this section](https://platinum-pmo-llc.github.io/amigo-wiki/Portfolio-(Detail-Page)#evaluation-dashboard). When the Program Evaluation Score is submitted, users need to click on the Approvals button to complete the Evaluation, and then the Portfolio status changes to 'Evaluation Completed'. Once this process gets completed, the users (who must be the Portfolio owner) will be able to send the portfolio evaluation request again. This is how the process can be performed.

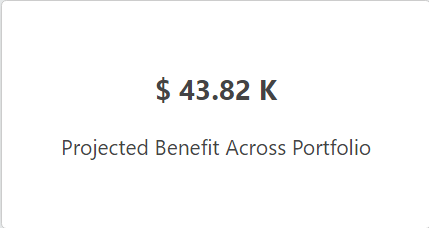
The dashboard component named `Projected Benefit Across Portfolio` in the Portfolio object displays the data which is determined from the `Sum of Total Benefit of the related Benefit record/s of the Portfolio`. A benefit is a custom object which has a field named Total Benefit that contains some amount in some specific currency. A benefit object record is created associated with the organizational hierarchy in which Portfolio is also present.
(Reference Image below)
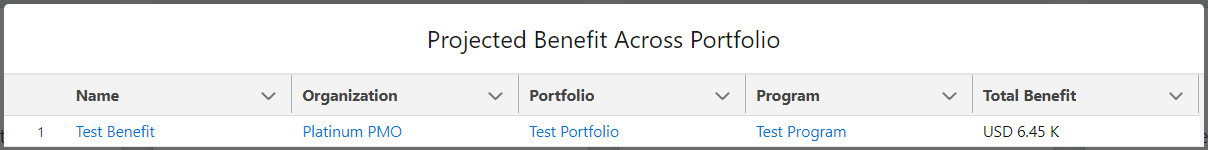
The dashboard component also contains modal functionality, if you click on it, a modal will popup which displays - Name (name of the associated Benefit record), Organization, Portfolio & Program (associated to the Organization) and Total Benefit, in a tabular form. The above-mentioned object record/s names are hyperlinks which will navigate us to the record/s page.
(Reference Image below)
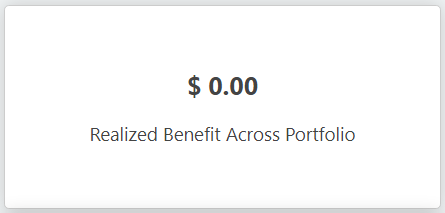
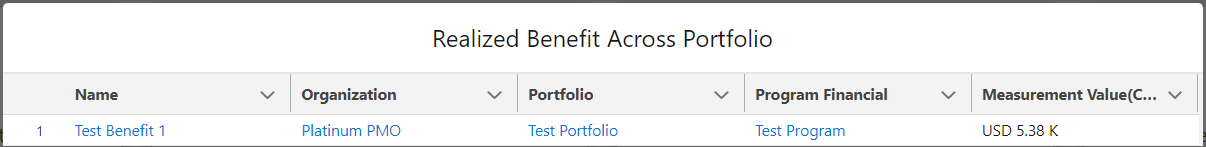
The dashboard component named `Realized Benefit Across Portfolio` in the Portfolio object displays the data which is determined from the `Sum of Measurement Value (Currency) of the related Benefit Tracking Details record/s of the Portfolio`. Benefit Tracking Details is a custom object which is a child object of the Benefit object, and it contains a field named Measurement Value (Currency) in some specific currencies.
(Reference Image below)
The dashboard component also contains modal functionality, if you click on it, a modal will popup which displays - Name (name of the associated Benefit record), Organization, Portfolio, Program Financial (child object of Program Financial) and Measurement Value (Currency), in a tabular form. The above-mentioned object record/s names are hyperlinks which will navigate us to the record/s page.
(Reference Image below)
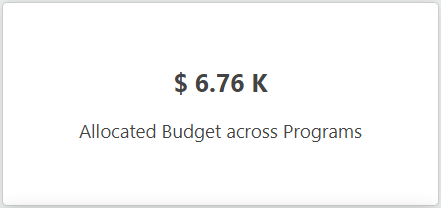
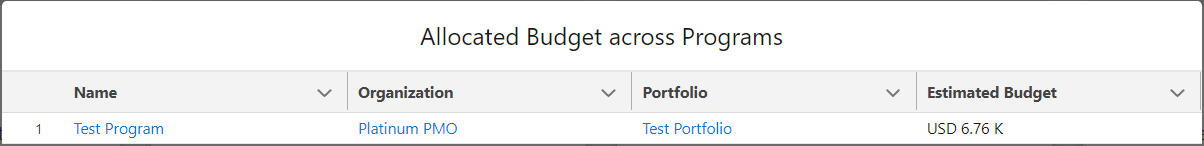
The dashboard component named Allocated Budget across Programs in the Portfolio object displays the data which is determined from the Sum of Estimated Budget of the related Program record/s of the Portfolio`. Estimated Budget is a field in the Program object. The value that is populated in the dashboard is the value of this field present in the Program that is associated with this particular Portfolio.
(Reference Image below)
The Dashboard component also contains modal functionality, if you click on it, a modal will pop up which displays - Name (name of the associated Program), Organization, Portfolio and Estimated Budget, in a tabular form. The above-mentioned object record/s names are hyperlinks which will navigate us to the record/s page. The modal shows the number of Program record/s that depend on the related Program/s present.
(Reference Image below)
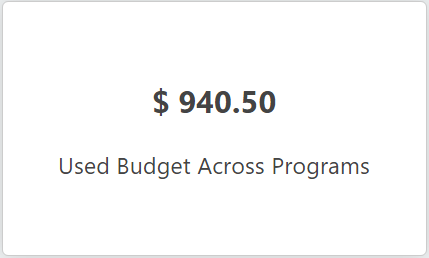
The Dashboard component named Used Budget Across Programs in the Portfolio object displays the data which is determined from:
Used Budget: Non-Labor Cost (Cost Type picklist field + (Time Tracking Hours * User Billing Rate) + Expense Amount of Expense Tracking object
Note:
Non-Labour Cost: Cost Type pick-list field in the cost object and the value will be picked from the Cost record associated with this Portfolio.
Time Tracking Hours: It is filled by the Users under the Work Package/s associated with this Portfolio following its hierarchy.
User Billing Rate: Billing Rate of the Current User
Expense Amount of Expense Tracking object: The value of the Expense Amount field of the Expense Tracking object associated with this Portfolio
(Reference Image below)
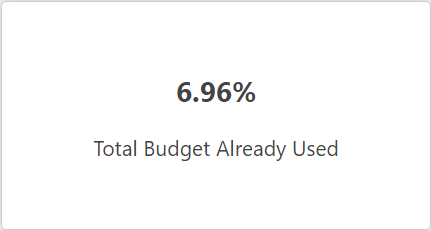
The Dashboard component named `Total Budget Already Used` in the Portfolio object displays the data which is determined from:
Total Budget already Used Percent: ((Used Budget/Estimated Budget) *100) Used Budget: Non-Labor Cost (Cost Type picklist field + (Time Tracking Hours * User Billing Rate) + Expense Amount of Expense Tracking object Estimated Budget: Total Sum of the Estimated Budget Field of the associated Program of the Portfolio
Note:
Non-Labour Cost: Cost Type pick-list field in the cost object and the value will be picked from the Cost record associated with this Portfolio.
Time Tracking Hours: It is filled by the Users under the Work Package/s associated with this Portfolio following its hierarchy.
User Billing Rate: Billing Rate of the Current User
Expense Amount of Expense Tracking object: The value of the Expense Amount field of the Expense Tracking object associated with this Portfolio
(Reference Image below)
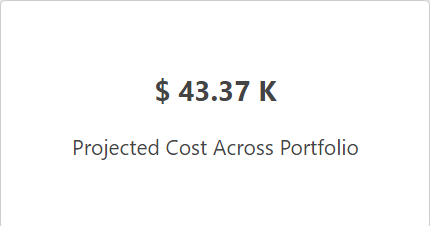
The dashboard component named `Projected Cost Across Portfolio` in the Portfolio object displays the data which is determined from the `Sum of Total Cost(Sum of the Quarters fields) of the related Cost Tracking record/s of the Portfolio`.
(Reference Image below)
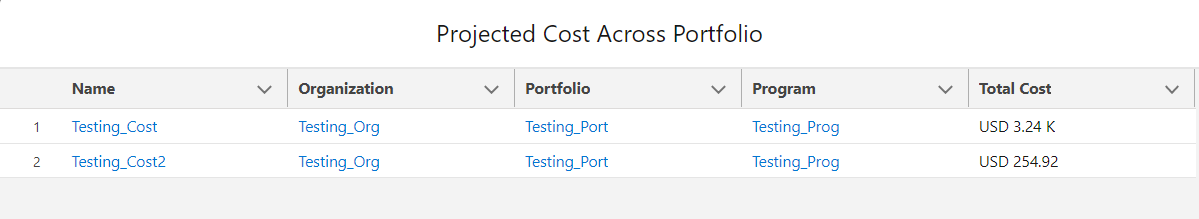
The dashboard component also contains modal functionality, if you click on it, a modal will pop up which displays - Name (name of the associated Cost record), Organization, Portfolio, Program and Total Cost, in a tabular form. The above-mentioned object record/s names are hyperlinks which will navigate us to the record/s page.
(Reference Image below)
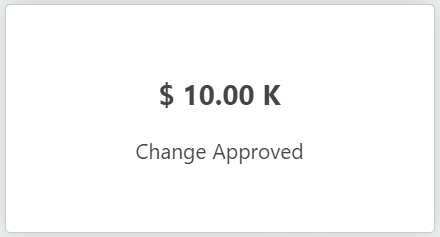
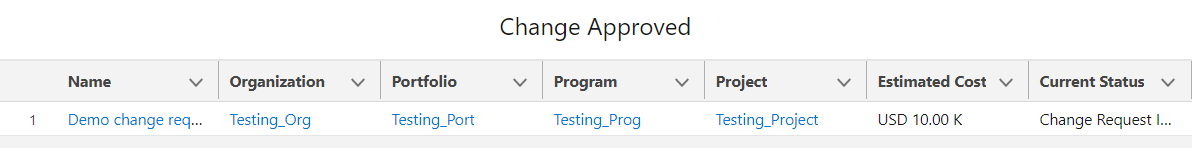
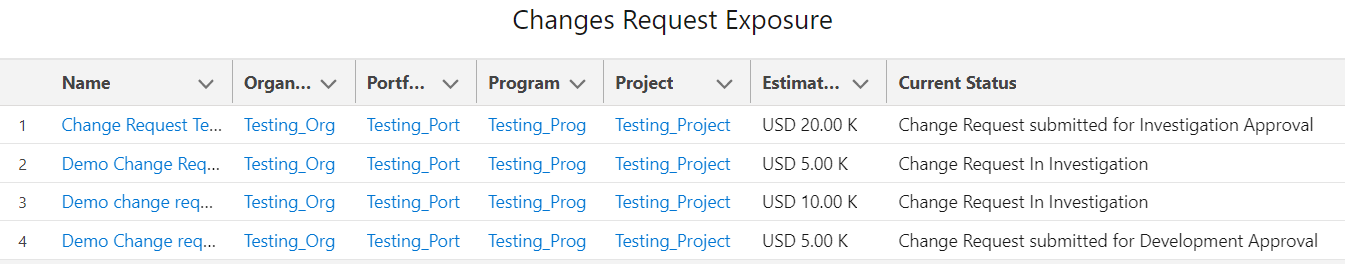
The dashboard component `Change Approved` in the Portfolio object displays the data which is determined from the Estimated Cost field of the associated Change Request Log (custom object in AMIGO) in **Change Request Implemented- Closed** stage. If there is more than one Change Request Log record (must be in the mentioned stage) related to this Portfolio, then the dashboard will display the value which will be equal to the sum of the Estimated Cost of all the Change Request Log records.
The Modal Functionality is present in the dashboard, if the user clicks on it, a modal will appear which contains - Name, Organization, Portfolio, Program, Project, Estimated Cost and Current Status, of the related Change Request Log record, in a tabular form. The above-mentioned object record/s names are hyperlinks that will redirect to the proper addresses.
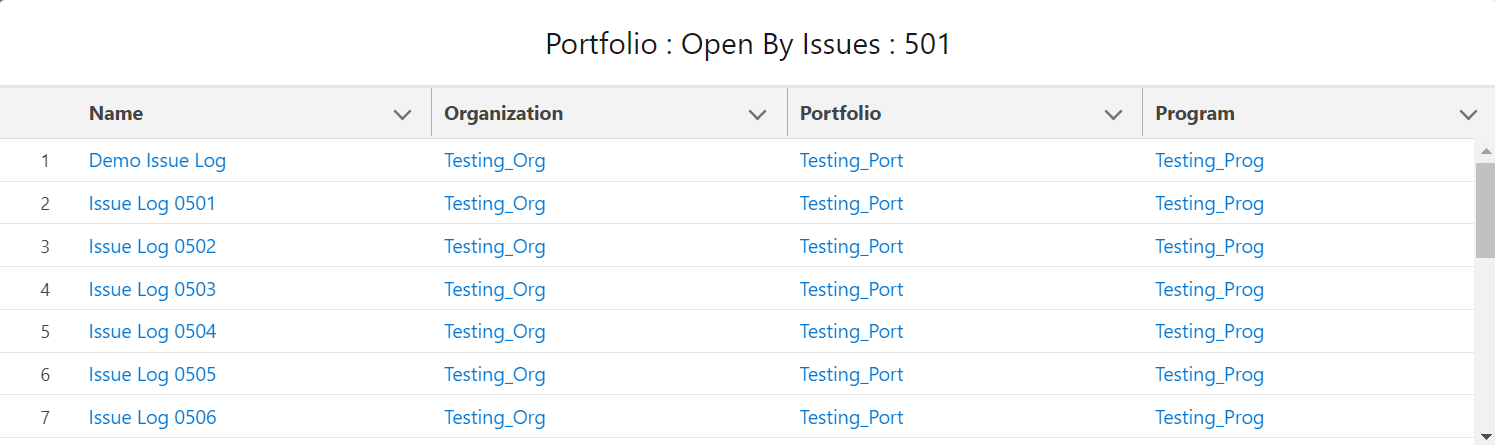
The `Issues` dashboard in Portfolio is a Pie Chart that populates the Issue Log records, associated with the particular Portfolio, according to their open status, that means, the Issue Log records that are present in the stages - Initialize, In Coordination, In Resolution and Resolved/ Waiting for Sign off, are populated. The records that are already Tested and Completed are considered closed, so they are not displayed there.
(Reference Image Below)
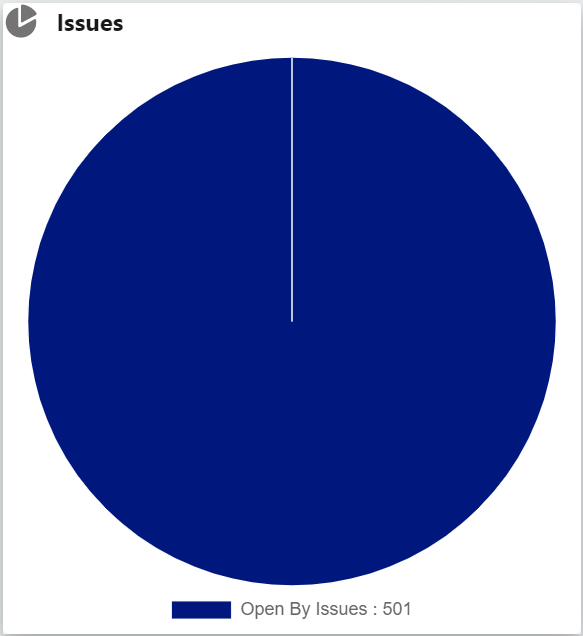
The dashboard has modal functionality, if the user clicks on the pie chart, he/she will be able to see the modal view and check Issue names by their respective Organization, Portfolio & Program. The records are hyperlinks that will be redirected to their proper addresses.
(Reference Image Below)
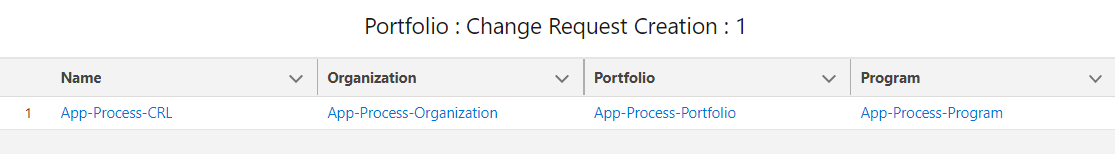
The dashboard named `Change Request On Portfolio` in the Portfolio object contains a Donut chart that displays the Change Request Log object record/s associated with this particular Portfolio according to their stages of Approval. The chart is divided into different colour shades which depend on the number of Change Request Log object record/s, i.e., if there are three Change Request Log records associated with the Portfolio, then the chart will have three-part with different colours.
(Reference: Below Image)
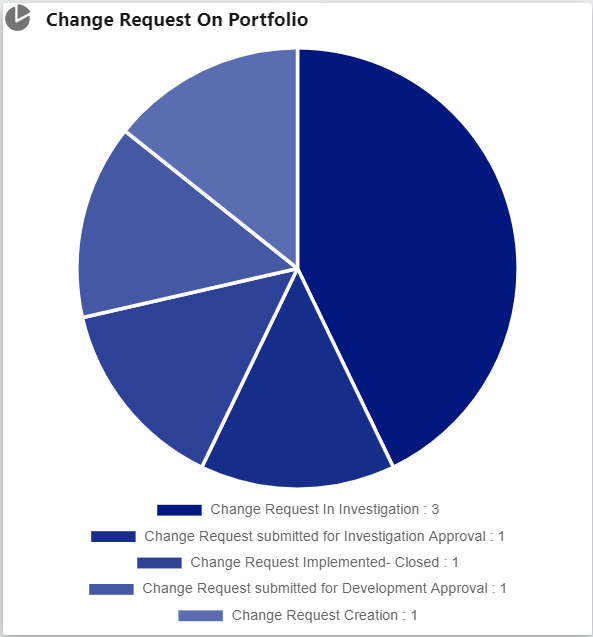
This pie chart contains modal functionality. Suppose we click on any of the colour shades a modal appears. In that case, that contains - The Name (name of the associated Change Request Log record), and its higher-level hierarchy object record names - Organization, Portfolio & Program in a tabular form. The object record/s names are hyperlinks that navigate to the record/s page.
(Reference: Below Image)
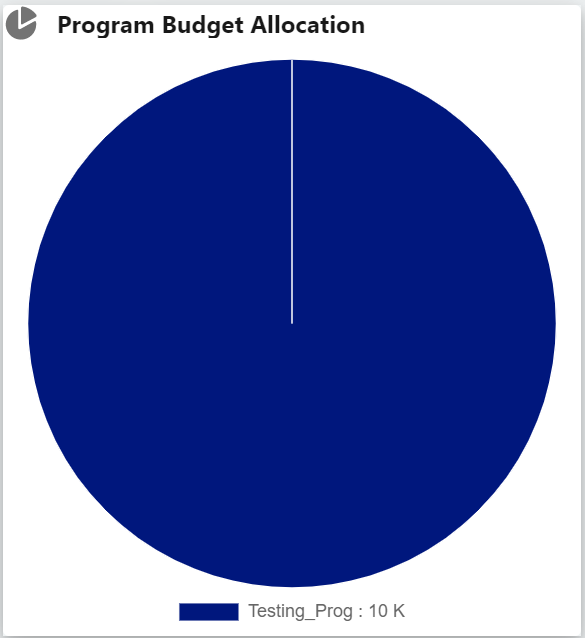
The `Program Budget Allocation` dashboard in the Portfolio object is a Donut chart that determines value from the Estimated Budget field value of the associated Program record/s of the Portfolio record, and displays that value in the dashboard. The chart is divided into different colours which depend on the number of Program records with the Estimated Budget field containing a value, i.e., if there are three program records associated with the Portfolio, then the chart will have three-part with different colours.
(Reference: Below Image)
The Benefit Analysis dashboard in the Portfolio object is a data visualisation through a Graph chart.
(Reference: Below Image)
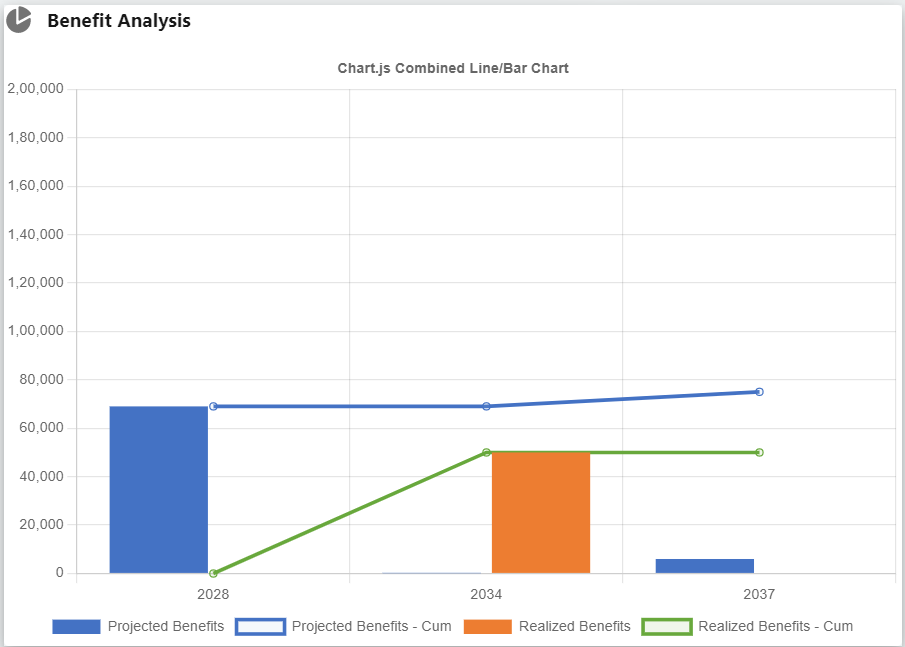
Below is the demonstration of the data that populates this graph chart:
To get data populated in the Benefit Analysis Graph-
- The Program Financial (associated with the Program of this Portfolio) needs to be edited of the related Program for which you are creating a Benefit Tracking & Benefit Tracking Details. The fields - Starting Year & Starting Quarter need to be filled in.
- Create new records of Benefit Tracking & Benefit Tracking Details associated with the Program of this particular Portfolio.
- The Starting Year is reflected in X-axis & The cost for that Program Financial is reflected in the Y-axis.
- The Sum of the quarter's cost amount in Benefit Tracking for all the quarters in a year for that particular Portfolio is reflected as Projected Benefits in Blue Blocks.
- The Sum of Measurement Value(Currency) in Benefit Tracking Details for that particular Portfolio is reflected as Realised Benefits in Orange Block.
- The cumulative Sum of Projected Benefits in Benefit Tracking for that particular Portfolio is reflected as Projected Benefits-cum in Blue Line.
- The cumulative Sum of Realised Benefits in Benefit Tracking Details for that particular Portfolio is reflected as Realised Benefits-cum in Orange Line.
Note:
While creating a Benefit Tracking record - the Benefit Type should be Financial Benefit (Hard) (Benefit Type is a pick-list field in the Benefit Tracking Details object).
While creating a Benefit Tracking Details record - The Benefit Type should be Financial Benefit (Hard).
To analyze the Projected Benefits Block, the Cost Amount must be added to the Financial Benefit information Quarter Costs.
The Cost Analysis dashboard in the Portfolio object is a data visualization through a Graph chart.
(Reference: Below Image)
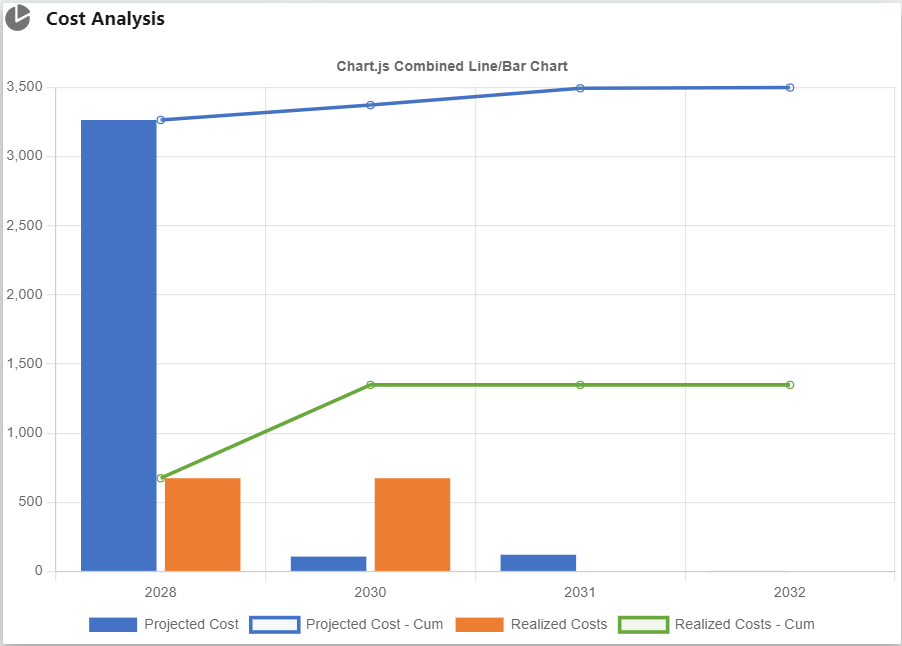
Below is the demonstration of the data that populates this graph chart: To get data populated in the Cost Analysis Graph-
- The Program Financial (associated with the Program of this Portfolio) needs to be edited for which Program a Cost Tracking & Cost Tracking Details will be created, the fields - Starting Year & Starting Quarter need to be filled.
- Create new records of Cost Tracking & Cost Tracking Details associated with this particular Organization's program.
- The Starting Year is reflected in X-axis & the Cost for that Program Financial is reflected in the Y-axis.
- Sum of quarter's cost amount in cost Tracking for all the quarters in a year for that particular Portfolio is reflected as Projected Cost in Blue Blocks.
- Sum of Measurement Value in cost Tracking Details for that particular Portfolio is reflected as Realized cost in Orange Block.
- Cumulative Sum of Projected cost in cost Tracking for that particular Portfolio is reflected as Projected cost-cum in Blue Line.
- Cumulative Sum of Realized cost in cost Tracking Details for that particular Portfolio is reflected as Realized cost-cum in Orange Line.
Note: While creating a Cost Tracking record- The cost type should be selected as Labor Cost (Cost Type pick-list field in the Cost Tracking Details object). While creating a Cost Tracking details record - The Cost Type should be selected as Labor Cost. To analyze the Projected Cost Block, we need to add the Cost Amount to the Financial Cost information quarter cost.
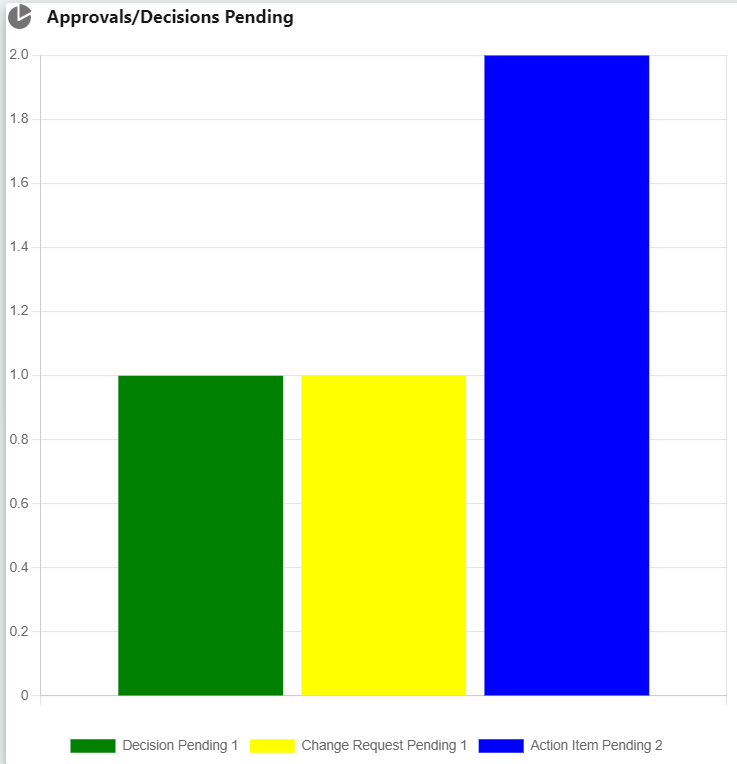
The Approvals/Decisions Pending dashboard is a graph chart that visualizes data for the related Key Decision, Change Request Log and Action Item records according to their Pending Status.
There are three different blocks for each of the object records. To get data
populated in the dashboard, the user has to follow the below steps:
For Decision Pending graph -
- Open or Create a New record of Key Decisions associated with this particular Portfolio, and add RACI Chart to it.
- Click on Approvals and then Send the record to Submit for Approval. After that, when the record will be In Approval (Pending stage).
- Then the users will be able to see the block for the pending Key Decisions getting populated in the graph chart.
- Also, the users will be able to see the modal view after clicking on the graph block, which contains the Key Decision record names along with its associated hierarchy - Organization, Portfolio and Program.
- Those records are hyperlinks, that will be redirected to their proper addresses.
(Reference Image Below)
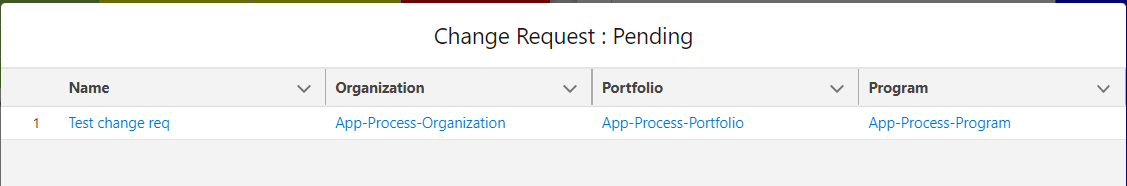
For Change Request Pending graph -
- Open or Create a New record of the Change Request Log associated with this particular Portfolio, and add Change Request Sponsor, Impact Assessment Owner and Change Request Delivery Manager to the record.
- Click on Approvals and then Send To Change Request submitted for Investigation Approval. After that, when the record will be in Change Request submitted for Investigation Approval (Pending stage).
- The Change Request Log object has a few stages of Approval - Initialize, In Coordination, In Resolution, Resolved and Completed. When a Change Request Log record stays in the Change Request submitted for Investigation Approval stage, then only the graph displays Change Request Log as Pending, not in the case of other stages.
- It will display the total number of Change Request Log records (associated with the particular Portfolio) pending in the graph bar.
- Also, the users will be able to see the modal view after clicking on the graph block, which contains the Change Request Log record names along with its associated hierarchy - Organization, Portfolio and Program.
- Those records are hyperlinks, that will be redirected to their proper addresses.
(Reference Image Below)
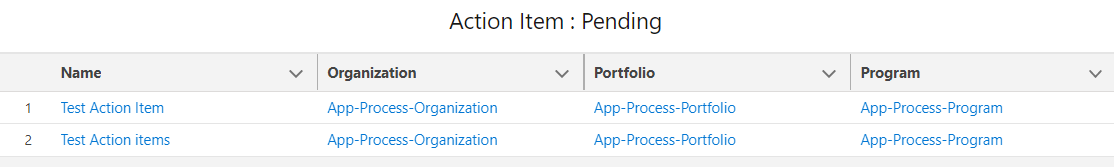
For Action Item Pending graph -
- Open or Create a New record of the Action Item associated with this particular Portfolio, and add Action Items Coordinator, Action Items Owner and Action Items Signoff Owner to the record.
- Click on Approvals and then Send To Coordination. After that, when the record will be In Coordination (Pending stage).
- The Action Item object has a few stages of Approval - Initialize, In Coordination, In Resolution, Resolved and Completed. When an Action Item record stays in In Coordination stage, then only the graph displays Action Item as Pending, not in the case of other stages.
- It will display the total number of action item records (associated with the particular Portfolio) pending in the graph bar.
- Also, the users will be able to see the modal view after clicking on the graph block, which contains the Action Item record names along with its associated hierarchy - Organization, Portfolio and Program.
- Those records are hyperlinks, that will be redirected to their proper addresses.
(Reference Image Below)
The Details Tab contains detailed information about the Portfolio record in the form of fields each containing specific values. Refer to the image below.
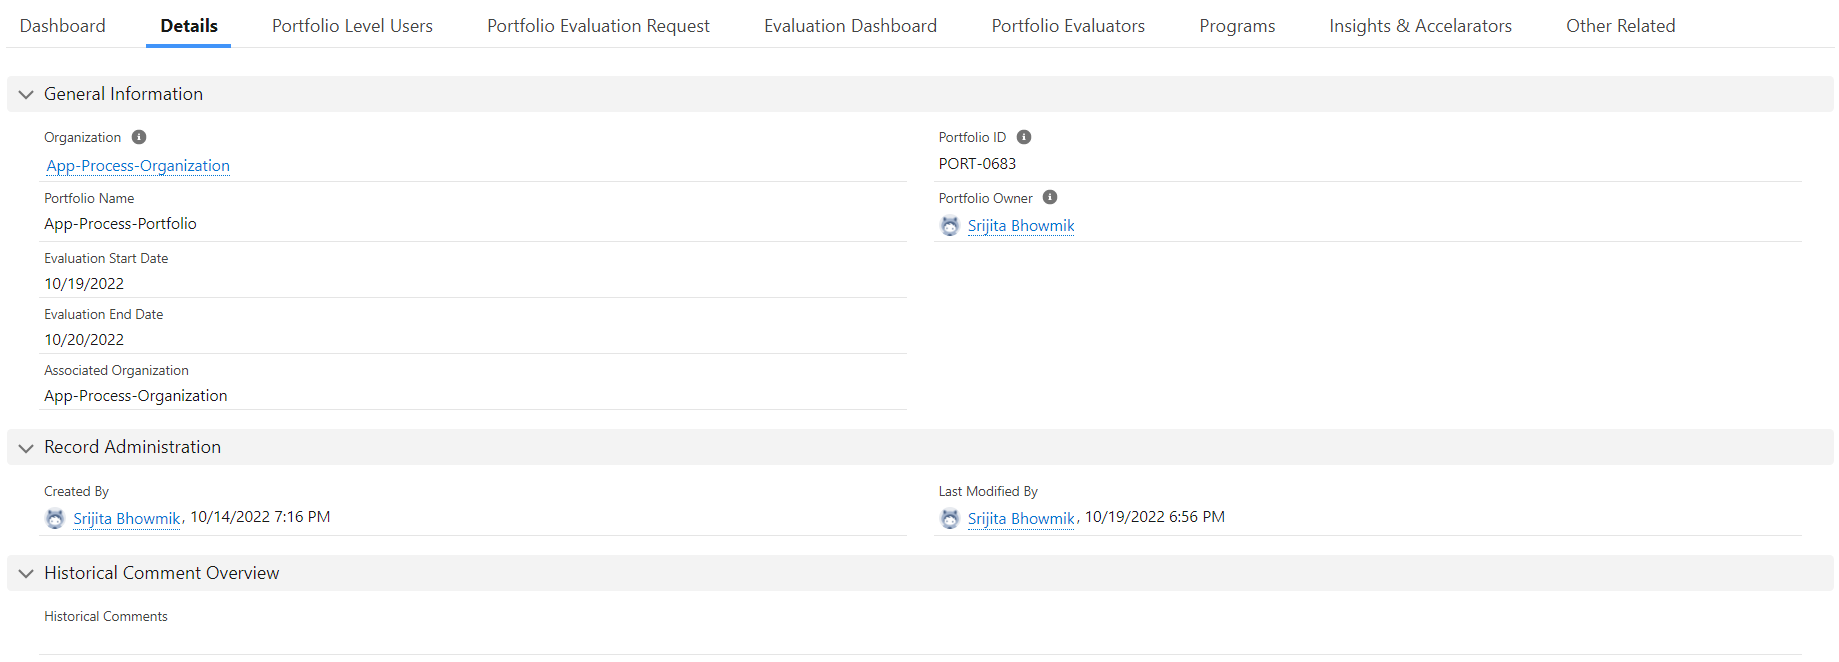
The Sections of the Details Tab:
-
General Information: This section contains the following fields -
Organization - Displays the name of the Organization related to which the Portfolio has been created, this is a hyperlink.
Portfolio ID - This is an auto number field that automatically gets created with a unique ID when a Portfolio gets created.
Portfolio Name - Displays the name of the Portfolio record.
Portfolio Owner - Displays the name of the owner (who created the record) of the Portfolio.
Evaluation Start Date - Displays the date when the Portfolio Evaluation started.
Evaluation End Date - Displays the date when the Portfolio Evaluation ended.
Associated Organization - Displays the name of the Organization related to which the Portfolio has been created, this is a text field, not a hyperlink.
-
Record Administration: This section also contains two fields, Created by and Last Modified By. Created By displays the name of the Owner or who created the record along with the Creation Date & Time. The Last Modified Date displays the name of the User (can be any other user other than the owner) who did any kind of changes or modification in the record along with the modification Date and Time.
-
Historical Comment Overview: This section contains three columns/fields - Created Date, Created By and the comment itself. Historical Comment is provided whenever a record is created and at the time of making any modifications by editing it. The best practice that should be followed by the users is to leave an appropriate comment every time they are making any kind of modifications in the record so that in future the changes could be kept on track.
When a user clicks on this tab, he/she will be able to view the Portfolio Level User who has been invited to this record.
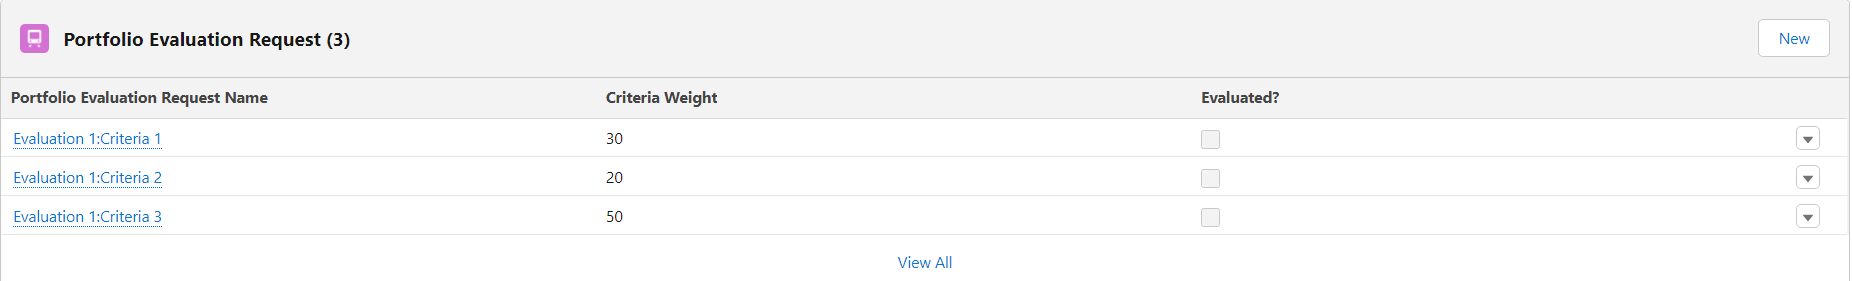
In this tab, the users will be able to view the Portfolio Evaluation Request Name, Criteria Weight and Evaluated status. The Portfolio Evaluation Request Name implies the Criteria Name, and the Criteria weight is the respective values of the criteria weight, given by the users at the time of performing the Portfolio Evaluation Request. The Evaluated column contains a checkbox which stays unchecked when the Evaluation is in Process and becomes checked when the station changes to Evaluation Completed. To know more about this feature please refer to [this section] (https://platinum-pmo-llc.github.io/amigo-wiki/Portfolio-(Detail-Page)#portfolio-evaluation-request).
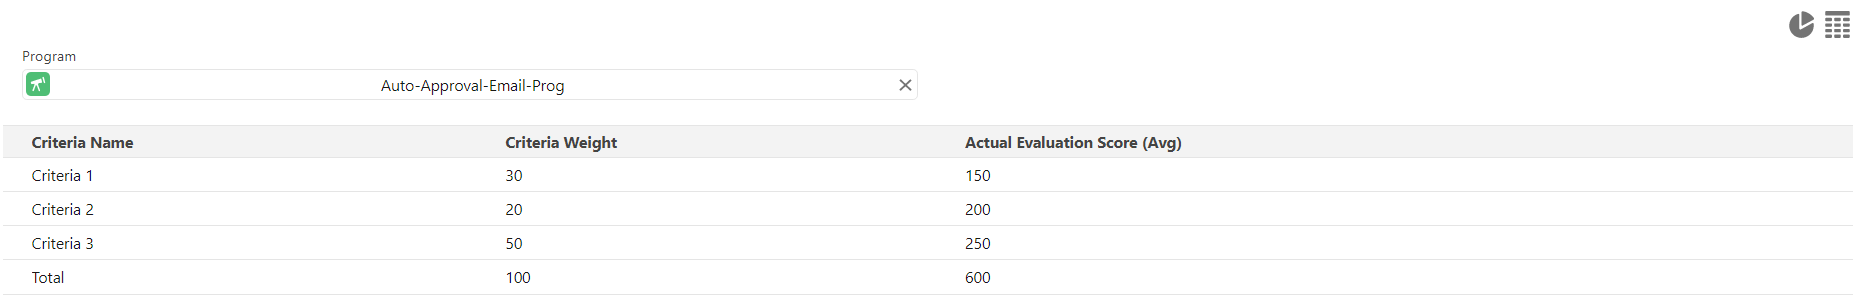
The Evaluation Dashboard visualizes the all-overview of the Portfolio Evaluation Process representing the evaluation score in a Graphical and Tabular view. The Criteria blocks are present below the Graph with their respective blocks colours. Hovering over the graph displays the scores according to their Criteria.
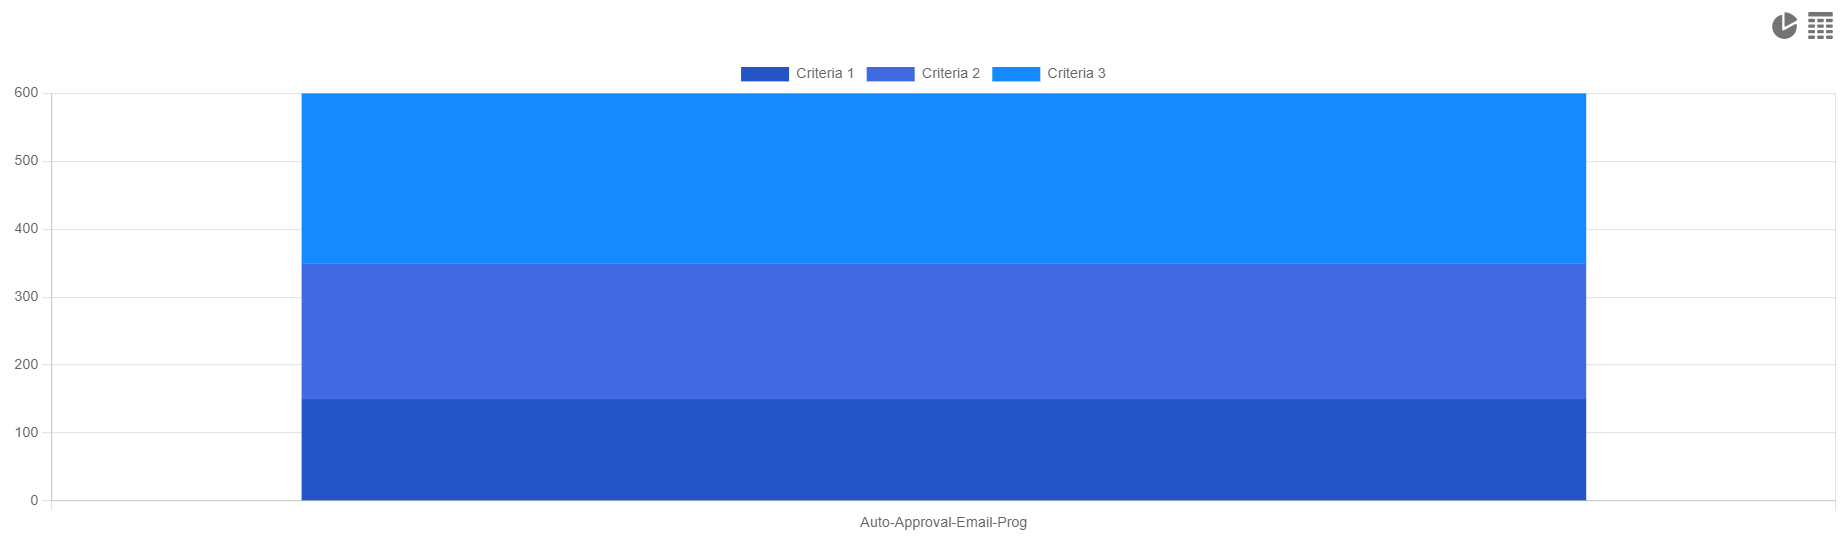
By clicking on the table icon the tab switch to the Tabular view of the Evaluation Scores and viewing users need to select Evaluation Programs to view Criteria scores accordingly.
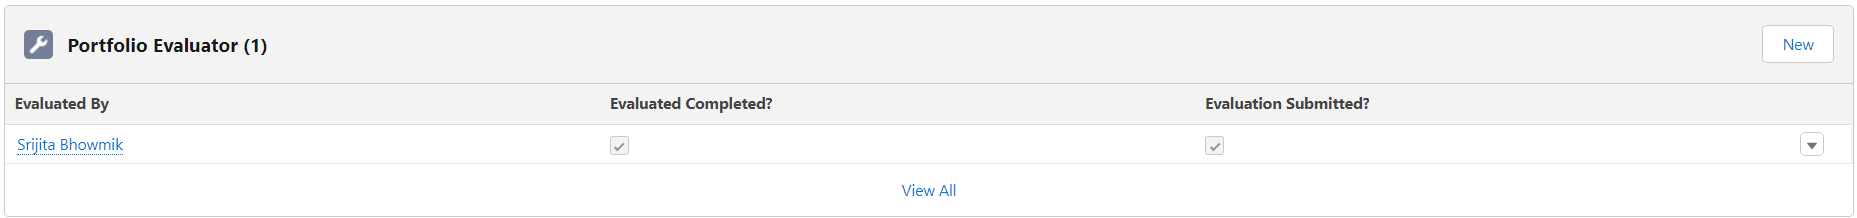
In this Tab, the Users can view the Portfolio Evaluators (users assigned as Evaluation during the Portfolio Evaluation Request action) and the status of the Evaluation process. It contains the entire thing in three columns - Evaluated By, Evaluated completed and Evaluation Submitted.
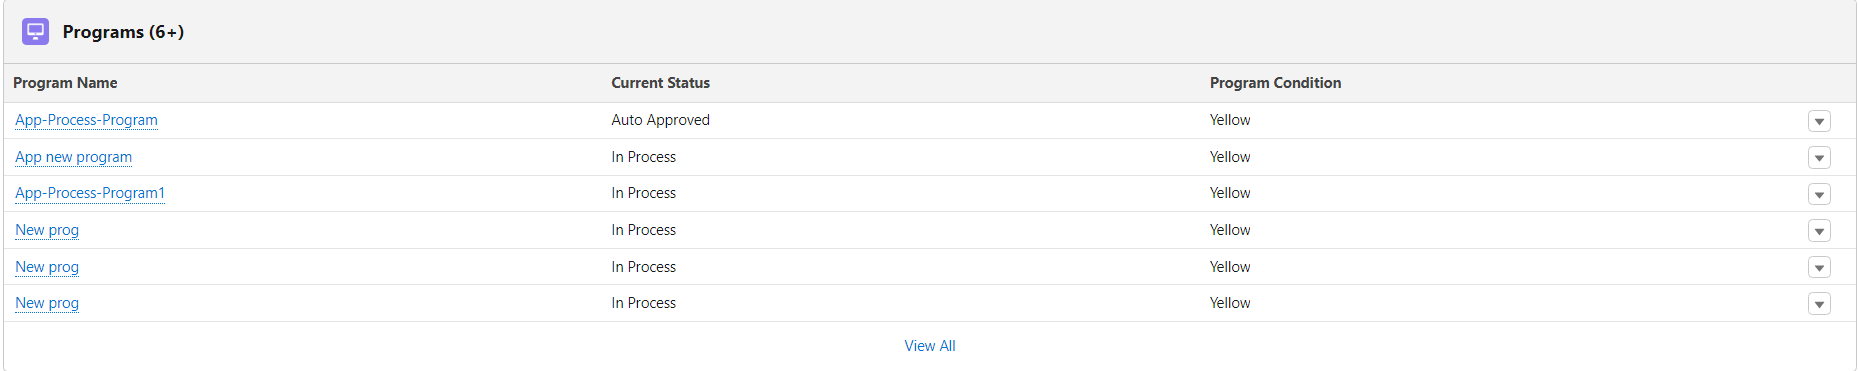
In the Programs Tab, the Users will be able to view the Program/s related to the particular Portfolio they are viewing. The Program is a Child Object of a Portfolio and has a One-To-Many Relationship with it, which means the Users can create more than one Program record associated with one Portfolio. This Tab contains the record names of those Programs which are created and associated with the particular Portfolio. For more information about the Program Object please refer to this [Page](https://platinum-pmo-llc.github.io/amigo-wiki/Program-(Detail-Page)).
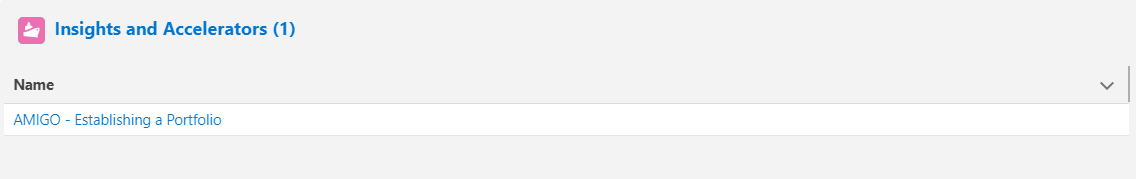
If a User clicks on this Tab, he/she will be able to see all the Insights & Accelerators related to the particular Portfolio. Each Insights & Accelerators record contains useful content that guides the User about the features of a particular object and how to use them in AMIGO. To know more about the Insights & Accelerators, please visit this [Page](https://platinum-pmo-llc.github.io/amigo-wiki/Insights-and-Accelerators-(Detail-Page)).
The Other Related Tab contains the Notes & Attachments section where any document related to the particular Organization record can be uploaded and saved for work. Besides this section contains the other objects related list are present (those that have a lookup relationship with the Organization) along with the Historical Comment section.

