Task 5: Sigmoid colon and stomach distal regulatory activity - PatiGenius/EpigenomicsTask_MscOmics GitHub Wiki
Distal regulatory activity
In this final task we use the results from the previous section Task 4, in which we have obtained the peaks for both sigmoid colon and stomach that fall oustide gene body coordinates. This information will serve us to create a distal regulatory elements catalogue.
We create a folder regulatory_elements inside the epigenomics_uvic. Here we save all the subsequent results.
mkdir regulatory_elements: to create the directory.
We also create the rest of directories:
mkdir annotation
mkdir data
mkdir data/bed.files
mkdir data/bigBed.files
mkdir analyses
mkdir analyses/peaks.analyses
From the starting catalogue of open regions in each tissue, we select the ones that overlaps peaks of H3K27ac and H3K4me1 in each tissue. We get a list of candidate distal regulatory elements.
1. First, we need to obtain the peaks for H3K4me1 and H3K27ac. We select them from the metadata file available in the ChIP-seq folder.
- For H3K4me1
grep -F H3K4me1 ../ChIP-seq/metadata.tsv | grep -F "bigBed_narrowPeak" | grep -F "pseudoreplicated_peaks" | grep -F "GRCh38" | awk 'BEGIN{FS=OFS="\t"}{print $1,$10,$22}' | sort -k2,2 -k1,1r | sort -k2,2 -u > analyses/bigBed.peaks.H3K4me1.txt

- For H3K27ac
grep -F H3K27ac ../ChIP-seq/metadata.tsv | grep -F "bigBed_narrowPeak" | grep -F "pseudoreplicated_peaks" | grep -F "GRCh38" | awk 'BEGIN{FS=OFS="\t"}{print $1,$10,$22}' | sort -k2,2 -k1,1r | sort -k2,2 -u > analyses/bigBed.peaks.H3K27ac.txt

2. We need to obtain the bigBed files
- For H3K4me1
cut -f1 analyses/bigBed.peaks.H3K27ac.txt | while read filename; do wget -P data/bigBed.files "https://www.encodeproject.org/files/$filename/@@download/$filename.bigBed" done
- For H3K27ac
cut -f1 analyses/bigBed.peaks.H3K4me1.txt | while read filename; do wget -P data/bigBed.files "https://www.encodeproject.org/files/$filename/@@download/$filename.bigBed" done
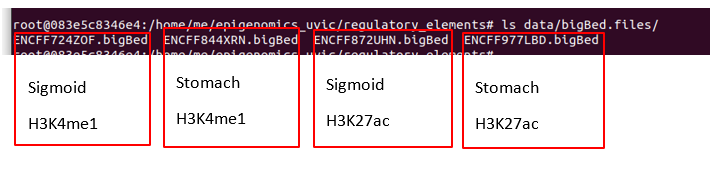
The results are the following:
3. We may verify the md5 values
for file_type in bigBed; do ../bin/selectRows.sh <(cut -f1 analyses/"$file_type".peaks.*.txt) ../ChIP-seq/metadata.tsv | cut -f1,45 > data/"$file_type".files/md5sum.txt cat data/"$file_type".files/md5sum.txt | while read filename original_md5sum; do md5sum data/"$file_type".files/"$filename"."$file_type" | awk -v filename="$filename" -v original_md5sum="$original_md5sum" 'BEGIN{FS=" "; OFS="\t"}{print filename, original_md5sum, $1}' done > tmp mv tmp data/"$file_type".files/md5sum.txt awk '$2!=$3' data/"$file_type".files/md5sum.txt done

We can see that they do correspond with the ones described above from the bigBed files.
4. Now, we need to convert the bigBed files to bed files in order to be able to manipulate data and use the intersect function from bedtools.
- For H3K4me1
cut -f1 analyses/bigBed.peaks.H3K4me1.txt | while read filename; do bigBedToBed data/bigBed.files/"$filename".bigBed data/bed.files/"$filename".bed done
- For H3K27ac
cut -f1 analyses/bigBed.peaks.H3K27ac.txt | while read filename; do bigBedToBed data/bigBed.files/"$filename".bigBed data/bed.files/"$filename".bed done
At this point we have available 4 bed files, obtained for 2 histone marks (H3K4me1,H3K27ac) and 2 tissues (stomach, sigmoid colon).
Now we can perform the intersect between the obtained peaks falling outside genes coordinates and the peaks of each one of the marks both in stomach and in simgoid colon.
5. Performing the intersect: from the starting catalogue of open regions (peaks obtained in task 4 ATAC-seq falling outside genes coordinates) we select those that overlap peaks of both histone marks in each tissue.
We want to retrieve the ATAC-seq peaks (database A,-a) that overlap both the peaks in H3K4me1 and H3K27ac (databases B, -b) in each tissue.
- For sigmoid colon
bedtools intersect -a ../ATAC-seq/analyses/peaks.analyses/genes.sigmoid_colon.outside.gene.coord.txt -b data/bed.files/ENCFF724ZOF.bed data/bed.files/ENCFF872UHN.bed -u | sort -u > analyses/peaks.analyses/genes.peaks.overlap.sigmoid_colon.txt

- For stomach
bedtools intersect -a ../ATAC-seq/analyses/peaks.analyses/genes.stomach.outside.gene.coord.txt -b data/bed.files/ENCFF844XRN.bed data/bed.files/ENCFF977LBD.bed -u | sort -u > analyses/peaks.analyses/genes.peaks.overlap.stomach.txt

We focus on regulatory elements located on chromosome 1 and generate a regulatory.elements.starts.tsv file that contains the name of the regulatory region (original ATAC-seq peak) and the start (5') coordinate of the region
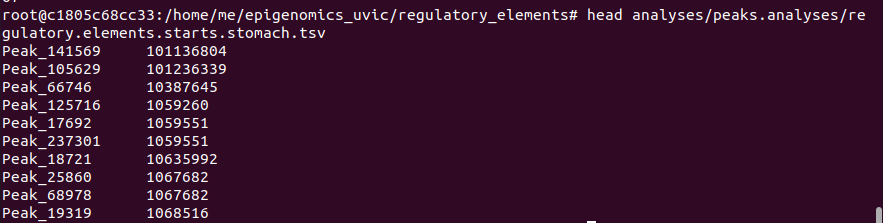
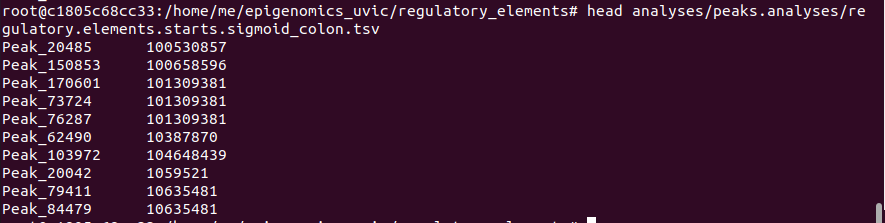
From the results obtained in the previous exercise, we may select just those from chromosome 1. We print in the first column the information about the original ATAC-seq peak and in the second column, the start coordinate.
- For stomach: 8602 regulatory elements located on chromosome 1
grep -F “chr1” analyses/peaks.analyses/genes.peaks.overlap.stomach.txt | awk 'BEGIN{FS=OFS="\t"} {print $4,$2}’ > analyses/ peaks.analyses/regulatory.elements.starts.stomach.tsv
- For sigmoid colon: 10734 regulatory elements located on chromosome 1
grep -F “chr1” analyses/peaks.analyses/genes.peaks.overlap.sigmoid_colon.txt | awk 'BEGIN{FS=OFS="\t"} {print $4,$2}’ > analyses/ peaks.analyses/regulatory.elements.starts.sigmoid_colon.tsv
We focus on protein-coding genes located on chromosome 1. From the BED file of gene body coordinates that we have generated and used before (annotation/gencode.v24.protein.coding.gene.body.bed), we prepare a tab-separated file called gene.starts.tsv which stores the name of the gene in the first column and the start coordinate in the second one.
We use the next code:
awk 'BEGIN{FS=OFS="\t"} $1==”chr1” {if ($6=="+"){start=$2} else {start=$3}; print $4, start}' ../ChIP-seq/annotation/gencode.v24.protein.coding.gene.body.bed > analyses/gene.starts.tsv

We download the python script to bin folder inside epigenomics_uvic directory and have a look to the help page
cp ../../Downloads/gent.distance.py ../bin: we download the python script and then move it to from Downloads to bin folder.
python ../bin/get.distance.py -h: we look the help page
The script uses two arguments: an input (file gene.starts.tsv) and a start coordinate (5' coordinate of a regulatory element). We may complete the script with the instructions to be able to obtain, for a given start coordinate, the closest gene, the start of this gene and the distance to the regulatory element.
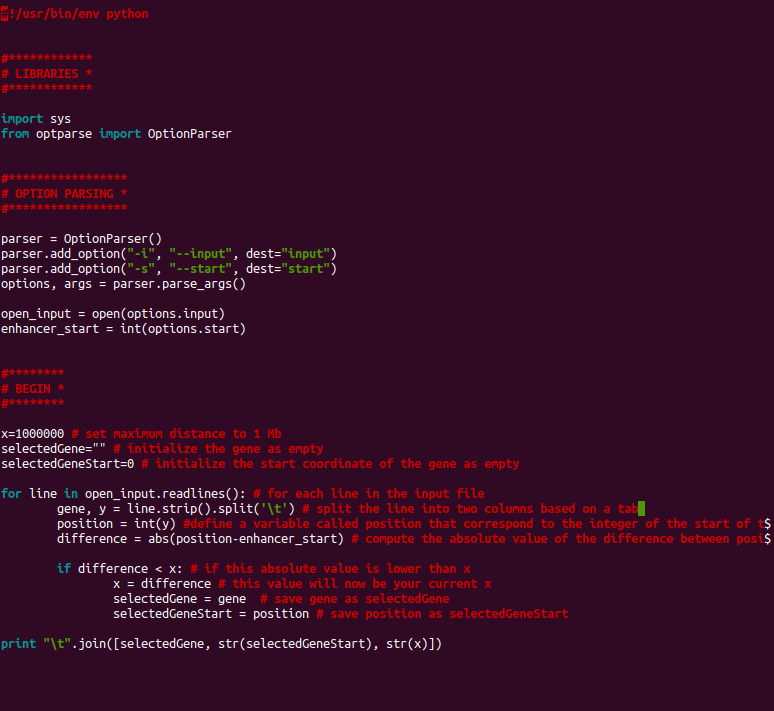
We check if we have correctly defined the variables by running the following command:
python ../bin/get.distance.py --input analyses/gene.starts.tsv --start 980000: we are expected to obtain as output ENSG00000187642.9-982093-2093.

Now, for each regulatory element contained in the file regulatory.elements.starts.$tissue.tsv, we retrieve the closest gene and the distance to this gene by using the python script.
We run the next code:
for tissue in stomach sigmoid_colon; do cat analyses/peaks.analyses/regulatory.elements.starts.$tissue.tsv | while read element start; do python ../bin/get.distance.py --input analyses/gene.starts.tsv --start $start done > analyses/peaks.analyses/regulatoryElements.genes.distances.$tissue.tsv done
And obtain two files: regulatoryElements.genes.distances.stomach.tsv and regulatoryElements.genes.distances.sigmoid_colon.tsv.
The strucutre of the output is the next one (we use as example the file corresponding to sigmoid colon):

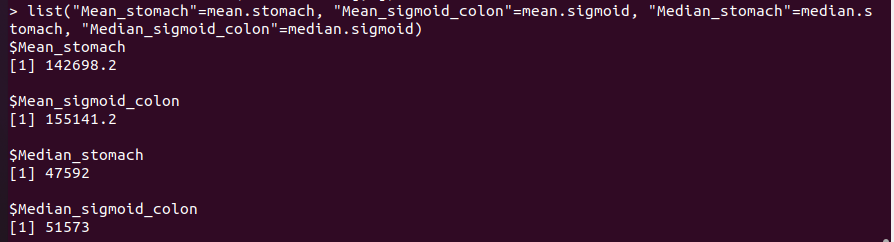
At last, we use R to compute the mean and the median of the distances stored in regulatoryElements.genes.distances.$tissue.tsv files
R: we run R
getwd(): to be sure that we are in the correct working directory
stomach.dist<- read.table("analyses/peaks.analyses/regulatoryElements.genes.distances.stomach.tsv", sep="\t") sigmoid.dist<- read.table("analyses/peaks.analyses/regulatoryElements.genes.distances.sigmoid_colon.tsv", sep="\t")
I change the column names to the corresponding information that each variable contains:
colnames(stomach.dist)<- c("Closest.Gene","Start","distance")
colnames(sigmoid.dist)<- c("Closest.Gene","Start","distance")
We perform the mean and the median of the distance for each case:
mean.stomach<- mean(stomach.dist[,"distance"])
mean.sigmoid<- mean(sigmoid.dist[,"distance"])
median.stomach<- median(stomach.dist[,"distance"])
median.sigmoid<- median(sigmoid.dist[,"distance"])
We finally show the results by displaying them on a list. The code appears in the next image, together with the results: