Tutorial - PNNL-Comp-Mass-Spec/Q4SRM GitHub Wiki
To help ensure the proper usage of Q4SRM and also give users an initial test-drive using the tool, we have created this tutorial. It is designed to walk you through download, install and use of the program. The tutorial describes only the most basic features; other wiki pages have more detail on various options. If you have questions, please contact us through the GitHub Issues tracker.
Download and Install
We maintain the most current release of the Q4SRM software here on GitHub. The program is meant to be run on the Windows operating system. In this tutorial we will be getting both the software tool and also a data file for demonstration. Both of these can be found at the links below. Please do the following:
- Download the current release of Q4SRM from the releases page: GitHub Releases
- Extract/unzip the .zip file to the desired location
- Download the tutorial file: Tutorial.zip
- Extract/unzip the tutorial file to the same location as the Q4SRM files. When you have unzipped this tutorial file, you will see an SRM data file called Rush2_p14RR_62_26Oct17_Smeagol-WRUSHCol3_75x20a.raw. This data was acquired on a Thermo TSQ Vantage, with 161 peptides being monitored in both unlabeled and heavy-labeled versions, 3 transitions per compound, for a total of 966 monitored transitions.
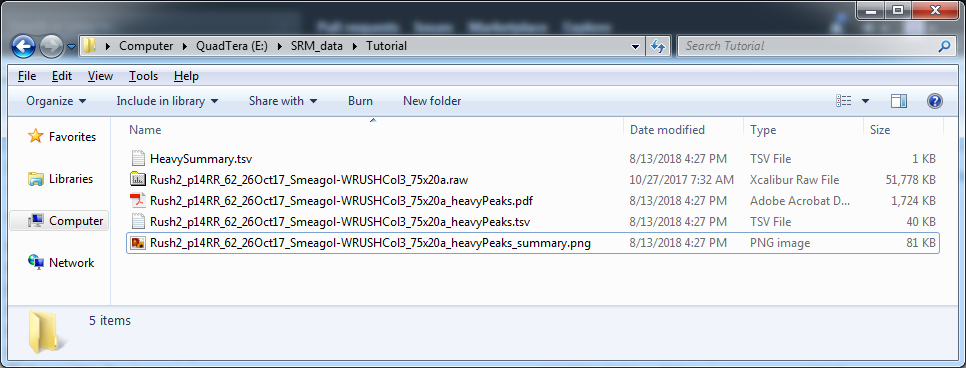
After data processing is complete following the tutorial below, you should see these files in the directory where the tutorial zip file was extracted:
Rush2_p14RR_62_26Oct17_Smeagol-WRUSHCol3_75x20a_heavyPeaks.tsvRush2_p14RR_62_26Oct17_Smeagol-WRUSHCol3_75x20a_heavyPeaks_summary.pngRush2_p14RR_62_26Oct17_Smeagol-WRUSHCol3_75x20a_heavyPeaks.pdfHeavySummary.tsv
These files are also available in Tutorial_Results.zip
Using the GUI
There are two ways to operate Q4SRM. Here we describe the graphical user interface (GUI) method. Use the steps below to analyze the test file with the GUI.
- Open the directory where the Q4SRM files were extracted
- Double-click
Q4SRMui.exe, which starts the program.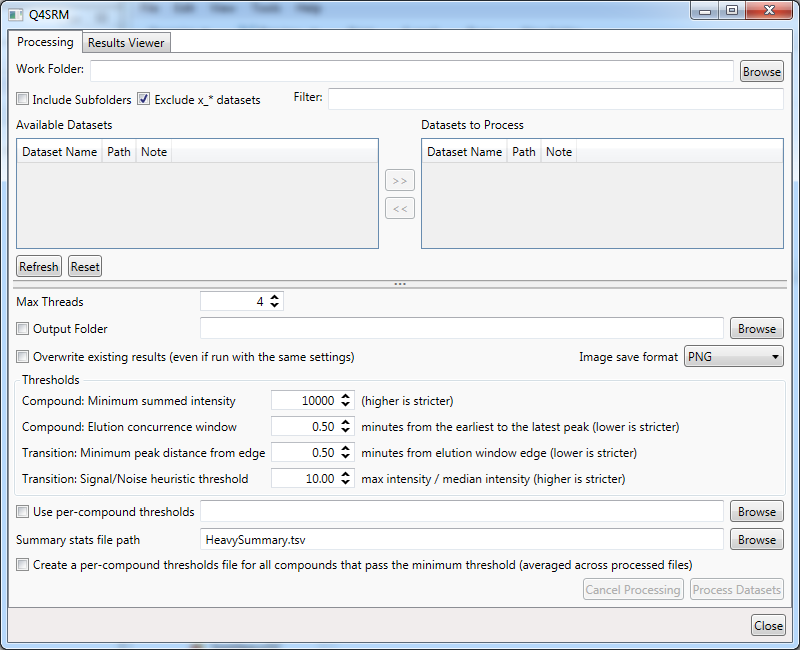
- First, you need to locate the .RAW files to process. The first input box at the top of the program is 'Work Folder'. Click on
Browseand navigate to the directory where the tutorial file was extracted - Select
Rush2_p14RR_62_26Oct17_Smeagol-WRUSHCol3_75x20a.rawand clickOpen - Now
Rush2_p14RR_62_26Oct17_Smeagol-WRUSHCol3_75x20awill appear after a moment in the main window underAvailable Datasets. You can select it and click the>>button to move it to theDatasets to Process - Set the threshold settings in the area below as follows:
Compound: Minimum summed intensityto500000Compound: Elution concurrence windowto0.50Transition: Minimum peak distance from edgeto0.50Transition: Signal/Noise heuristic thresholdto10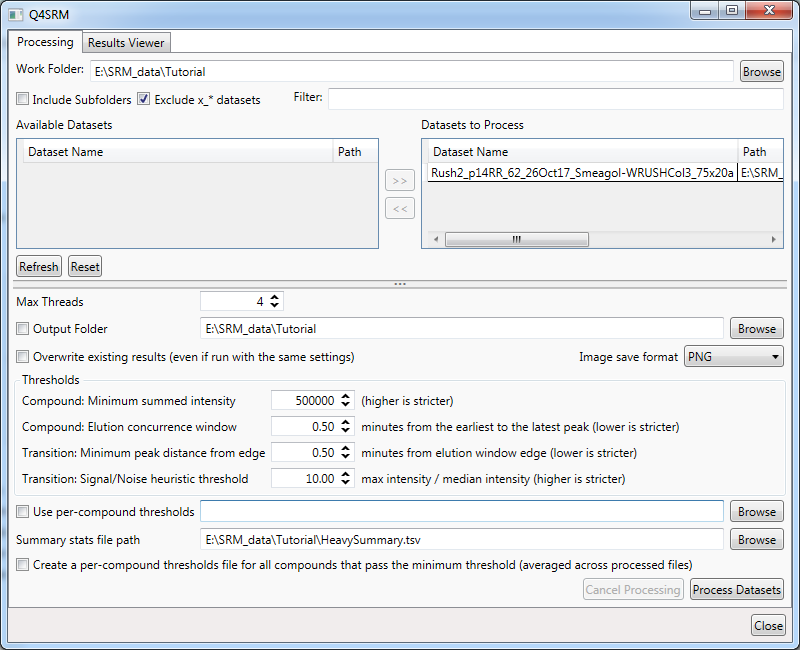
- Click
Process Datasets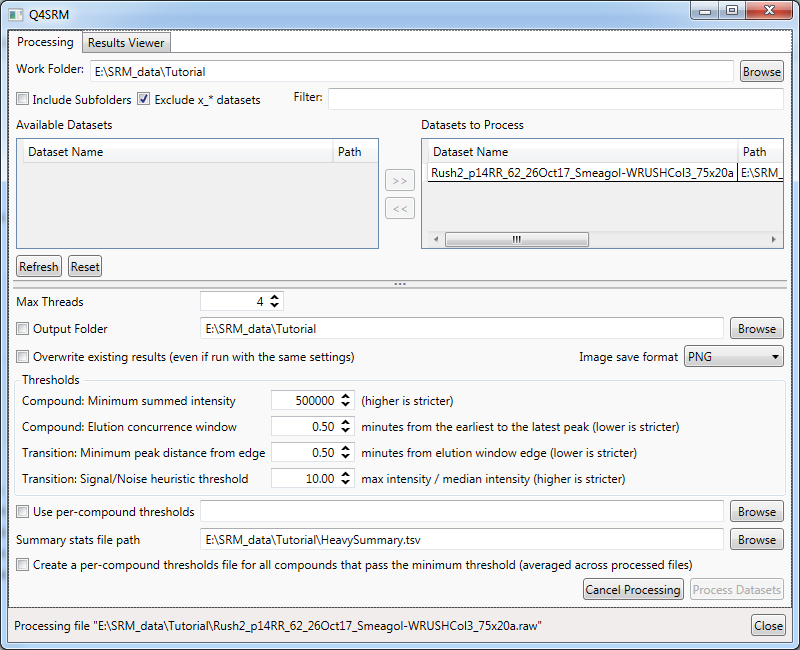
- When processing is complete, there will be a status message at the bottom of the window saying "Finished processing datasets." for 10 seconds, and the
Process Datasetsbutton will no longer be grayed out.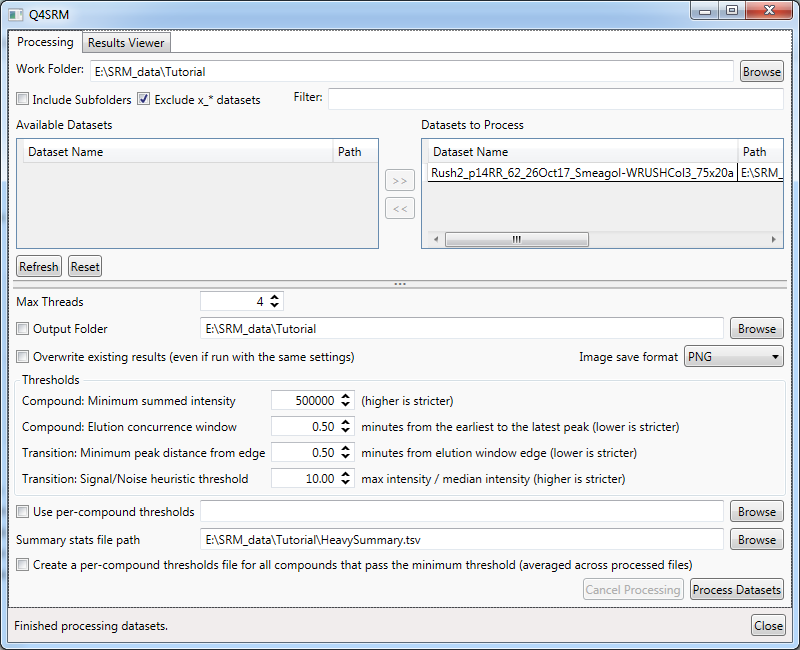
- Check for the output files mentioned at the beginning of the tutorial.
Using command-line
The second interface to the Q4SRM is through a command line. For the purpose of this tutorial, it is assumed that you know how to open a command prompt in windows and navigate to the appropriate directory containing Q4SRM. We note that for this tutorial the data file has been extracted to the same location as Q4SRM, i.e. Q4SRMcmd.exe and Rush2_p14RR_62_26Oct17_Smeagol-WRUSHCol3_75x20a.raw are in the same directory
- Open a command prompt at the directory where the Q4SRM files were extracted
- Enter the following command:
Q4SRMcmd.exe -raw Rush2_p14RR_62_26Oct17_Smeagol-WRUSHCol3_75x20a.raw
-t 500000 -m 0.5 -ec 0.5 -sn 10
- When processing is complete, the command-line prompt will appear again.
- Check for the output files mentioned at the beginning of the tutorial.
For more detailed information about the command line options, please read the wiki page for command-line tool usage.