Q4SRMui usage - PNNL-Comp-Mass-Spec/Q4SRM GitHub Wiki
Q4SRMui is the graphical user interface version of Q4SRM.
Primary Inputs
- Thermo .RAW SRM file, mzML file, or folder containing multiple such files (tested on files from TSQ Vantage and TSQ Altis)
- 64-bit OS: Thermo .RAW files are read using Thermo's RawFileReader library, more information available at Planet Orbitrap
- A license document for use of this library is included in the source code folder 'Lib', and also will be included in the binary download/installer packages.
- 32-bit OS: Thermo .RAW files are read using Thermo's MSFileReader library, which must be previously installed
- NOTE: Currently does not support mzML chromatograms; if creating the mzML file with ProteoWizard/msconvert, specify the '--srmAsSpectra' option
- 64-bit OS: Thermo .RAW files are read using Thermo's RawFileReader library, more information available at Planet Orbitrap
- If reading mzML file(s): a CSV/TSV file with the following columns:
- 'Compound Name': Name of the compound, also used to determine heavy compounds by finding "heavy" or "hvy" in the compound name
- 'Precursor (m/z)': Precursor m/z
- 'Product (m/z)': Product/transition m/z
- 'Start Time (min)': Elution window start time
- 'End Time (min)': Elution window end time
- Metrics controls
- (Optional) A TSV file with compound and threshold columns, for custom thresholds for the specified compounds
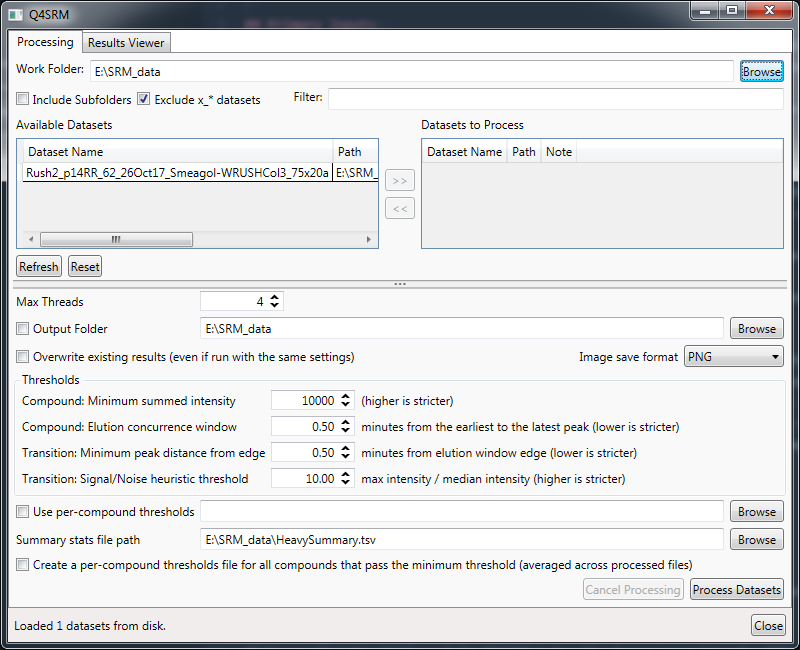
- A summed intensity minimum passing value (group of transitions); default is 10000
- A minimum distance (in minutes) that a 'peak apex' must be from the edges of its elution window (single transition); default is 0.5 (minutes)
- A maximum distance (in minutes) from the earliest 'peak apex' to the latest 'peak apex' in the compound (group of transitions); default is 0.5 (minutes)
- A minimum difference of the max intensity point vs. the median of intensity (single transition); default is 10
Outputs
- A TSV file with compound and transition information, and values signifying whether the compound/transitions passed or failed a metric
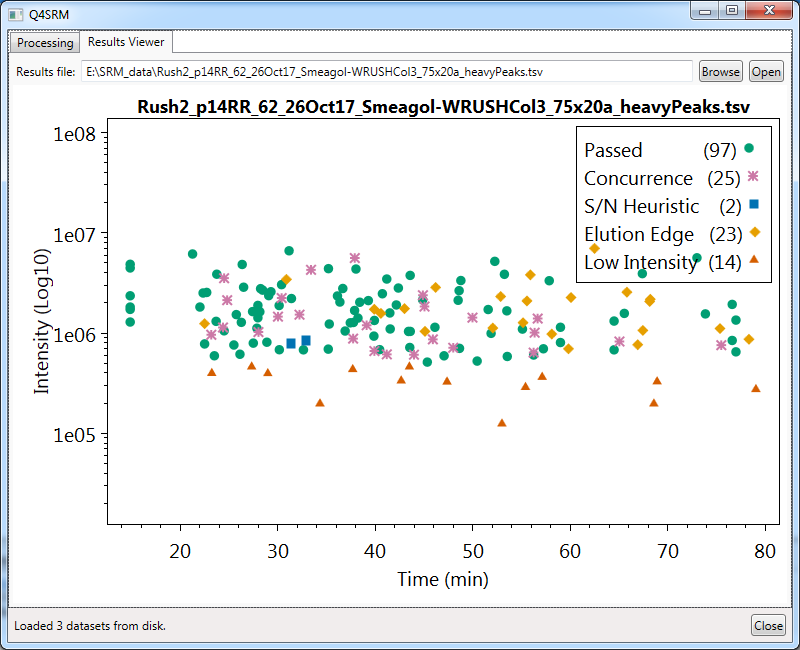
- An image file (default is PNG format, can also be JPEG, SVG, or PDF) showing a scatterplot of compounds with marks showing if they failed certain metrics, with axes of 'max intensity time' and 'max intensity'.
- A PDF that includes the scatterplot mentioned above, and also showing the chromatograms of each transition in each group.
- HeavySummary.tsv, which is a short summary file listing total heavy peptides and the number that passed the metrics for each dataset
Usage
Double-click Q4SRMui.exe to run the program.
Screenshots
Data processing
Viewing result plot interactively