Forest_plantations - PIK-LPJmL/LPJmL GitHub Wiki
Forest plantations
Introduction
Wood plantations are one of the Image forest management types. So far, these had no direct counterpart in LPJ; they were just part of LPJs natural stand. In practice, this meant that wood plantations have the same growing characteristic as natural forest. However, it is likely that biomass accumulation in dedicated wood plantations is higher than the natural situation. As such, a separate treatment of wood plantations in LPJ is favored. One reason is that when the wood plantation yields become higher, the deforested area can become smaller. For several reasons, simply representing IMAGE wood plantations to the existing “biomass_tree” stand in LPJ is no serious option as:
- The rotation cycle of coppice biomass trees is too short and these trees grow too fast
- The moment of harvesting is not steered by IMAGE
- The harvested wood does not enter the fast and slow timber pools (the yields are transferred to Image, the carbon just leaves the system)
- Harvesting does not account for harvesting efficiency as defined in
the ‘takeaway’ procedures.
In the process to add more realistic wood plantation to LPJ, two steps have been performed. Firstly as a proof of principle, the characteristics of LPJs biomass_tree were modified to mimic those of wood plantations. Secondly, a new stand type ‘wood plantations’ is added next to the original biomass_tree stand type. In this document we focus on the second step (Section 2). To obtain reasonable growing characteristics we performed a couple sensitivity runs. The results of these runs are discussed in Section 3. In Section 4 we show some first results of the impact of the extra stand type.
Building the wood plantation stand
The most important routine is annual_woodplantation.c. This routine is
based on annual_biomass_tree.c. Major changes occur in the harvesting
procedure. The routine coppice_tree.c is not used anymore. Instead, the
harvest is performed in the timber_harvest.c routine. In contrast to
coppice_tree.c, this routine does exactly what we want: harvesting
prescribed fractions (takeaway) of the different tree parts, putting the
non-harvested parts to the soil and litter pools, and distributing the
harvest to the timber pools (and biofuel). The moment of harvesting is
not based on (LPJ) rotation lengths, but steered by Image by the
variable timber_frac (indicating the grid-cell fraction that Image asks
to be cut). Then, for each pft (if tree) the routine timber_harvest.c
is called and the requested fraction is harvested. In timber_harvest.c
the tree density is adapted accordingly. After harvesting, the fpc of
the pft that was cut is updated by calling fpc_tree(pft). The entire
harvest section is between ifdef Image tags.
For the implementation of the extra stand, many other routines have been
changed as well. E.g. a new landusetype and cultivation type are added
and the number of crops has been changed. Although the woodplantation
are always rainfed also an irrigated crop is added for consistency (as
for the biomass trees). So all routines that use an array of cft’s are
adapted.
In par/pft_2layers.par, 2 woodplantation functional types (wft) were
added. One tropical tree, based on pft2, and one temperate tree, based
on pft5. Cultivation type = WP. See Section 3 for details.
For steering LPJ with the correct wood plantation fractions, an extra
crop was added to IMAGE (now 22).
To be consistent with the treatment of wood-biofuel, the interface and
Image were made compatible with receiving extra crops from LPJ (34
instead of 32).
The rotation lengths for wood plantations depend on plantation type
(short lived or long lived) and on the biome. They are prescribed in
image25\model\data\const\tes_FM_varFW.const in the Image zip file.
For land cover types 7 to 20 the values are given in the following
Table
| 7 | 8 | 9 | 10 | 11 | 12 | 13 | 14 | 15 | 16 | 17 | 18 | 19 | 20 | |
|---|---|---|---|---|---|---|---|---|---|---|---|---|---|---|
| SL | 0 | 70 | 70 | 70 | 25 | 25 | 25 | 20 | 20 | 20 | 20 | 8 | 8 | 8 |
| LL | 0 | 70 | 70 | 70 | 35 | 35 | 35 | 25 | 25 | 25 | 25 | 15 | 15 | 15 |
Characteristics of the woodplantation functional types (wft)
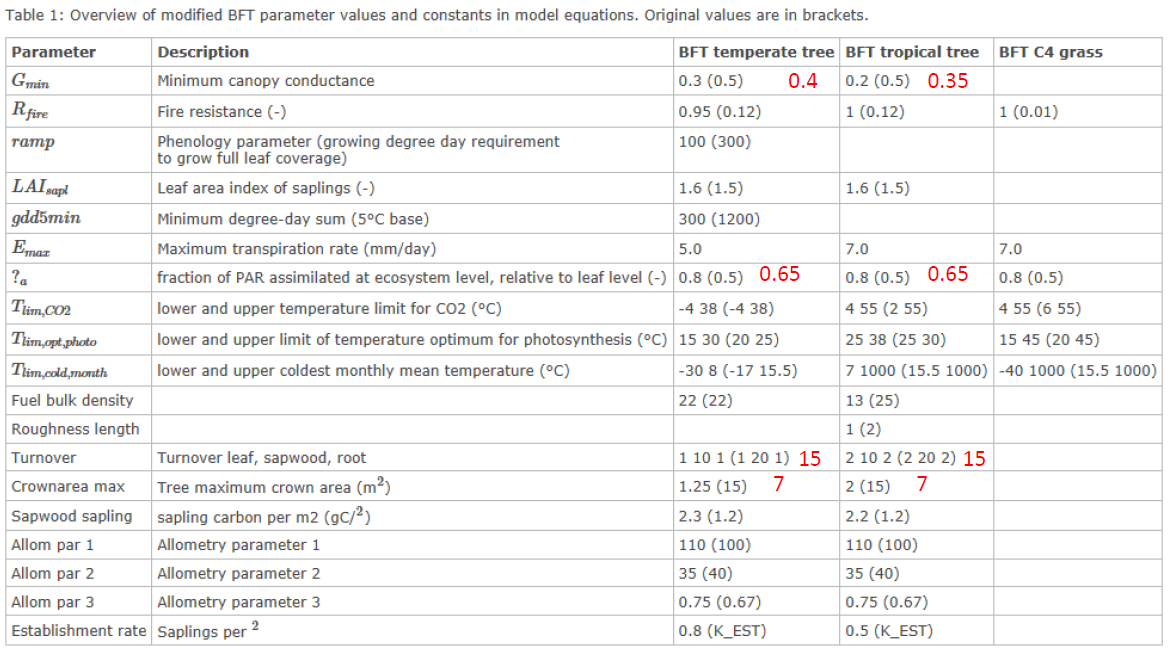
Having a separate stand for wood plantations, the growing characteristics of the wood plantation trees have to be determined. To get insight in the growing characteristics of trees, I performed some sensitivity simulations (all 1969-2005) with different settings for the wfts. As a starting point I took the values for the bfts. Differences between the bft and their natural equivalents are given in the Table below (taken from the PIK wiki).
Table from PIK Wiki: Modified BFT parameters. Red values are the
proposed setting for wfts, method to derive them described hereafter in
the text.
I started by copying the original pft parameter values to the wft type. Then I made a suite of simulations in which I progressively set more parameters to the bft value, see Table below
| Tag | K_est | Sapsap | Description |
|---|---|---|---|
| nowp\ | 0.12 | 1.2 | Reference no wp demand |
| wp_pft5\ | 0.12 | 1.2 | Wft set equal to pft |
| wp_pft5_08_23\| 0.8 | 2.3 | Wft set equal to pft but with default wp k_est and sapsap | |
| wp_pft5_08_23_1alfaa\| ,, | ,, | As previous but with alfa_a (?a in table) adapted | |
| wp_pft5_08_23_2gdd5min\| ,, | ,, | As previous but with gdd5min adapted | |
| wp_pft5_08_23_3camax\| ,, | ,, | As previous but with crownarea_ma adapted | |
| wp_pft5_08_23_4allom1 | ,, | ,, | As previous but with allom par 1 adapted |
| wp_pft5_08_23_5laisapl | ,, | ,, | As previous but with LAIsapl adapted |
| wp_pft5_08_23_6ramp | ,, | ,, | As previous but with ramp adapted |
| wp_pft5_08_23_7allom2 | ,, | ,, | As previous but with allom par 2 adapted |
| wp_pft5_08_23_8allom3 | ,, | ,, | As previous but with allom par 3 adapted |
| wp_pft5_08_23_9gmin | ,, | ,, | As previous but with Gmin adapted |
| wp_pft5_08_23_10photolim | ,, | ,, | As previous but with Tlim,opt,photo adapted |
| wp_pft5_08_23_11to | ,, | ,, | As previous but with Sapwood turnover. |
The Figure below indicates the average biomass for 19 selected European
wood plantation cells. These are all cells that were entirely cut in
1975 and became wood plantation by then. To analyze growth rates, it was
guaranteed that they were not cut/harvested again.
When only the values of k_est and sapsap are adjusted
(wp_pft5_08_023) to the bft values, the biomass accumulation is
roughly twice the nowp values. Still, the gap with the default bft
settings is large. The other simulations explore the importance of the
various other parameter differences between the pfts and the bfts.
(Probably effects of the parameters do not add linearly, but this at
least gives an indication of which parameters are important.)
The biomass values for this run #11 are exactly the same as for a run
with all bft parameters copied to wft. In 2005, the default natural
vegetation run has a biomass of 2000gC/m2 compared to 10500 gC/m2 for
run #11. Also in 2005, the growth RATE of the biofuel trees is roughly
twice the rate of the natural trees, which is quiet acceptable for wood
plantations (Jelle).

Figure 1. Average biomass accumulation for 19 cells spread over Europe
that became wood plantation in 1975.
Based on these results we first took the characteristics of the wfts
equal to the bfts. However, a simulation until 2100 showed that this
resulted in unrealistically large biomasses after several decades (up to
almost 50000 gC/m2 for the tropical forest). This is shown in Figure 2,
which shows the accumulation of biomass for the natural trees (left) and
for the bft trees (right).

Figure 2. Biomass accumulation of wood plantations for different biomes. Left: wfs equal natural pfts. Right: wfts equal bfts. Note the scale difference of the y-axis!
As a compromise, we opt for wfts that do have the fast increase of biomass of the bfts, but level of after a few decades. Therefore we modified the parameters of the wfts as indicated in Table 1. The resulting biomass evolution is show in Figure 3. The biomass increase is much faster than in the natural case (cf. Figure 2, left), but the growth curves level off much more than in the case of the biofuel trees (cf. Figure 2, right).

Figure 3. As Figure 2, but for wfts with a growing rate between natural
and biofuel trees.
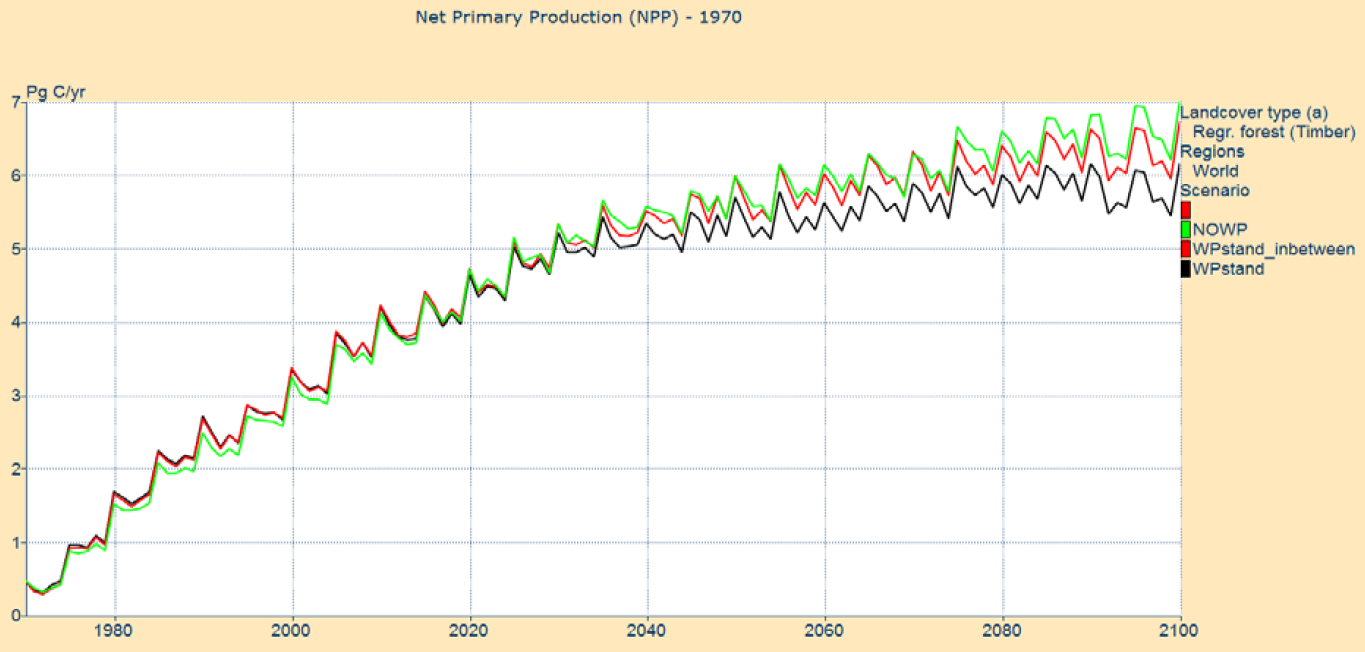
First results of runs with extra wood plantation stand
To test the impact of the extra stand, three simulations were performed:
- NOWP : Image wood plantations are natural stand in LPJ (default)
- WPstand : With the new stand, wfts equal bfts
- WPstand_inbetween: With the new stand, modified wfst
The Figures below give an indication of the impact of adding a separate stand for wood plantations. Although more detailed analysis is required, we conclude that the extra stand does what it is supposed to do, e.g., the harvested forest area decreases, the production of the wood plantations increases, and [CO2] becomes (slightly) lower in 2100.

Harvested wood biomass. Wood plantations (upper right), clear cut (lower right), selective cut (lower left), and total (upper left).

Biomass forest. Note that the y-axis does not start at 0!

Harvested forest area
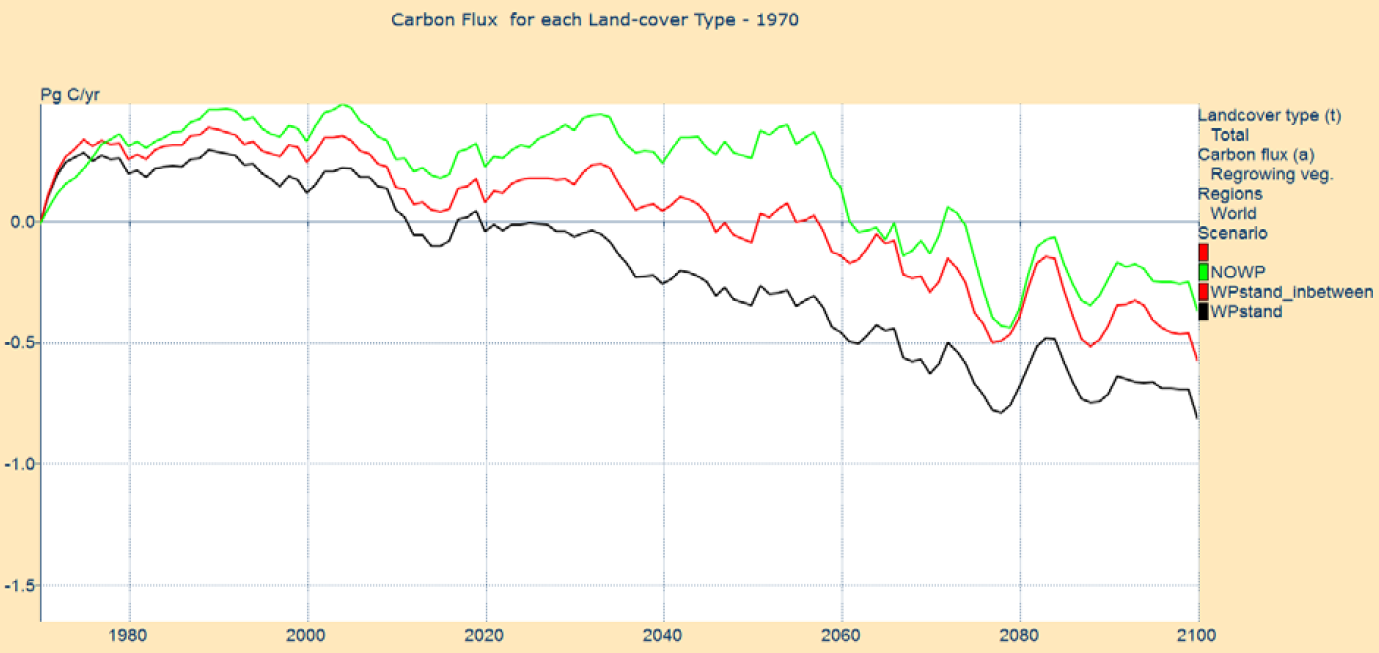
Carbon flux. Positive = emission, negative is uptake.

