Extraction Line Canvas - NMGRL/pychron GitHub Wiki
The location of all the items and how they are connected is defined in setupfiles/canvas2d/canvas.yaml. You can click the "Auto Reload" button in the Extraction Line Window then edit the canvas.yaml text file in a text editor e.g. VSCode. When the file is saved the canvas in pychron will update automatically.
This section describes how to construct and modify an extraction line canvas.
Two files are required to define an extraction line canvas.
-
setupfiles/canvas2D/canvas.xmlDefines the canvas elements.⚠️ Please note that theyamlformat is preferred -
setupfiles/canvas2D/canvas_config.xmlDefines globals parameters e.i origin, bgcolor -
Optional. setupfiles/canvas2D/alt_canvas.xmlDefines globals for the secondary canvas (Canvas displayed as a pane within a window). Useful for defining a smaller font when canvas displayed with Experiment or Spectrometer tasks.
First we need to define what our canvas will look like. We need to make a canvas_config.xml file which contains these important elements.
<origin> Shift the center of the canvas X,Y.
<xview> Left bounds, Right bounds.
<yview> Bottom bounds, Top bounds.
<color>. default colors for canvas elements.
<valve_dimension>. Change the default dimensions for the valves.
<root>
    <origin> 0,2.5 </origin>
    <xview> -25,25 </xview>
    <yview> -22,22 </yview>
    <color tag="bgcolor"> lightblue </color>
    <color tag="getter"> 0,215,70 </color>
    <!-- optional-->
    <valve_dimension> 4,4 </valve_dimension>
    <font> arial 12 </font>
</root>
The file starts with the standard <root> xml tag. All other elements will be children of root. The above snippet shifts the canvas origin up 2.5 units and sets the background color to light blue. The default color for "getter" elements is “green”. The left bounds of the canvas is -25 and the right 25 (width=50 units). The upper and lower bounds are -22 and 22 respectively (height=44 units). Optionally the font used for labels can be set using a font tag and the default size for valves set using valve_dimension.
Note. Defining the canvas is independent of defining hardware connections. Elements defined here need not have physical representations and in many cases this representation will be a more abstract conceptualization of the line, but (when built correctly) functionally identical.
yaml format is preferred over the xml format. The two formats are functionally equivalent, however some users find the yaml format less verbose and easier to read.
Now that we’ve established the characteristics & parameters of the canvas we can begin to populate it. The canvas is built using a number of basic components called stages, connections, valves, and objects.
Predefined Objects include:
'stage', 'laser', 'spectrometer', 'turbo', 'getter', 'tank', 'ionpump', 'gauge', 'rectangle', 'circle_stage', 'circle_laser'
Let’s construct an example canvas.xml file to see how it works.
The file starts with the standard <root> xml tag. All other elements will be children of root. Various graphical elements can be easily added to the canvas. Let’s start with a stage element. Stages are generic areas that connect multiple valves or objects. Physical examples of stages would be a manifold, cross, tee, etc.
<root>
    <stage>Bone
       <translation>10,5</translation>
       <dimension>5,2</dimension>
       <color>255,0,0</color>
    </stage>
</root>
The above snippet defines a stage ID named “Bone” that is 5 units wide, 2 units tall and positioned 10 units to the right and 5 units above the center of the canvas. The color of the stage is defined using the color tag and is red in this case- 255,0,0 (R,G,B). By default the name of the stage is rendered but can be disabled using display_name=" ".
<stage display_name=" ">Bone
Furthermore, you can display a name different from its ID. For example:
<stage display_name="High Vac">Bone
Would display 'High Vac' instead of Bone, however when connecting stages to valves, objects, and/or other stages, you will always use the ID assigned to the stage and not the display name.
Valves are one of the few interactive elements within the canvas. Besides providing a visual representation of the extraction line, they can be used to exert manual control over the line and show the current state of the valves (open/closed). These include:
'valve', 'rough_valve', 'manual_valve', 'switch'
The first two can be tied to remote automation of the physical valves represented in the canvas. Manual_valve serves as a digital representation of a manually operated valve. The final object, switch is a digital toggle that can be tied to any sort of physical or digital binary operation.
Objects are similar to stages in that you can set their translation, dimension, color, etc., but are unique in that they follow a hierarchy when stage coloring (see further below).
Once you begin populating the canvas you can begin to connect objects and valves together. Here is an example canvas.xml showing a mass spec, ion pump, and a valve between them. Note the objects <spectrometer> and <ionpump> instead of the generic <stage> tag. This will be relevant for stage coloring.
<root>

    <spectrometer>HelixMC
        <color>85,110,180</color>
        <translation>24,30</translation>
        <dimension>20,7</dimension>
    </spectrometer>
    <ionpump>MSIon
        <color>94,155,196</color>
        <translation>39,20</translation>
        <dimension>5,8</dimension>
    </ionpump>
    <valve>A
        <translation>33,21</translation>
        <dimension>4,4</dimension>
    </valve>

    <vconnection>
        <start>A</start>
        <end>HelixMC</end>
    </vconnection>
    <hconnection>
        <start>A</start>
        <end>MSIon</end>
    </hconnection>

</root>
This will render the following on the canvas.
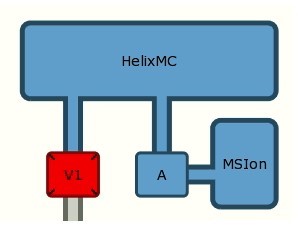
The two main connection types are horizontal <hconnection> and vertical <vconnection>. The choice for the <start> & <end> object will entirely depend on what you're connecting. Notice in the above example, the <start> connection to the <spectrometer> is valve A each time. If done in reverse, the connection from <spectrometer> to valve A would start from the origin of <spectrometer> which is offset from the <valve>. As a general rule, when connecting valves & objects, the <start> should be the valve.
There also exists an <elbow> connection and uses the same format as <connection>:
<elbow>
     <start>Valve</start>
     <end>Object</end>
<elbow>
Sometimes a <connection> will require an offset to graphically line up the connection itself, and is more often encountered when connecting two stages of different dimensions. This would be included in the <start> or <end> object as:
<hconnection>
     <start offset="0,1">Object</start>
     <end>Object</end>
</hconnection>
The stage coloring is a helpful tool to quickly assess the status of connections and shared vacuum within the preparation system and is based on the color of the <object>. Default coloring for objects can be defined in the canvas_config.xml or per object in the canvas.xml. Below is an example of the line shown in two states, with either valve A open or closed. Depending on the connection, either the ion pump or the spectrometer will take priority for stage coloring.
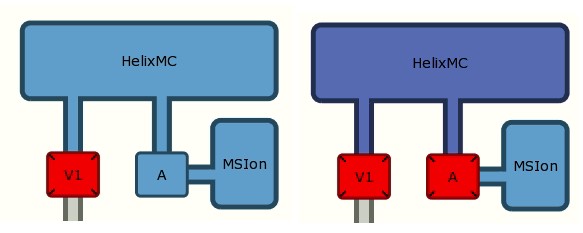
The hierarchy for stage coloring is as follows:
turbo > laser|pipette > tank > spectrometer > getter > stage
This means the stage coloring for a turbo will take priority over the coloring for a tank, which will take priority over a getter, etc.