Data Analysis - MyLab-odyssey/ED4scan GitHub Wiki
The logging function is intended to be used to capture data while charging or a discharge with the PTC heater. It is not tested while driving and should only be used while the car is parked! THE USAGE WHILE DRIVING WILL BE ON YOUR OWN RISK!
Take a look at the cell voltages, the calculated cell resistance and the cell capacities:

Is the balancing doing well? Are outliners present? Is there a cell - beside the reference cell - that does not behave normal?
I was wondering what has changed from ED3 to the ED4, as the battery seems to have the same capabilities and can store 17.6kWh of energy.
Daimler added three more cells to the pack but still give the same specification: a nominal voltage of 339V, capacity 52Ah, 17.6kWh. With the old E18-1 battery (451 series) this data is plausible: 93 cells with a mid cell voltage of 3.65V give 339V * 52Ah = 17.628kWh of energy.
The new battery E18-2 (evo) used in the ED4 (453 series) carries 96 cells and this would sum up to 350V nominal voltage for the pack. New cells from LG should have a mid voltage of about 3.7V giving the pack a nominal voltage of 355V. That would imply a capacity of about 49.7Ah. But what are the real figures? So first let's do some discharge- / charging-tests (Find my thoughts about the capacity measurement here):
The car uses a PTC heater element for the cabin thermo-management. It is connected to the HV network and will get the energy directly from the traction battery. In the new ED4 is is pulsed, so it will not draw a constant current. In my test a mean current of about 7.6A was established, resulting in about 2.3kW of power drain. The Battery Management System (BMS) uses four different SOC (State of Charge) variables: the user SOC and three real SOC values for the minimum, maximum and average:

When the weakest cell is reaching a cell voltage limit of 2.95V the system will shut down the PTC heater and refuses the 'Ready' state for driving. Without load the cell voltages will quickly recover to an Open Circuit Voltage (OCV) as you can see (I did not try the 'limp-home' function).
But now take a closer look at the voltages! Doesn't something puzzle you? Why we get a plateau and no further, steep drop in the voltage, as normally seen when discharging a battery? The power of the PTC heater was pulsed, but the mean current was almost constant. The slope of the user SOC is also almost linear and aligns parallel to the other rSOC's. So let's plot those figures vs. the real SOC (rSOC):

A typical point for the Li-Ion discharge is the 7% Knee Point. Sliding the slope of the rSOC to the voltage curve, we can guess a target of 3V as End Discharge Voltage . The reference cell is slightly lower, but still in a safe range.
When you have an idea about the measured plateau, please let me know!
After discharging into the shutdown event, the battery was not used for about an hour to settle cell voltages and allow the BMS to recognize it's state. Charging was done with the internal charger at 20A from mains (single phase) with 4.6kW power:
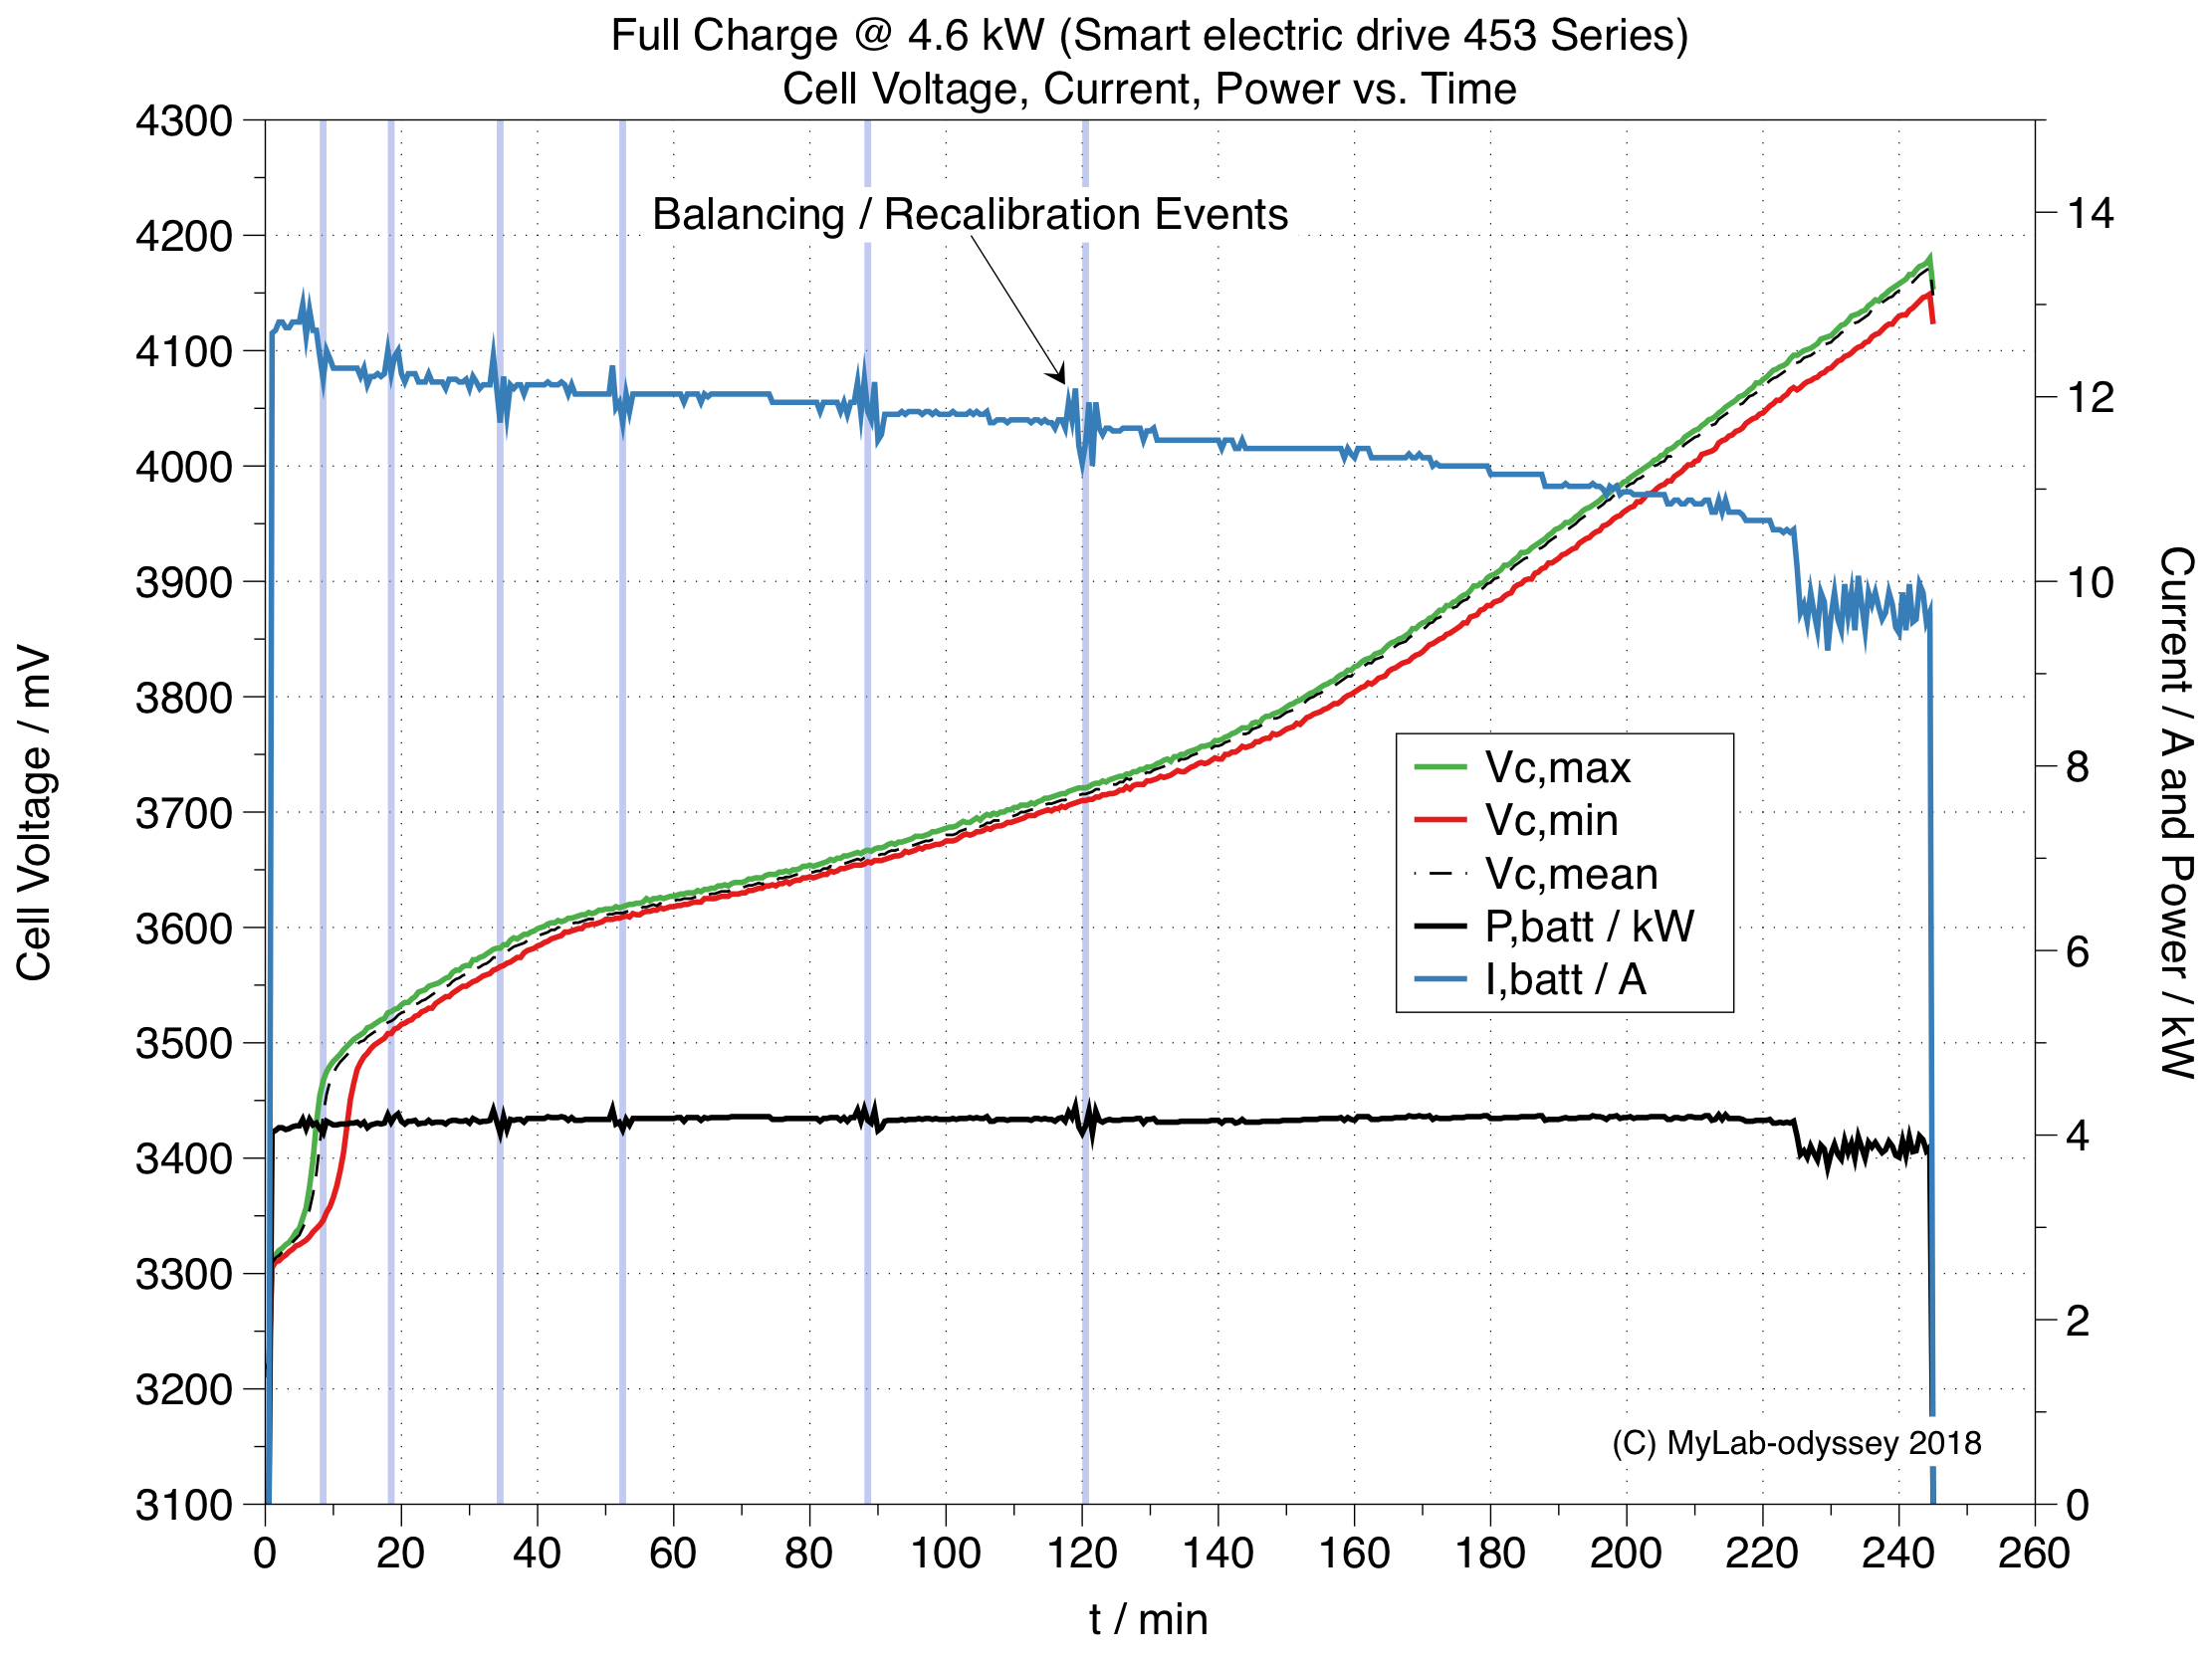
During the charge you can see some fluctuations within the battery current. They are present at some remarkable points in the voltage slope and represent calibrations of the BMS. By examing the bms log you will find correlating points of a SOC drops during the charge. So there seem to be balancing activities also occuring within these phases?! The fluctuations are definately not present in the HV charger output and are only observable in the internal battery current:

As mentioned the system will use four SOC values. For the 'user window' of intended usable energy the SOC is displayed in the dash. The value from the BMS differs slightly from the dashboard (± 1%) depending on driving habits. ED4scan will only use the BMS value.
Internally the BMS track three realistic SOC values: rSOC as average, rSOC,min showing the SOC of the weakest cell and rSOC,max for the strongest cell:

Under 10% the rSOC is mapped to rSOC.min and above 90% it equals rSOC,max.
We can proof the thesis of dedicated rSOC values by plotting the min., max. and average cell voltage against the corresponding rSOC:
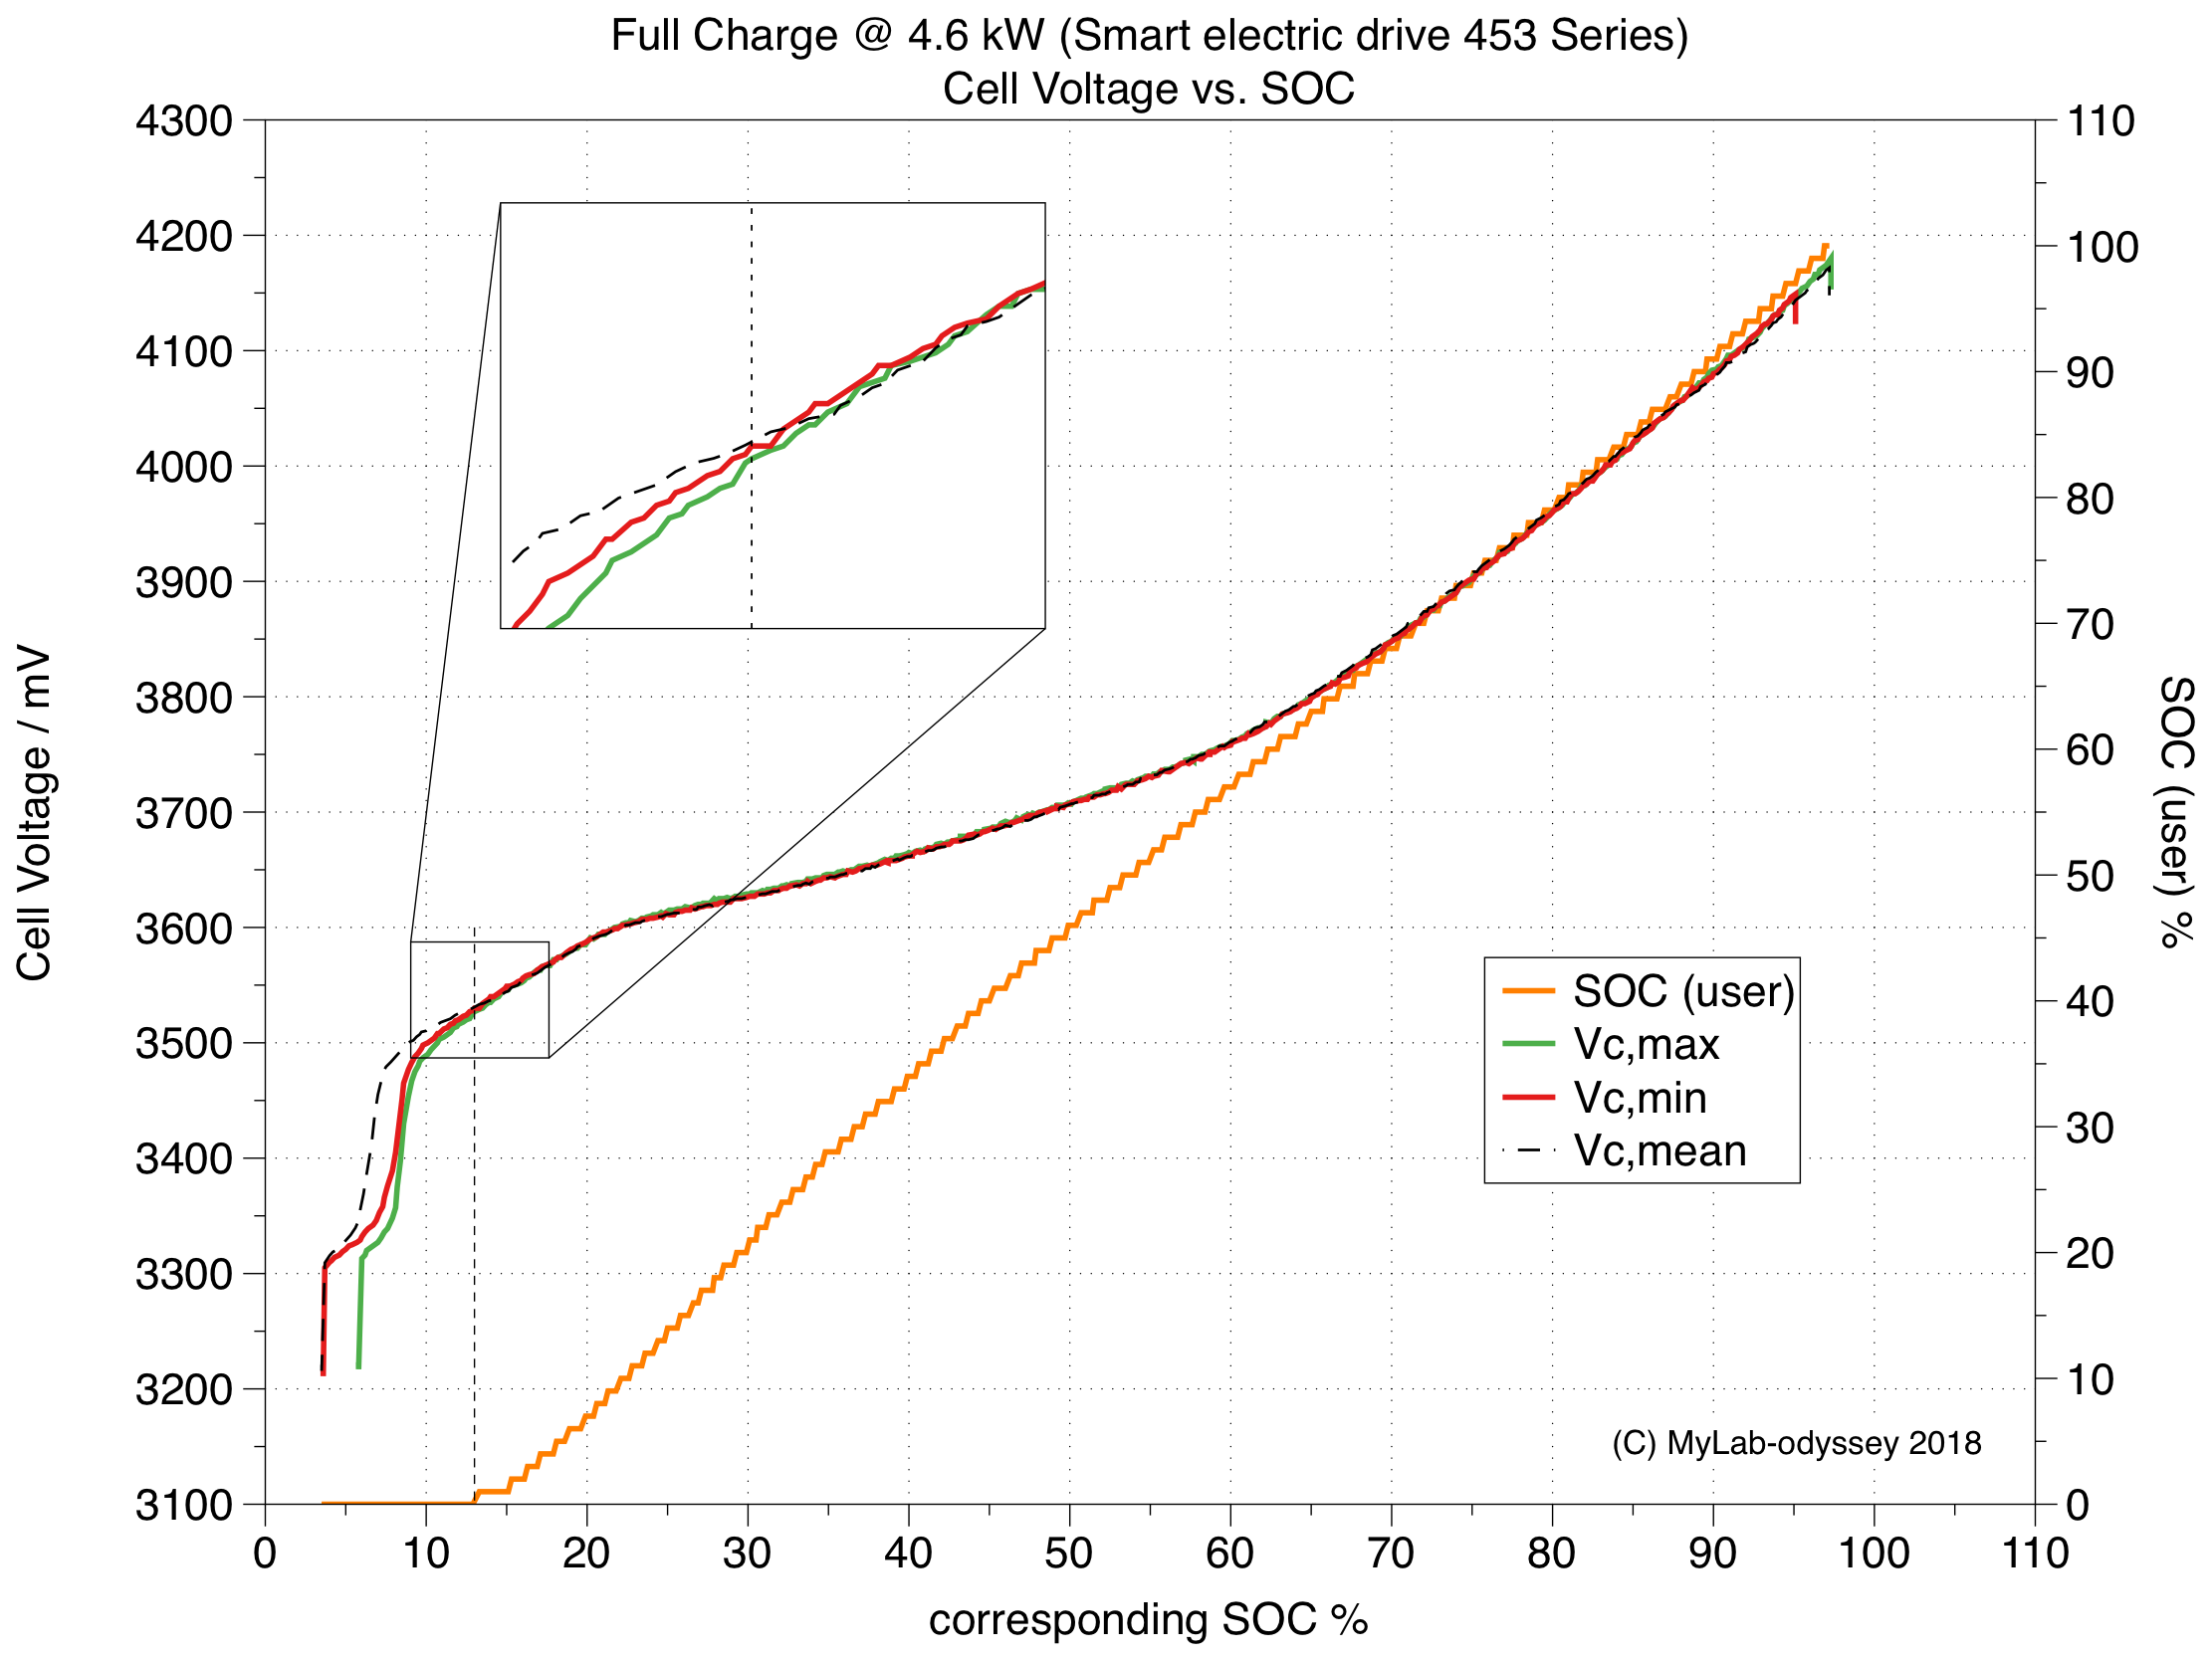
This will result in almost common voltage slopes. They will only differ below ~13%, exactly from this point the user SOC is starting and the three slopes of min., max. and average voltage get into the same error window.
So now we examine the full charge: How much energy was stored within the pack? During the logging data was recorded every 30 seconds and we can sum up by using a 'Riemann Sum' to get the cummulative Ah and kWh:

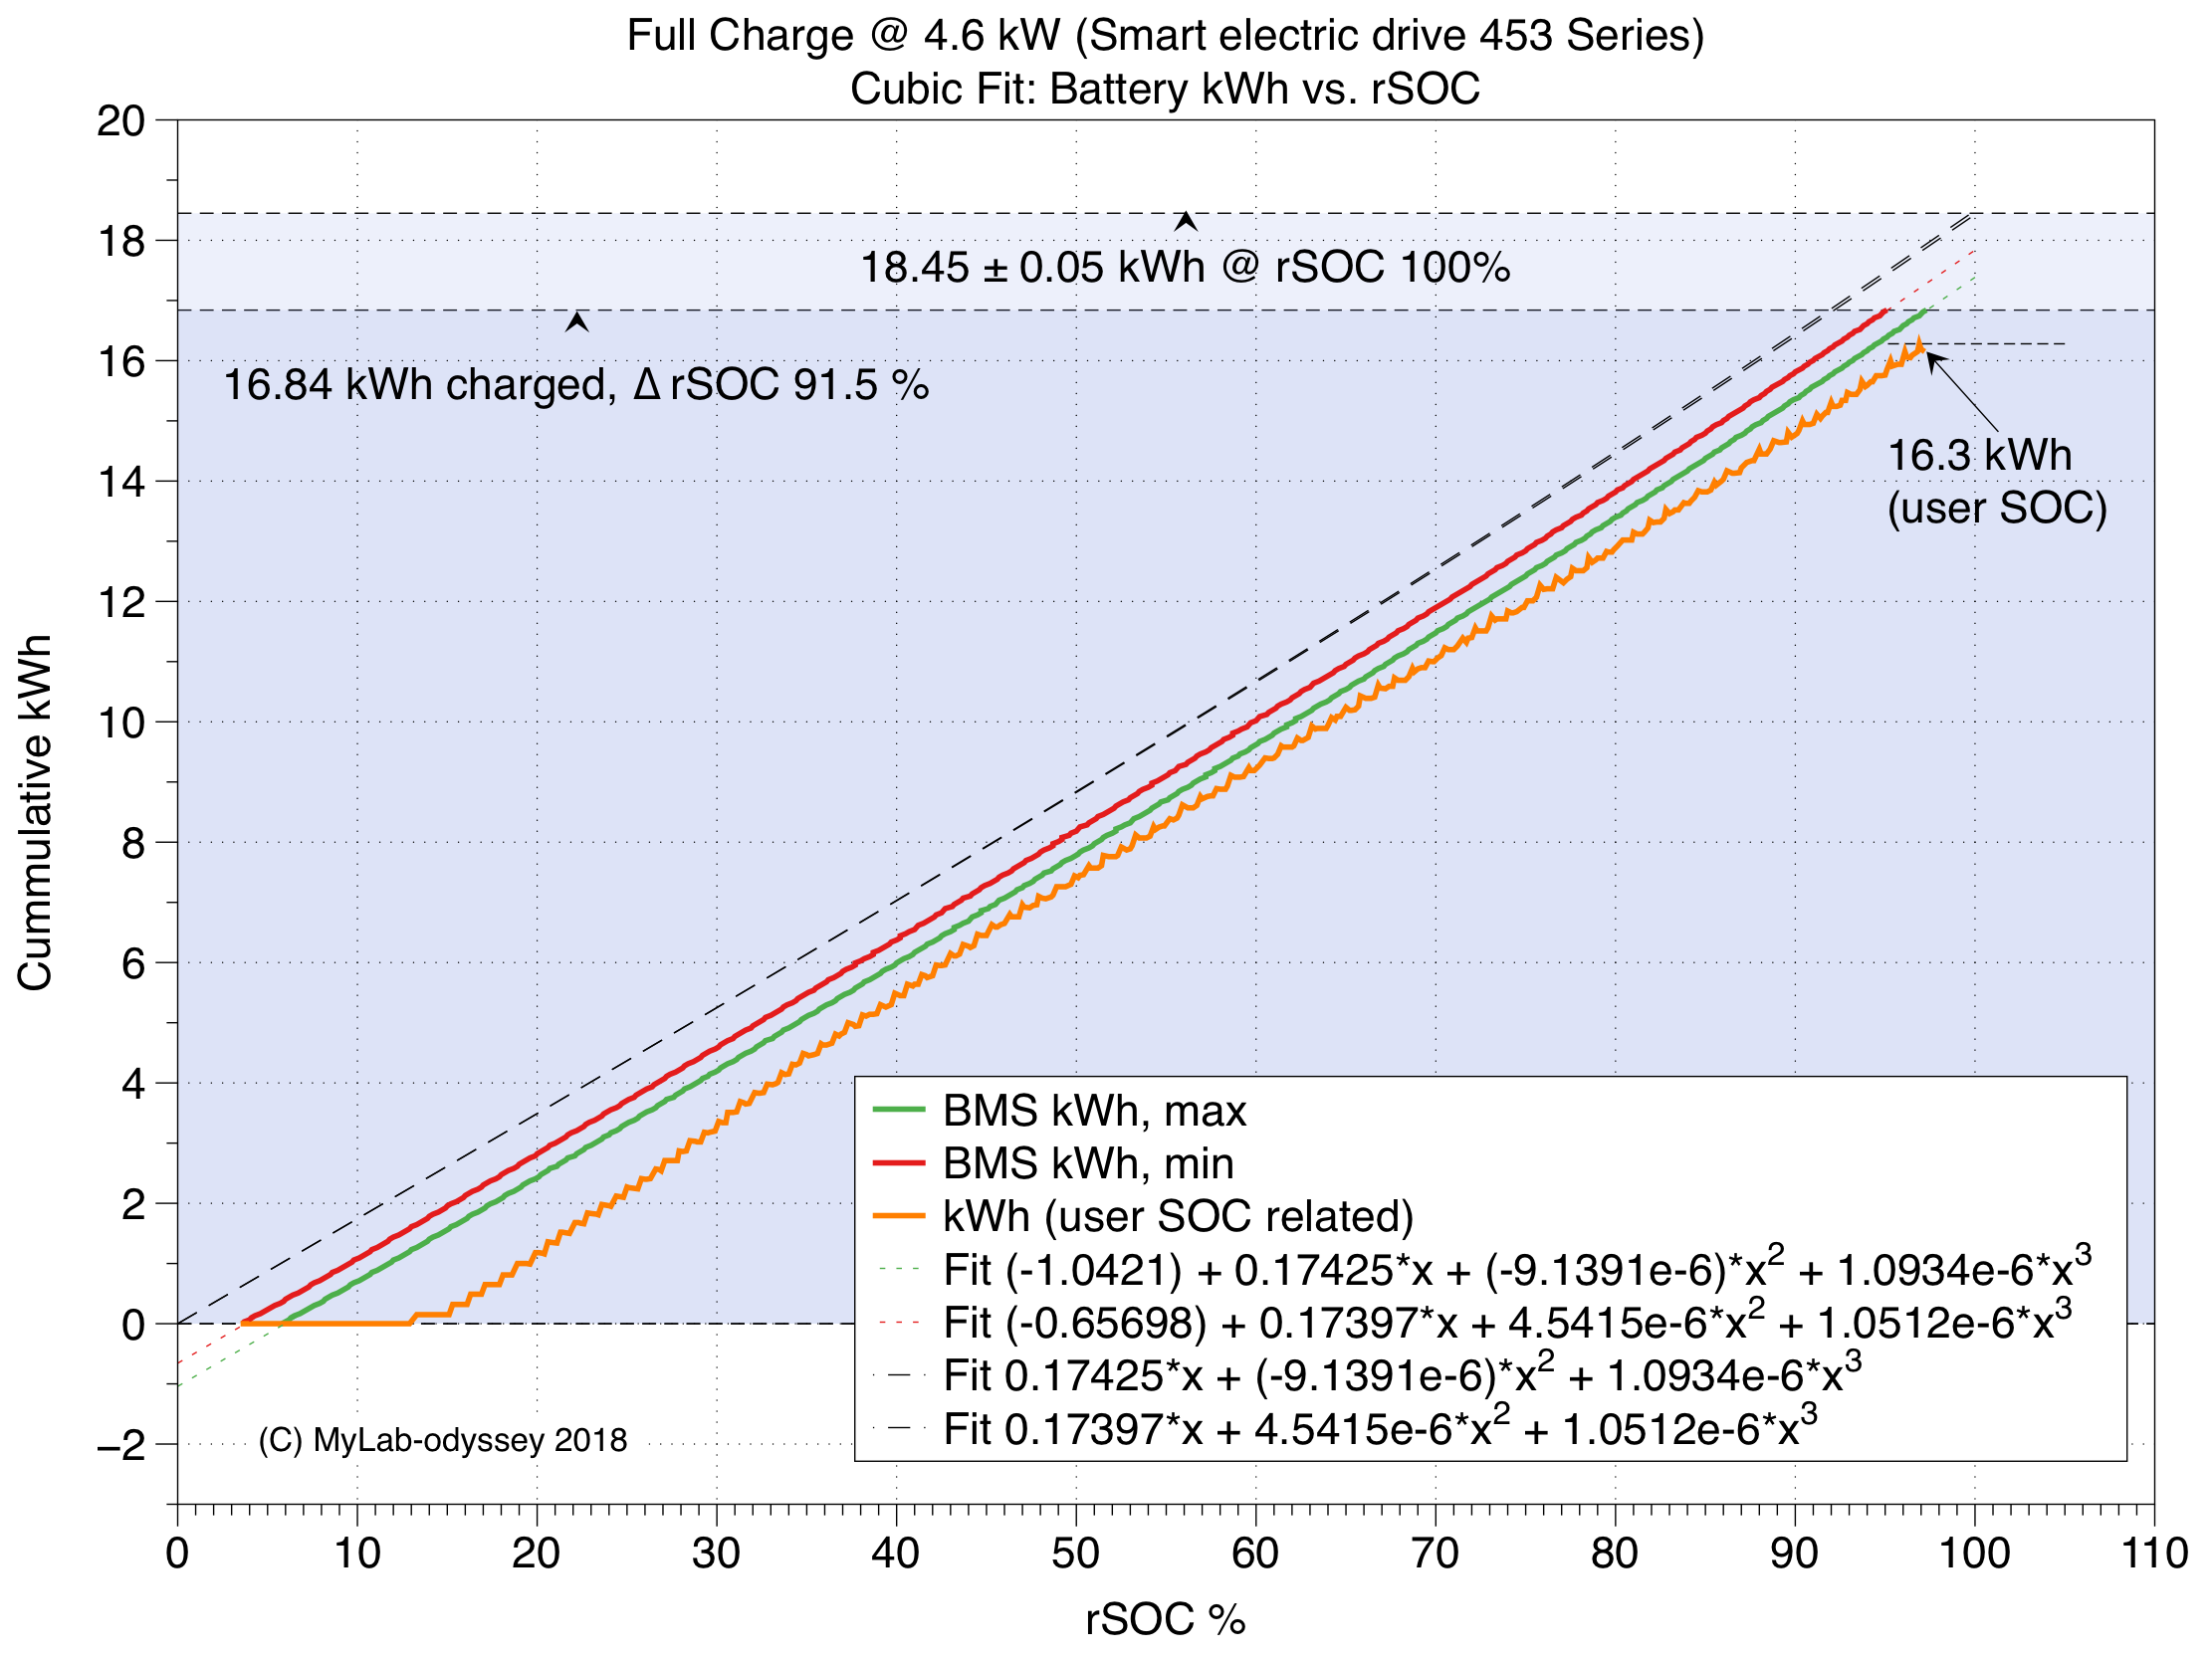
With a curve fit we can predict the maximum capacity / energy of the battery. To get a fit for the amp-hours a linear fit will be sufficient, showing a capacity of at least 51.07 ± 0.01 Ah. To extrapolate the energy we get a good, reliable prediction when using a cubic fit that results in a total energy of at least 18.45 ± 0.05 kWh for the complete pack.
The usable energy window is limited to about 16.3kWh and reflected by the user SOC in the dashboard. Take a look at the slope for both values. The SOC will increase in full steps of 1%, whereas the energy counter can also decrease during the charging. It will reflect the actual usable energy and losses of the continuous balancing is definitely included.

Depending on the balancing state of the battery the predicted energy beyond the zero-point will vary and driving the car to the limits may result in an unsuspected 'breakdown' and shut-off of the car. So please be careful unless you know exactly the remaining energy ;-)
Above ~40% the user SOC will report more energy than a linear slope. Under 40% it will report less energy, so a save reserve of about 1.5kWh is still usable when it reaches zero. This will ensure that there will be enougth energy under all driving scenarios and bad weather conditions.

But why is Daimler rating it to be 17.6kWh? This time they really incorporated a headroom for aging, as you can see from the charging behavior. The battery never goes into a dedicated CV phase, where the charging voltage is constant and the current is exponential lowered to fill up the cells completely. The energy window will probably move during the aging of the battery and they decided to use a self defined nominal voltage for comparison and normalization. That will also allow future use of other cells than the current ones from LG and still state the same specification and range for the car. Find my thoughts about the capacity measurement here.