Transfection_Efficiency_Tool - MontpellierRessourcesImagerie/imagej_macros_and_scripts GitHub Wiki
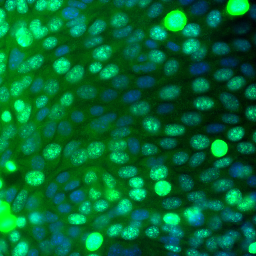
The tool helps to measure the transfection efficiency. It reports the percentage of transfected cells in the image. It has tools to manually correct the segmented nuclei (merge and split).

The source code in git-hub can be found here.
Getting started
To install the tool save the file transfection_efficiency_tool.ijm into the folder macros/toolsets of your FIJI installation.
Select the "transfection_efficiency_tool" toolset from the >> button of the ImageJ launcher.
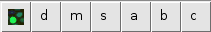
- The first button (the one with the image) opens this help page
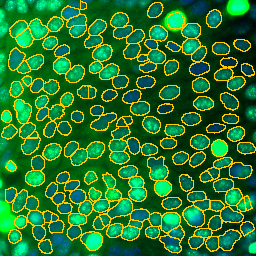
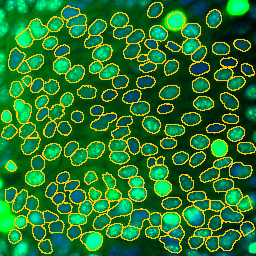
- Press the d-button to detect the nuclei
- Press the m-button to activate the merge-tool for manual editing
- Make a line selection and press the s-button to split a nucleus
- Press the a-button to get the sorted intensity measurements of all nuclei
- Select a line in the results table and press the b-button to highlight the nuclei with a mean intensity above the selected one
- Press the c-button to count and report the transfected nuclei
Nuclei detection
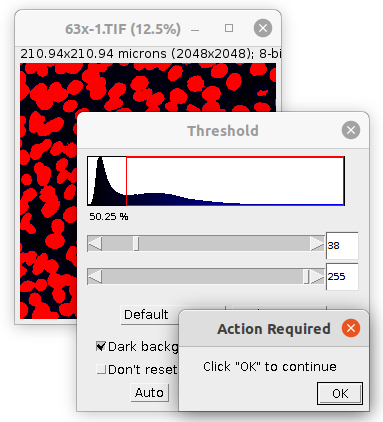
Select the channel of your image, that contains the DAPI-staining of the nuclei. Press the d-button. You are asked to manually adjust the threshold. When done, press the ok-button on the *Action Required"-dialog.
Options
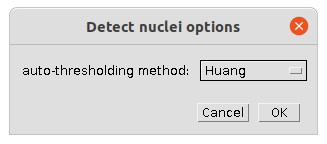
- You can select the auto-thresholding method used before manual correction, when the threshold-tool is opened
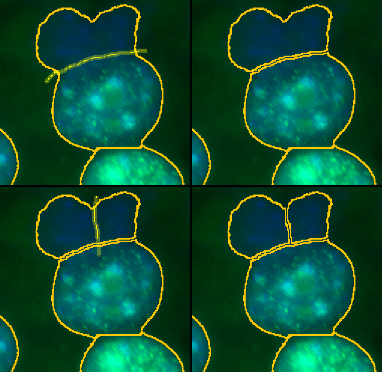
Merge Tool
Press the m-button to activate the merge tool. Click into one part of a split nucleus. The selected roi will be displayed in green. Now click into the second part of the nucleus. The two parts will be merged.
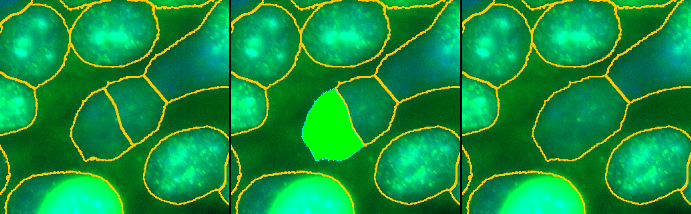
Split Tool
Make a line selection at the place where you want to cut the roi and press the s-button. Make sure the line goes a bit further than roi-boundary on each side. The roi will be cut into two.
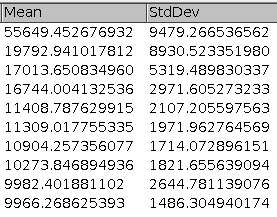
Analyze Tool
Select the channel containing the signal for which you want to measure the transfection on the image. Press the a button to get a result-table with the mean-intensities of nuclei sorted in descending order.
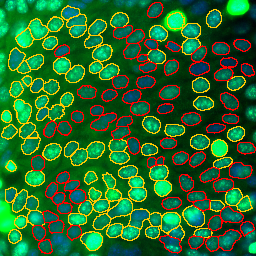
Below and Above
Select a line in the results table and press the b-button. The nuclei below the intensity value from the selected line, will be marked in red in the image.
Count transfected cells
Press the c-button to count the transfected cells and add the result to a table. If the rois have been coloured (see the last step) and the threshold value set in the options (see below) is -1, the non-red rois will be counted. Otherwise the nuclei above the given threshold value will be counted.
Options
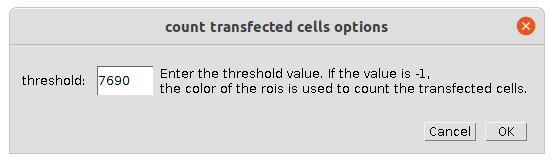
- threshold - nuclei with a mean intensity above the threshold will be considered as transfected. If the value is -1, the rois previously coloured red will be considered as non-transfected instead.