Track_Microtubules_Tool - MontpellierRessourcesImagerie/imagej_macros_and_scripts GitHub Wiki
The tool allows to track the ends of fluorescently labelled microtubules, which are becoming shorter and to measure the speed of the movement of each end. It also creates kymograms and plots distance-per-time.
You can download an example time-series here: 190510_TIRF_MT488_1ulKIF2A_1.tif
The source code in git-hub can be found here.
Getting Started
To install the tool save the files MRI_Track_Microtubules_Tool.ijm and microtubule-tracking.py into the folder macros/toolsets of your FIJI installation and restart FIJI. You need to have FeatureJ and StackReg installed.
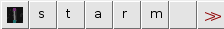
Select the "MRI_Track_Microtubules_Tool" toolset from the >> button of the ImageJ launcher.
- the first button (the one with the image) opens this help page.
- the s-button aligns the frames in the time-series in a given folder using StackReg.
- the t-button detects the ends of the microtubules in the image and tracks them.
- the a-button adds the currently selected microtubule to the selection of the microtubules to be measured
- the r-button removes the currently selected microtubule from the selection of the microtubules to be measured
- the m-button measures the speed and creates the kymograms and plots of the microtubules in the selection
Usage
Alignment
If the is a drift in the time-series, i.e. the whole is moving, this must first be corrected. The frames of each time series can be aligned by pressing the s-button. Right-click on the s-button to open the options-dialog and set the file extension of your images, for example nd or tif. Press the s-button and select the folder containing the images. The aligned time-series will be written into a subfolder reg of the input folder. Stackreg is run with the Rigid Body option which allows to correct for translations and rotations.
Track Microtubules
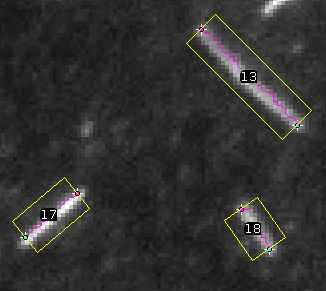
Open an image and press the t-button. The microtubules are segmented and the ends are tracked. The end points and the tracks will be added to the overlay of the image. A rectangle around each detected microtubule is added to the roi-manager. You will use these rectangles in the next steps to decide which microtubules to measure.
A LoG-filter is applied to the image using the Laplacian-command of FeatureJ. The result is converted to a mask and objects touching the borders are eliminated. The microtubules are then skeletonized. The skeltons are used to find the end points of the microtubules and to track their movements towards the center of the microtubule.
Select which microtubules to measure
Select correctly segmented and tracked microtubules. Click on the label of a microtubule and use the a-button to add it to the selection. Its surrounding rectangle will become green. Use the r-button to remove a selected microtubule from the selection. Its surrounding rectangle will become yellow again.
Measure the selected microtubules
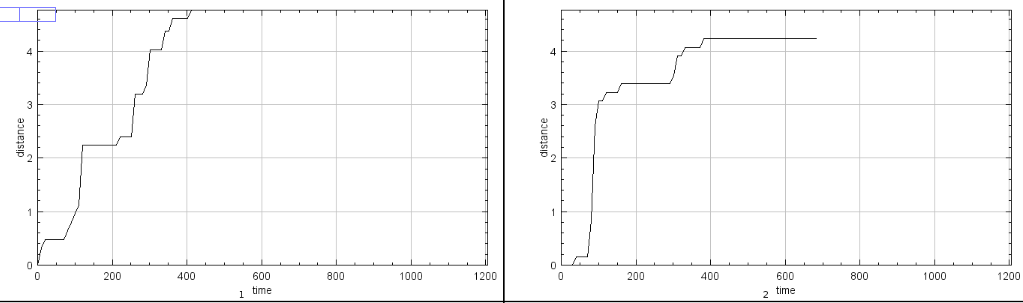
Press the m-button to measure the selected microtubules. The result table will contain one row for the two ends of each microtubule. Speed, length of the track and the distance from the start point to the end point will be measured.

A plot of the distance per time for each end of a microtubule is created.
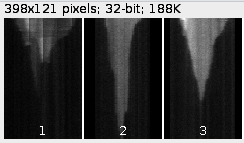
For each microtubule a kymogram is displayed.
Options
Stack registration
Right-click the s-button to open the options dialog:
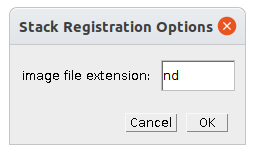
- image file extension - the file extension of the input images (for example
ndortif)
Microtubule Tracking
Right-click the t-button to open the options dialog:
![]()
- smoothing scale - the smoothing scale of the LoG filter (i.e. the sigma of the Gaussian)
- width of rectangle - the width of the rectangles that are drawn around the detected microtubules
Measurements
Right-click the m-button to open the options dialog:
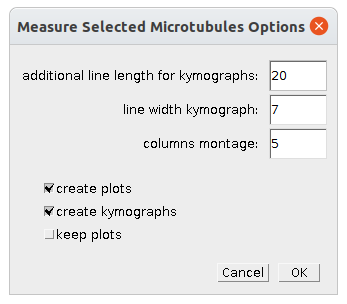
- additional line length for kymographs - the line for creating the kymogram is made length/2 longer at each end to make it easier to interpret
- line width kymograph - the width of the line for creating the kymograms
- columns montage - the number of columns of the montage of the kymograms and plots
- create plots - when selected the plots are created
- create kymographs - when selected the kymograms are created
- keep plots - when selected the individual plots are kept open after the montage has been created