Skin Tools - MontpellierRessourcesImagerie/imagej_macros_and_scripts GitHub Wiki
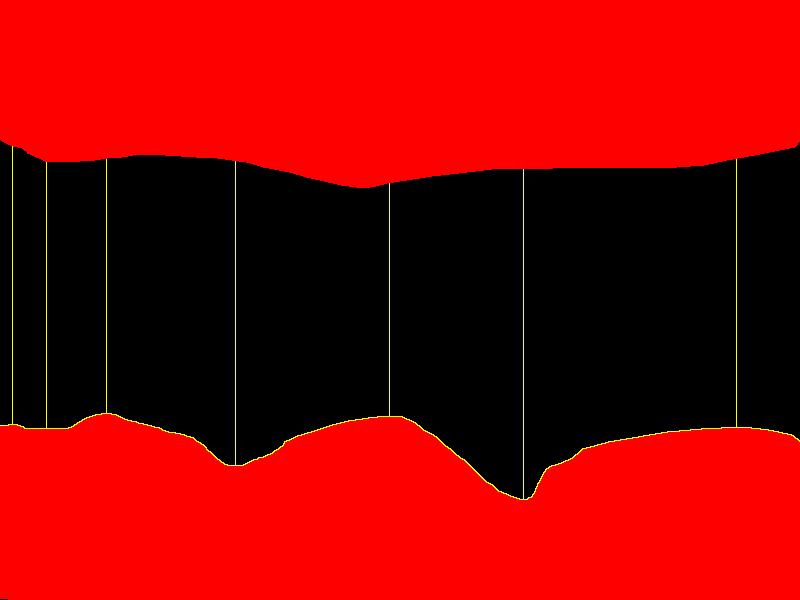
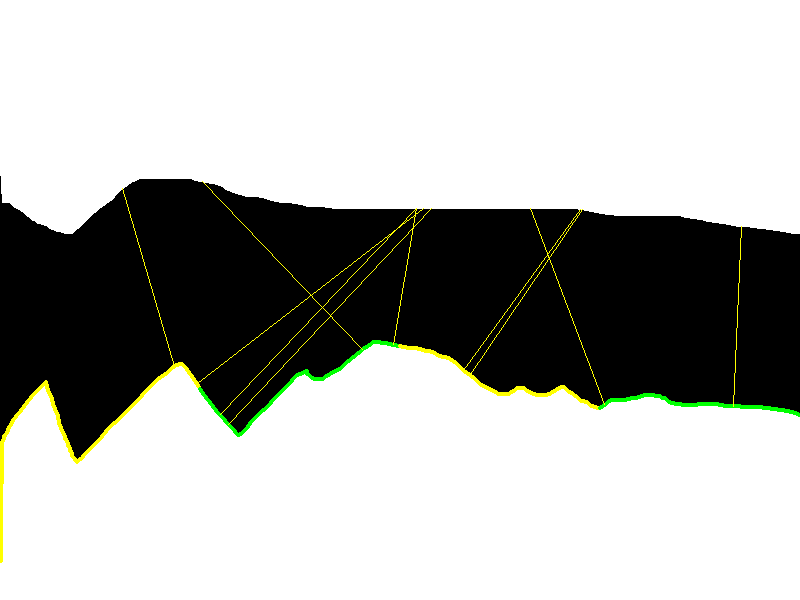
The Skin Tools allow to analyze masks of skin tissue that touch the right and left border of the image. The length of the lower border line is measured. For each extremum on the lower border line of the mask the length of a vertical line across the mask is measured. The advanced analysis allows to measure the interdigitation index (see for example here) and the filaggrin thickness. The filaggrin thickness is calculated using a number of random lines perpendicular to the border across the mask. An example image can be found here.
Getting started
Install the "Macro_IO_Settings plugin". Download the file iosettings.zip and unzip the archive file in the plugins folder of your ImageJ installation. Install the Roi-Converter plugin from the Roi Converter Tools. Drag the link MRI_Skin_Tools.ijm to the ImageJ launcher window, save it under macros/toolsets in the ImageJ installation and restart ImageJ.
Select the "MRI Skin Tools" toolset from the >> button of the ImageJ launcher.
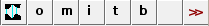
- the first button (the one with the image) opens this help page
- the o button opens an options dialog
- the m button allows to measure the thickness of the filaggrin based on vertical lines from the extrema on the lower border in the current image
- the i button allows to measure the interdigitation index on the current image
- the t button allows to measure the filaggrin-thickness on the current image
- the b button allows to measure interdigitation index and skin thickness on a number of images in batch mode
Options
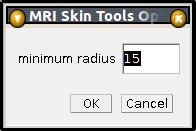
The options button opens the options dialog that allows to set a radius. The radius is used to exclude small extrema. Only local extrema that are also global extrema within the given radius are kept. The option is used in manual mode (m) and in batch mode (b).
Advanced Options
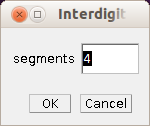
A right-click on the i-button opens the options dialog for the calculation of the interdigitation index. The value is used in the batch mode as well. The number of segments specifies into how many segment the border of the skin is divided for the calculation.
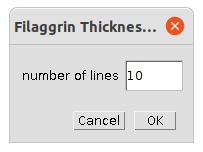
A right-click on the t-button opens the options dialog for the calculation of the filaggrin-thickness. The value is used in the batch mode as well. The number of lines specifies how many lines are measured across the skin.
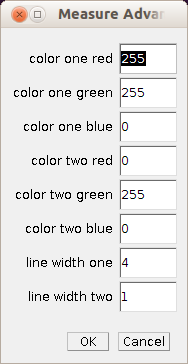
A right click on the second b-button opens the options dialog for the advanced skin properties batch. You can specify two colors by their rgb components. The two colors are alternatingly used for the segments of the border of the skin. The first color is used to display the lines across the skin. The remaining two options are the thickness of the drawings that indicate the used segments and lines.
Measuring skin properties in the current image
The image must be a mask of the skin tissue in which the high value (255) represents the tissue and the low value (0) the background. Open the image and press the m button. As a result the lower border-line of the tissue and for each extremum a vertical line across the tissue are added to the roi-manager. The measurements of these lines will be shown in the results-table.
Measuring skin properties in batch mode
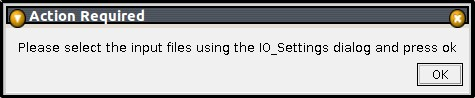
Press the b button. This will open two windows. The "IO Settings" window and a dialog with the title "Action Required".
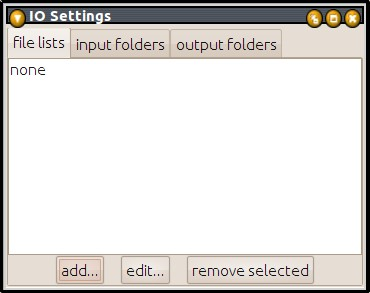
On the IO_Settings window press the add... button. In the file-dialog that opens select the files you want to process. You can select a folder or a selection of multiple files. A list editor containing the selected files will now be opened.
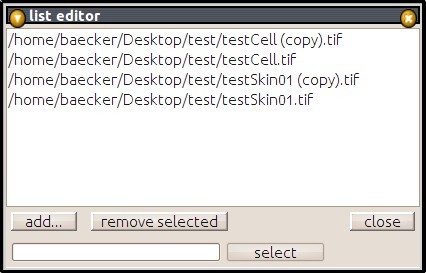
In the list editor you can use add... to add more image or remove images you do not want to process from the list. Once you have finished editing the list, press the close button. Now press ok on the Action-Required dialog to tell the macro that the selection of images is finished. This will start the processing.
Measuring the interdigitation index in the current image
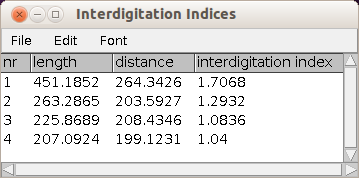
Open the image and press the i button. The segments will be added to the roi-manager. The length, the distance between the end-points and the interdigitation index is written to the results table for each segment.
Measuring the filaggrin-thickness in the current image
Open the image and press the t button. The lines will be added to the roi-manager. The result table shows the length of each line and the mean-length in the summary section.
Results
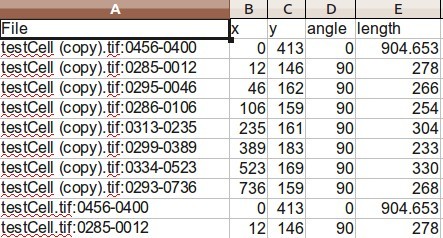
In the folder of the input files a file Results.csv is written. It contains tab separated data and can be opened with a spreadsheet program. The data it contains is: The name of the file, the start coordinated of the line the angle against the x-axis of the line and the length of the line. The length is either in pixel or in the unit that the image had set when the macro has been run. The first line for each image is the lower border line of the tissue, the other lines are the vertical lines from the extrema across the tissue.
A subfolder control is created in the input folder. It contains copies of the input images in jpg-format and with the lines the program measured drawn into them. They can be used to verify that the programme worked correctly on the input data.
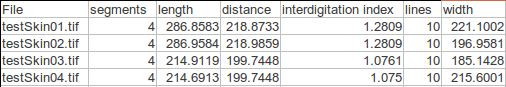
Advanced Results
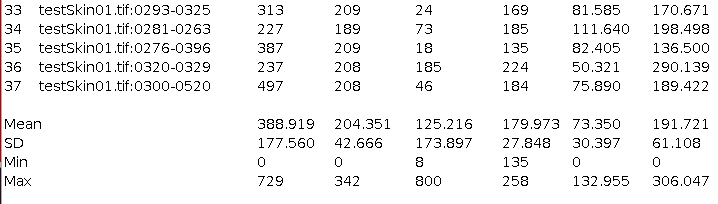
In the folder of the input files a file Advanced-Skin-Results.csv is written. It contains tab separated data and can be opened with a spreadsheet programme. The data it contains is: The name of the file, the number of segments used for the interdigitation index, the length of each segment, the distance between the endpoints of each segment, the interdigitation index, the number of lines used for the skin-thickness and the mean skin thickness.
A subfolder control is created in the input folder. It contains copies of the input images in png-format and with the segments and lines the programme measured drawn into them. They can be used to verify that the programme worked correctly on the input data.
History
- 07.05.2022 - Removed the source code files from the
Roi Converter Tools. ImageJ tries to compile them which leads to lines going beyond the lower border, if the compiler is not available. The source-code can be found here.
Publications using the tool
- Ngnintedem, A., Gitau Gich, M., Maina Kagi, J., Keambou Ti, C., 2021. Apparent Digestibility and Gut Integrity of Chicken Fed a Diet Supplemented with African Safou (Dacryodes edulis). International J. of Poultry Science 20, 13–26. https://doi.org/10.3923/ijps.2021.13.26