Prototypes - MatthewFeroz/heval GitHub Wiki
Prototypes
UI review for the week 5 assignment, captured September 30, 2026. These images render the actual public Heval application at revision 3567263. They replace the earlier drawn mockups, which did not follow the implemented layout closely enough.
The React components, CSS, fonts, icons, and chart renderer are unchanged. A temporary local adapter supplies a signed-in example account, simulated worker/run state, and the repository's synthetic demo results. These are local UI captures, not evidence of a deployed account or a new evaluation. The report's 120 invented trials are a separate example from the three-trial setup configuration.
Navigation between screens
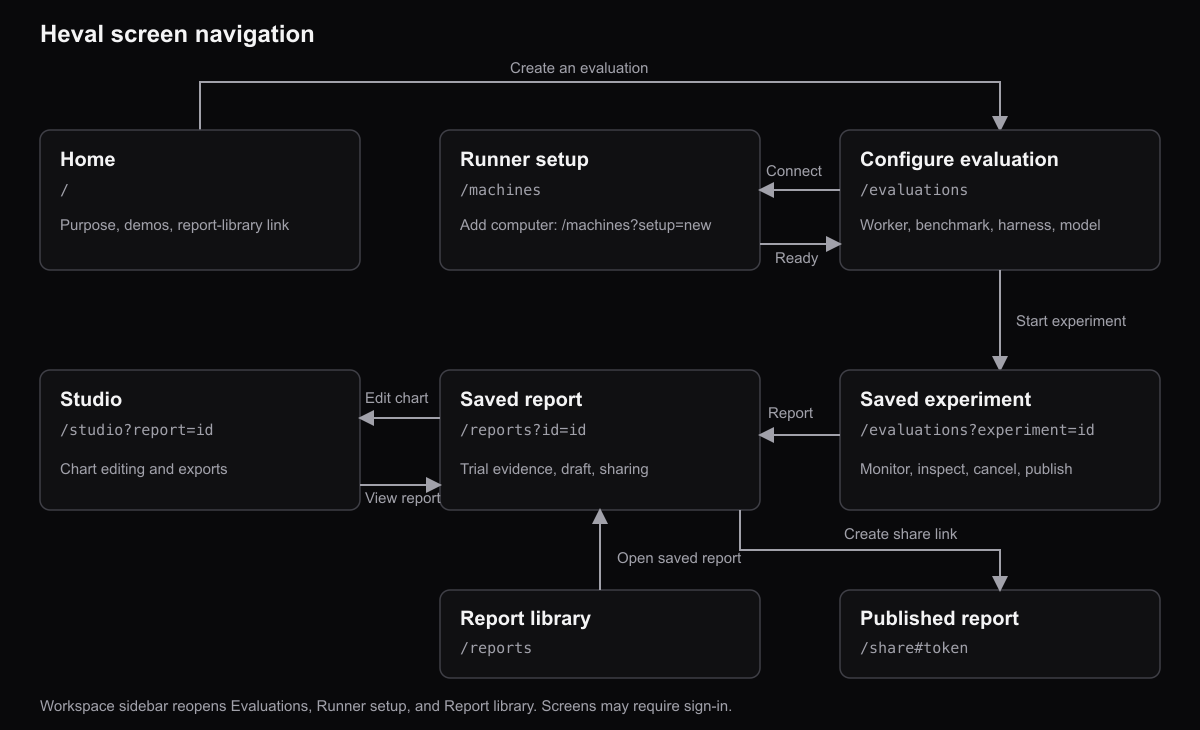
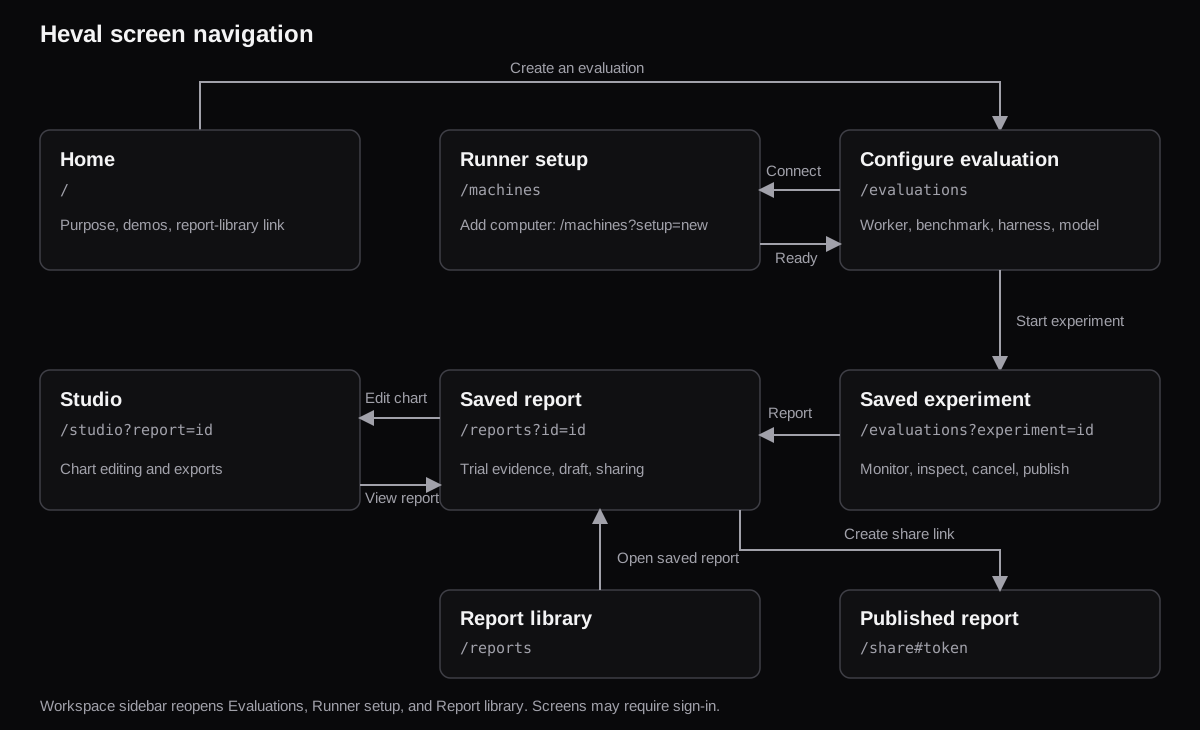
Home opens Evaluations directly. A new user first connects a worker through Runner setup. Starting an experiment opens its saved monitoring page. Completed results can be inspected there and opened as a report. The report opens Studio, which returns through View report. The sidebar reopens Evaluations, Runner setup, and the report library. Creating a share link exposes a published report at /share#token. The diagram's editable SVG documents these links; it is not an application screenshot.
Home
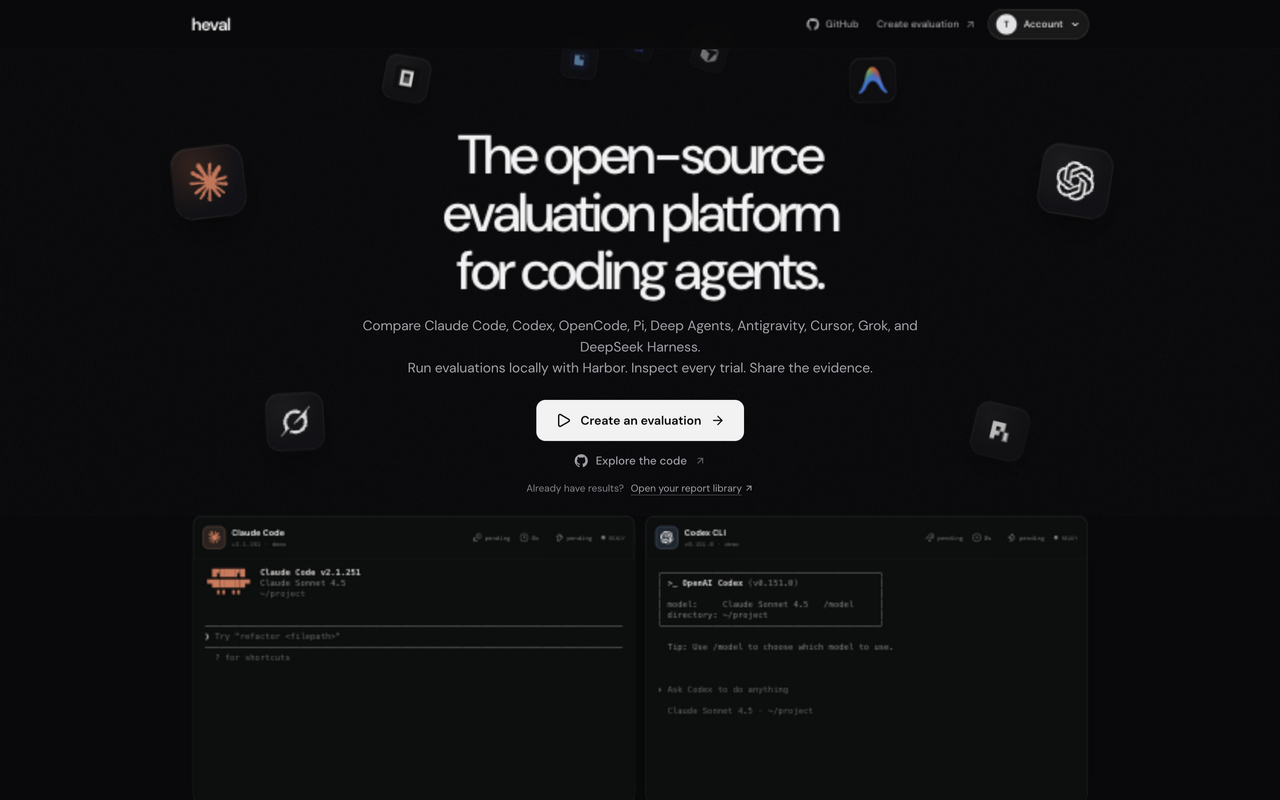
The landing page explains the coding-agent comparison workflow. Create an evaluation is the main action. Explore the code opens GitHub; Open your report library returns to saved results. The terminal panels below the hero are the application's scripted demonstrations.
Source: App and LandingHero.
Runner setup and connected computers
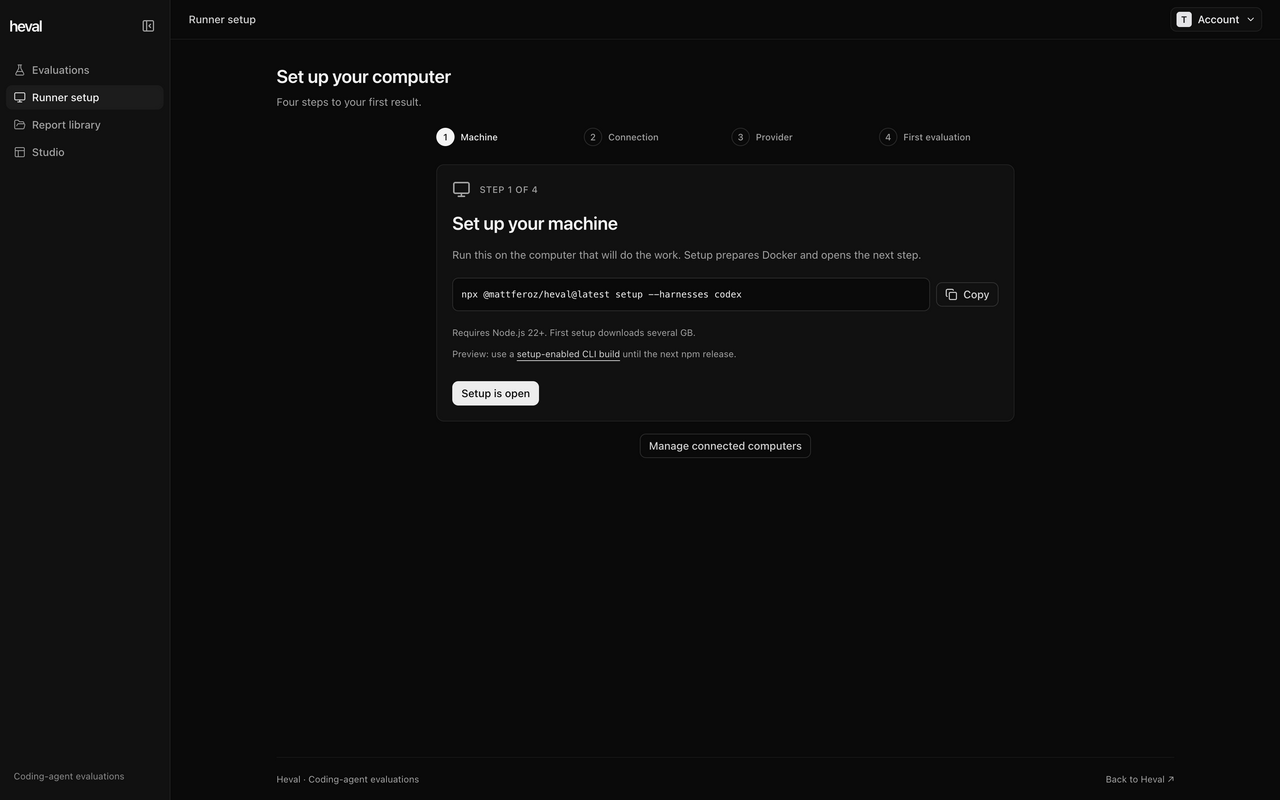
Setup follows Machine, Connection, Provider, and First evaluation. The first screen provides a copyable CLI command and a Setup is open button. Later steps connect the Linux worker and its local model provider. The capture preserves the source's notice about requiring a setup-enabled CLI build until the next release.
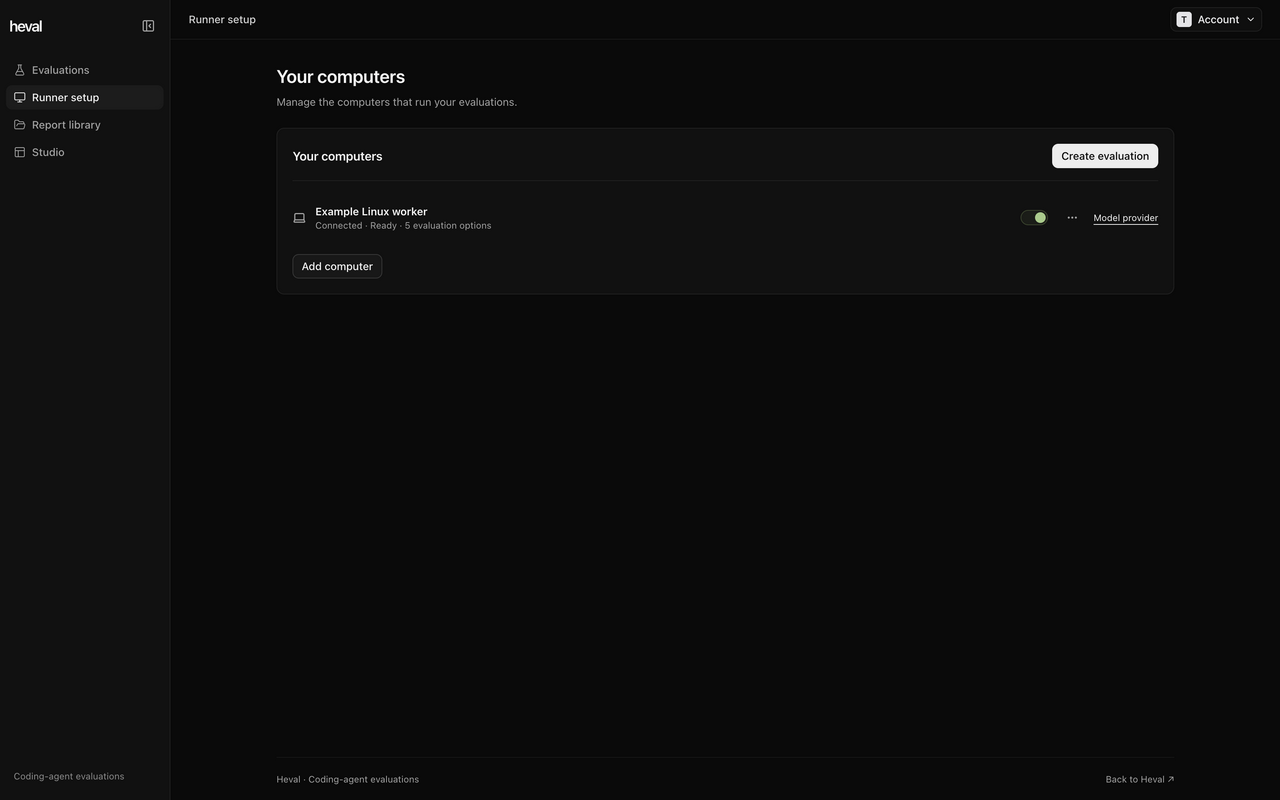
An established account sees Your computers. Each row shows connection/readiness, the number of evaluation options, an enable switch, a menu, and Model provider. Create evaluation and Add computer are separate actions. Disconnect confirmation explains cancellation and the limits of controlling an offline computer.
Source: RunnerApp, MachineRow, and FirstSmokeTest.
Evaluation configuration
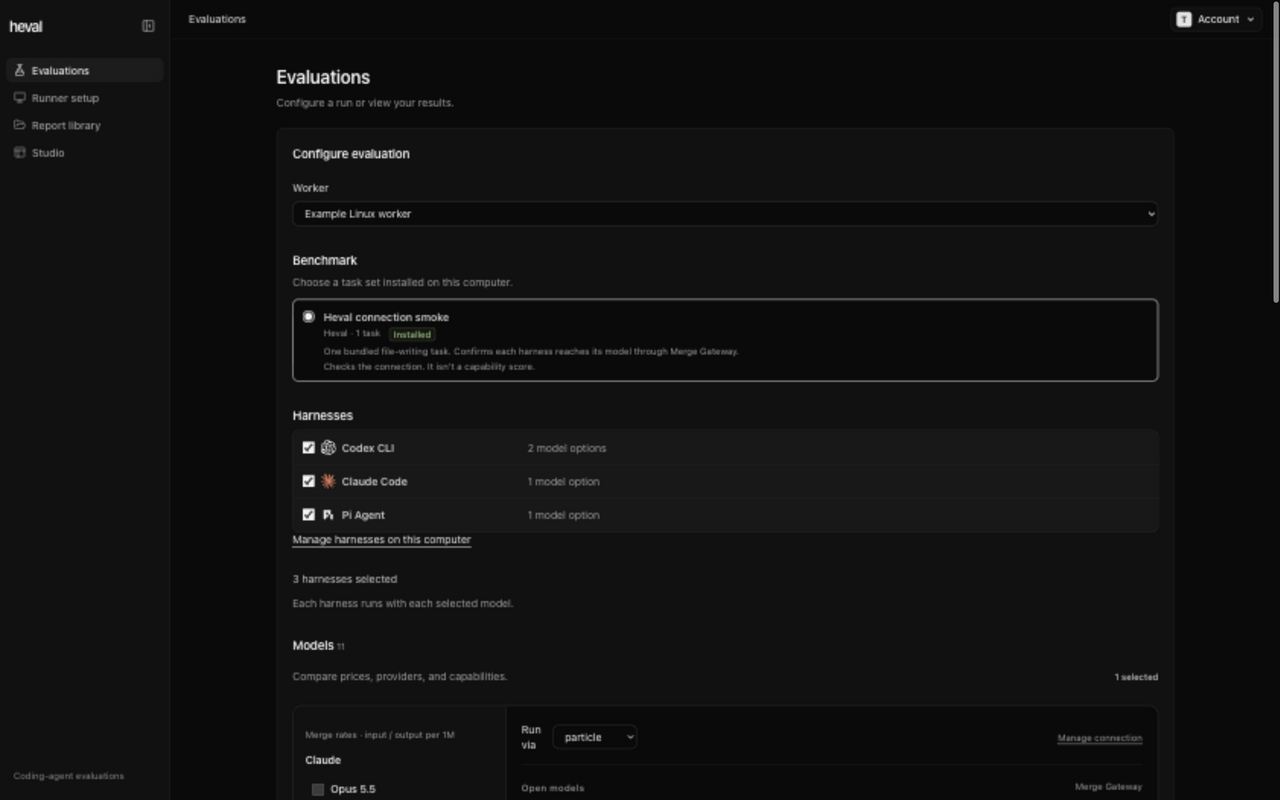
The form is one scrolling column. It selects a worker, installed benchmark, harnesses, and models. This example selects Codex CLI, Claude Code, and Pi for the one-task Heval connection smoke benchmark. The form distinguishes checking a connection from measuring coding capability.
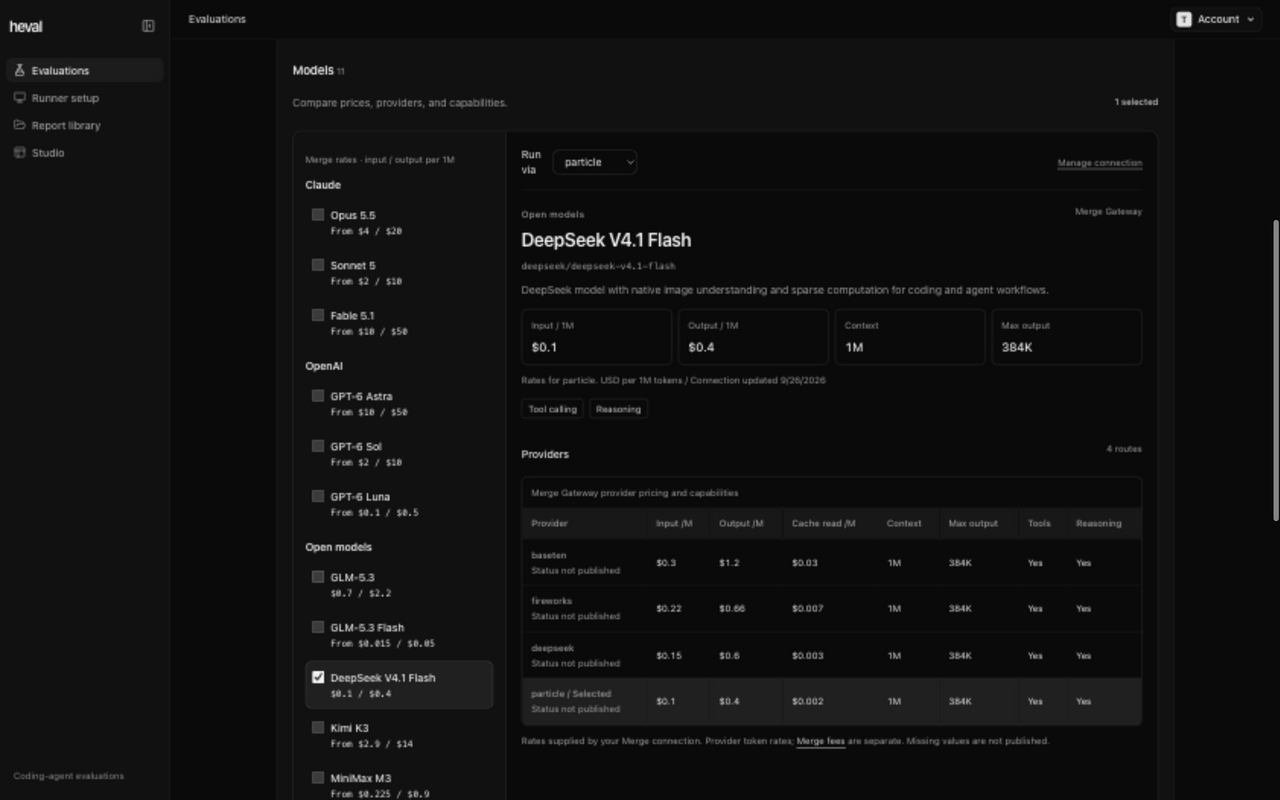
The model list sits beside a detail panel with token rates, context/output limits, capabilities, and provider routes. The example selects DeepSeek V4.1 Flash through particle. Rates are values from the captured catalog, not a current pricing recommendation.
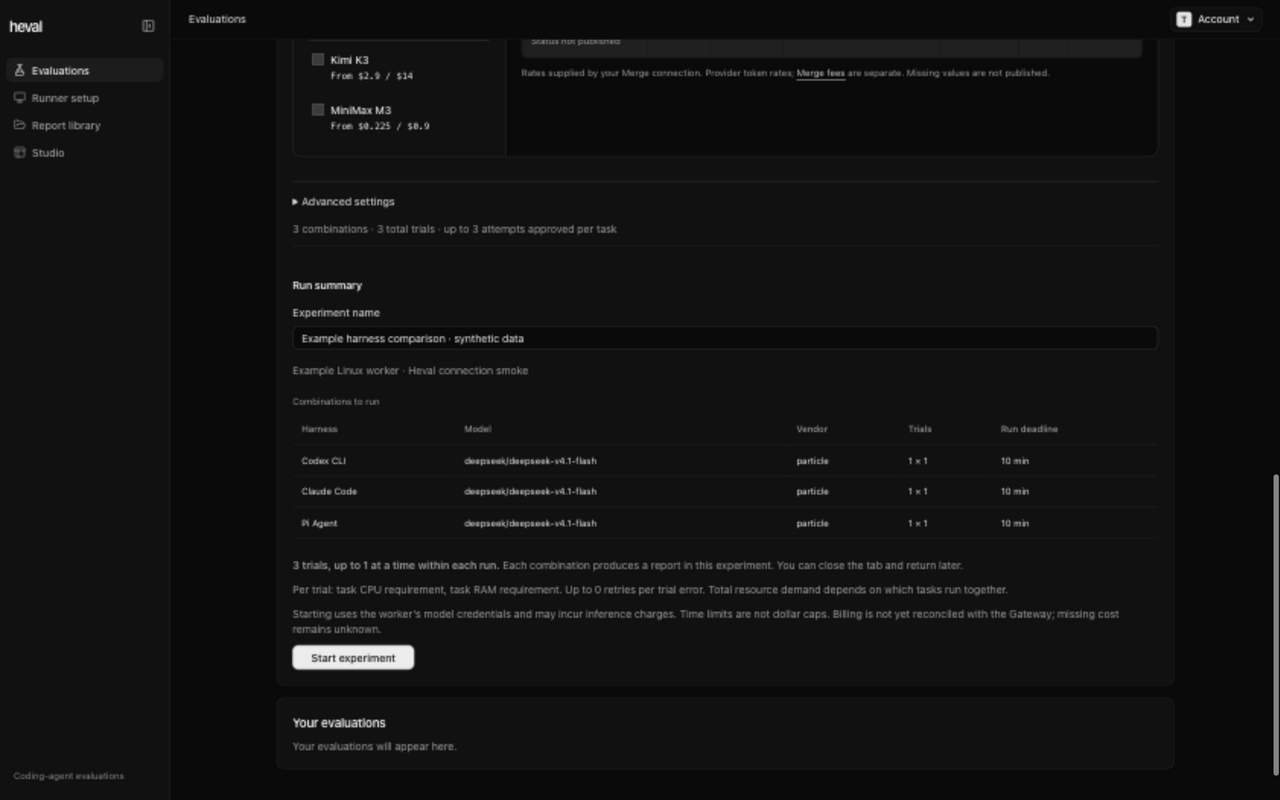
Advanced settings precede the run summary at the bottom. The summary names the experiment and lists three combinations, one trial per harness, and a ten-minute deadline. Start experiment becomes available after the required selections and name are valid. The actual form explains provider charges and unknown billing data.
Source: EvaluationApp and ModelPicker.
Saved experiment and monitoring
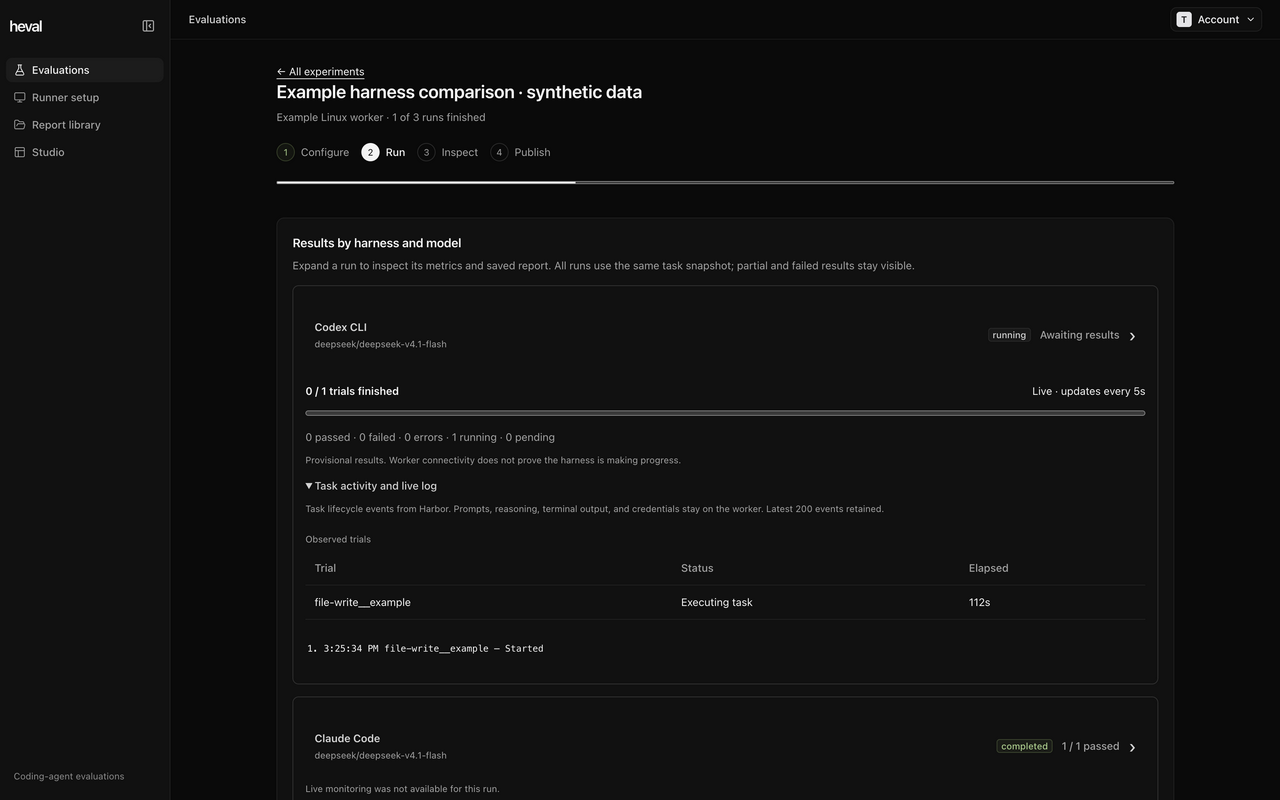
The saved experiment uses Configure, Run, Inspect, and Publish steps. Each harness/model has an expandable run card. Here one simulated run is active, one completed, and one queued. Task activity and live log expands a trial table and lifecycle events. Prompts, terminal output, and credentials stay on the worker. Cancel unfinished runs is below the cards.
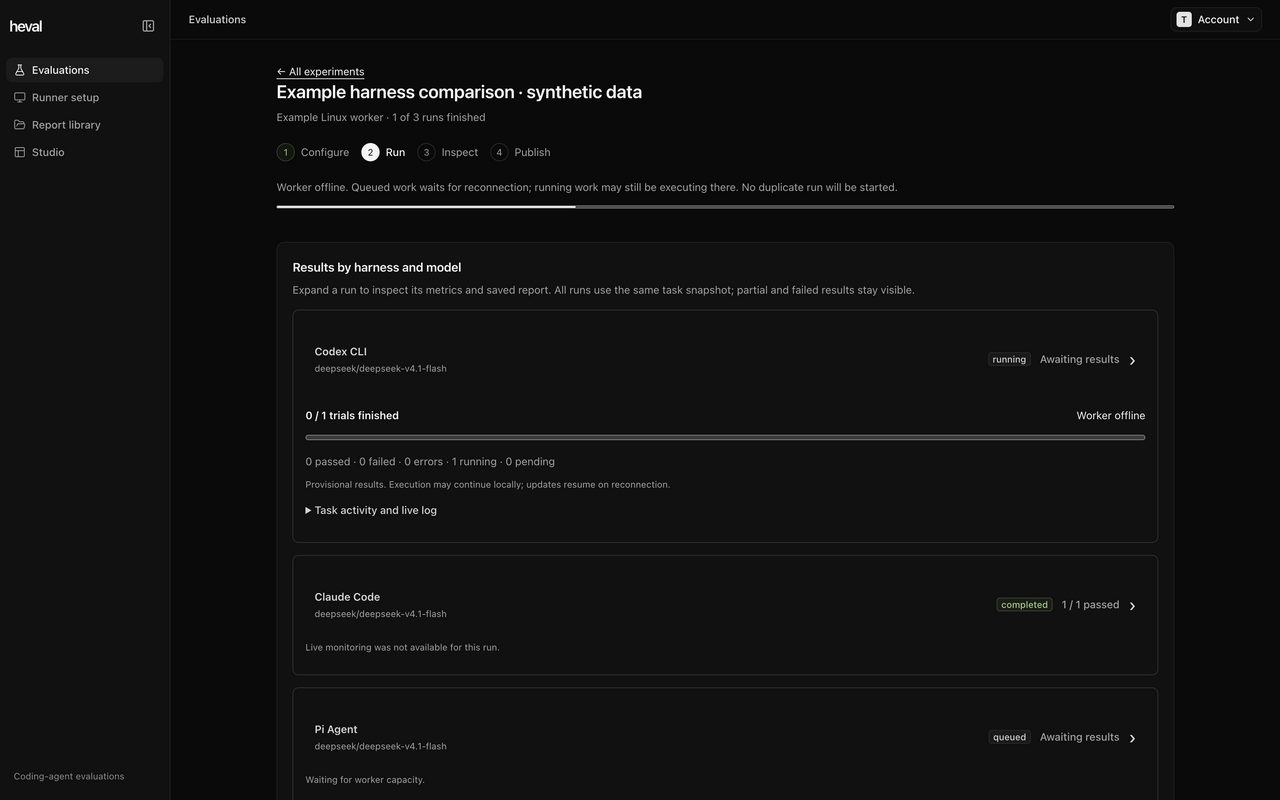
When the heartbeat expires, the same page shows Worker offline and explains that queued work waits while local execution may continue. It retains recorded progress. The UI also has a separate Monitoring delayed state when telemetry is stale but the worker is connected.
Source: EvaluationApp and LiveRunMonitor.
Report and sharing
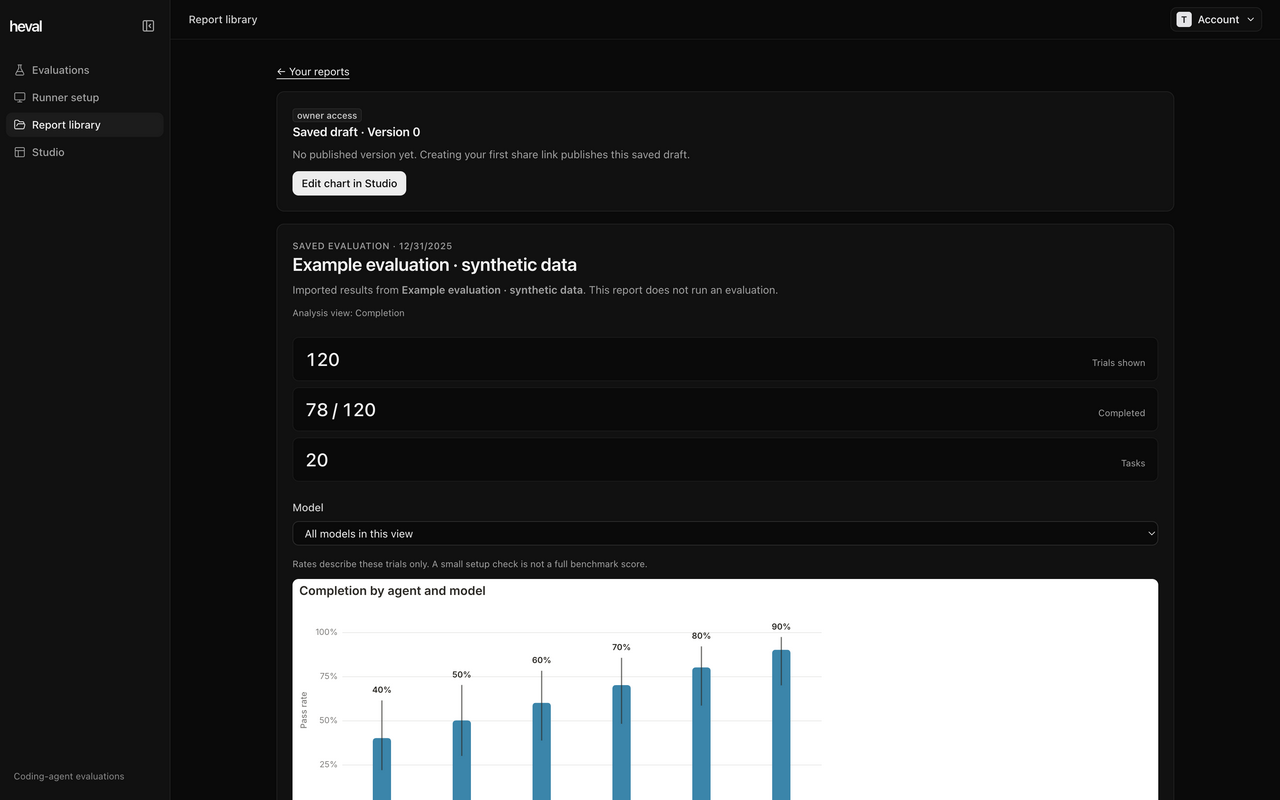
The report identifies owner access and the saved draft version. It shows trial/task counts, a model filter, and the chart. Edit chart in Studio opens the editor. The repository's invented six-model dataset supplies every outcome, timing, token count, and cost shown here.
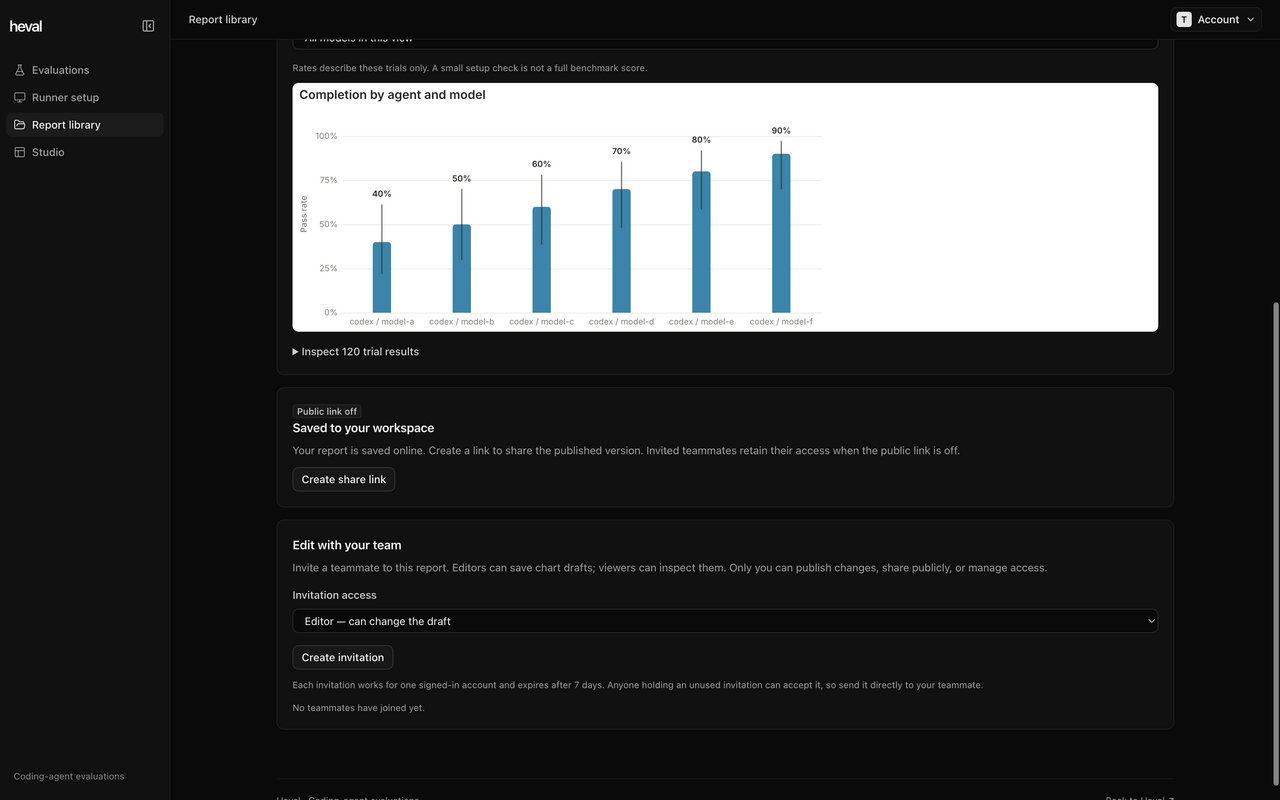
Below the chart, Inspect trial results expands the evidence. Public link off is the initial sharing state. Create share link publishes the saved draft. The owner can also create an editor/viewer invitation. A published link adds copy/open/revoke controls. No public link or invitation was created for these captures.
Source: ReportsApp and ProjectReportView.
Studio
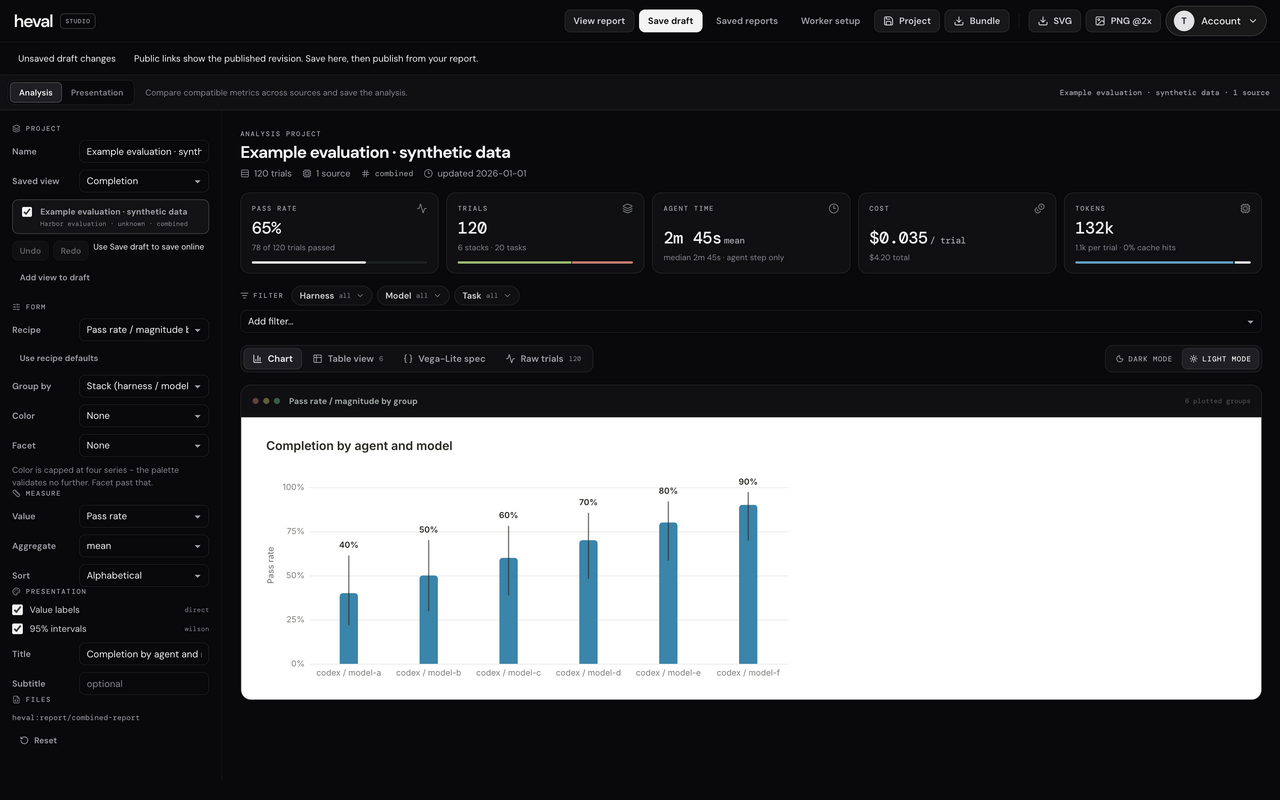
Studio has its own full-width workspace. The left panel controls the recipe, grouping, color, faceting, metric, aggregation, sorting, labels, and intervals. The main area shows summary metrics, filters, and the rendered chart. Chart, Table view, Vega-Lite spec, and Raw trials inspect the same data. The top bar offers View report, Save draft, Project, Bundle, SVG, and PNG export. Saving a draft and publishing it are distinct actions.
Source: Studio and HostedStudio.
Capture method and next review
The public checkout ran through Vite with Bun. A temporary adapter derived from evaluation-ui-smoke.ts replaced authentication and Convex responses only. T3 Code's collaborative preview captured the PNGs, which were visually inspected before publication. No real worker or model request ran. The capture manifest records routes, source revision, and image hashes.
The images use the implementation's workspace layout and tokens, including its dark panels, neutral primary buttons, and actual navigation labels. Sprint 1 will review the first-run path, keyboard access, and narrow-screen behavior. Those checks are not claimed complete here.
See How an evaluation works for the component responsibilities behind these screens.