Cortex Debug Under the hood - Marus/cortex-debug GitHub Wiki
It may be helpful if you understand what Cortex-Debug does and some of the things under the hood. Unlike other IDEs (which VSCode is not an IDE), there are no dialog boxes, and tons of buttons/menus, here. But there is a lot of flexibility built-in, perhaps rarely needed.
This document is not a list of features. It may help you extract the best of this extension after reading this. Please read this document before submitting issues. Also, see read about the various properties/attributes mentioned below.
Before we delve into the process, we need to define what it is we are debugging
Debug file(s)
The most common thing we debug is the ELF file specified by the launch.json property "executable". This file should contain debug symbols that both GDB and Cortex-Debug will read. It also contains the program (instructions and data) that is loaded into the embedded device. But, this may not always be the case and you can customize this aspect
- Multiple/different program(s) (instruction and data) files
You can use the launch.json property
"loadFiles"to specify what program file(s) to load. Any symbols in these files are ignored. This can be an empty set specifying that no program information should be loaded (flashed) into the device as perhaps the program is loaded some other way (OTA, special bootloaders, etc.).loadFilescan be either ELF, binary or intel hex format files and are handled by GDB and the gdb-server. Cortex-Debug simply passes them along. - Alternate symbol files
Instead of using
"executable"for symbol information, the launch.json property"symbolFiles"can be used to specify a set of ELF files (and optional address offsets) to use for symbol files. This can also be an empty set, in which case there are zero files to use for symbols. But, there may be a use case.
Both Cortex-Debug and GDB need to have symbol information to provide various facilities (Local/Global/Static variables, proper stack traces, better disassembly, RTOS information, etc.). Make sure you use appropriate compiler options -- like -g -Og or -g -O0 for GCC compiler and linker or you won't see any symbols
Body parts
The main body parts and some terminology to begin
VSCode, and its role
We all know this one. It is the editor that hosts many useful extensions specializing in various aspects of SW development. But there are rules (enforced via APIs and protocol specifications) and conventions that extensions have to follow to play in the VSCode sandbox. One of these is a debug protocol. VSCode provides the buttons, menus, panes, etc. and in limited areas allows extensions to add to those. VSCode also orchestrates (not implements) the debugging process. We as a debugging extension provide implementations and also provide data to present in the Variables, Watch, Call Stack, etc. windows. Such windows are drawn and the UI is managed by VSCode. VSCode communicates with a debug extension like Cortex-Debug using the Debug Adapter Protocol
VSCode also performs variable substitution in launch.json and handles preLaunchTask, postDebugTask if any.
GDB, the debugger
While we may call ourselves a debugger, we are not. We are a front-end to the real debugger, which is GDB. It knows a lot about executable (ELF or other formats) files, how to set breakpoints, run, step, continue, etc. We translate actions on your buttons, mouse clicks into something gdb can handle and provide you responses. GDB's have special languages to talk to the front end using GDB machine interface and to the server using the GDB Remote Serial Protocol
GDB-server
You may know them as OpenOCD, pyOCD, JLinkGDBServer, STLinkServer, etc. GDB by itself does not know anything about your device. It does know what an ARM architecture looks like but has no clue about much else. It relies on a program called a gdb-server that provides that knowledge and services. Among services, the gdb-server helps create breakpoints. GDB knows the instruction address of the breakpoint but does not know how to create a breakpoint in the device (especially for a FLASH-based device, which registers to set, etc.) GDB does not know how to load (program) the device with the executable file. It asks the gdb-server to load the program for it by giving the gdb-server address(es) and relevant data.
GDB-servers are typically enhanced by device vendors by providing their specific algorithms and methods. GDB-server typically communicates with hardware with USB/Serial/other connections. The gdb-server can also be anywhere so long as there is a network connection to it. GDB can talk to the gdb-server over any of those methods.
Debug Adapter
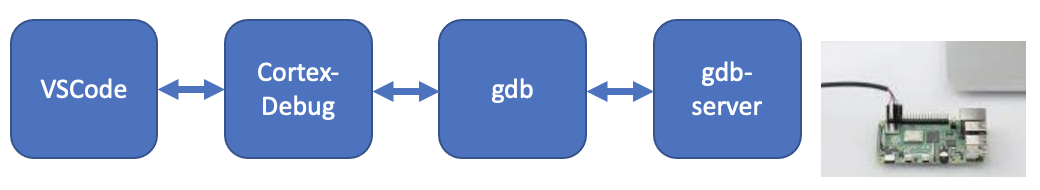
That is this extension. It ties all the of above together and presents it to you as a visual debugger. Cortex-Debug only really talks to GDB but it does start the gdb-server and GDB and connects them together using a TCP or serial port gdb-server. Cortex-Debug (other than trace) NEVER talks to the GDB-server directly. It always uses GDB requests/commands that are generic and GDB forwards those requests to the GDB-server if needed. The box labeled Cortex-Debug below is the adapter. Its main job is to translate requests from VSCode into requests to GDB and then converts GDB responses from GDB into something VSCode understands. Some GDB responses turn into events for our frontend GUI, other extensions and especially VSCode. Cortex-Debug only understands the GDB request/response using stdio and has no clue how each GDB-server works.
Startup process
All debuggers within VSCode are started using a file called launch.json. It will be helpful if you know the general aspects of debugging in VSCode. Not every debugger is the same and features and methods may differ but at a high level, they are all the same.
The debugging process really depends on two things.
- The specific gdb-server
- The specific device
A given device may be supported with various gdb-servers and vice versa. Which combination you use is up to you, but make sure it is fully supported and current. Some vendors ship their versions of gdb-servers in which case, you should use that version.
Given that there are dozens of device manufacturers, thousands of devices, and many gdb-servers it is impossible for us to know the details. What we do provide is what generally should work. For instance, most devices (and their gdb-servers) provide a reset. But if yours doesn't or does it differently, then you need to adjust those.
At each step of the process, there are things that are customizable. We shall follow in the order of things.
Start GDB
GDB is started, putting it in machine interface mode, and issuing some basic commands (like using asynchronous modes, allow de-mangling, etc.)
Load symbols for variables and functions using objdump (and nm or gdb)
This is required for displaying global/static variables and for disassembly later.
Start the gdb-server
This is actually a complicated process. Most gdb-servers communicate using TCP ports and so we try to find and allocate the required number of ports. In this system, port numbers are not hard-coded. The server is launched, and we look at stdout/stderr for an indication that a TCP server has started on the specified TCP port. Every server outputs something different but we know about this.
At this point, an event is generated to indicate to the frontend that any chained configurations subscribed to the postStart event can start
Collect gdb+gdb-server commands for start
A series of commands are assembled to be passed to gdb (and some to the gdb-server via gdb). In most cases, the word Launch can be substituted with Attach
-
Some basic commands like loading utility gdb-scripts and commands for setting radix.
-
Connect GDB to the gdb-server using a command that looks like
target-select extended-remote 50000. This will ask gdb to communicate using TCP port 50000 to talk to the gdb-server. Note that this same TCP number has been given to the gdb-server where it has already started a gdb-server. Some gdb-servers (OpenOCD) require gdb to respond with an ACK immediately after a connection is established or the connection is closed. -
preLaunchCommands: A user-defined set of commands that should be used before gdb connects to the gdb-server -
Built-in launch/attach commands or
overrideLaunchCommands: The builtin launch commands look like the followingmonitor reset halt load monitor reset haltWhen a command starts with the word
monitor, that command is sent by gdb to the gdb-server. Otherwise, it is a command for gdb itself. If a command starts with a-, then it needs to be a gdb machine-interface command. The first line halts and resets the device. The second line loads the program specified by yourexecutableinto the device. If you do not want to load the executable but some other file, you can specify this usingloadFileswhich can be of elf, binary or hex formats. It can be multiple files or none at all using an empty set. If there is nothing to be programmed the line is omitted as wellThe last line does a reset again (the programming operation may move the PC and Stack to an unwanted location) and now we are ready to run the program. Cortex-Debug has this customized for each gdb-server but the overall goal is the same (PC at the reset-handler, stack and other registers properly initialized as a reset does) while the commands may be different.
If this is not applicable to your device, replace them using
overrideLaunchCommands. But the goal should be the same. -
postLaunchCommands: A user-defined set of commands that should be used after the device has been reset and ready to go. Despite the name, it these commands are still part of the initial startup sequence.
Run the above commands
All the commands we have collected so far are sent to gdb in one go. If anything fails, then the debugging session is terminated.
At this point, an event is generated to indicate to the frontend that any chained configurations subscribed to the postInit event can start
RTT and SWO initialization
Some initialization may have already happened when the server started some may be done at this point. Very gdb-server dependent and the type of trace
Finish Start Sequence
Everything up to this point is considered the main launch/attach sequence, and the session (according to VSCode and Cortex-Debug) is considered as started. At this point, we expect the debugger to be stopped at the reset for launch and anywhere for attach. VSCode also sends commands to set various kinds of breakpoints, does queries for threads and stack frames, etc. when the program finally pauses (even briefly) -- exact details are a bit complicated depending on the options below.
There are multiple options here and they are presented in the order of priority
runToEntryPoint: If this is defined, then a temporary breakpoint is set and acontinuecommand is issued. We wait for 5 seconds and if it does not succeed, then the program is interrupted for you to examine. This operation consumes a breakpoint, but it only matters on a Restart/Reset operation. AnypostStartSessionCommandsare ignored.breakAfterReset: If this is defined, the debugger simply stops at the reset handler. This is useful to debug your startup code. This operation does not consume a breakpoint. However, yourpostStartSessionCommandsARE executed -- this may change in the future.postStartSessionCommands: A user-defined set of commands that should be used right after "main" launch/attach sequence is finished. Not used ifrunToEntryPointis used- If none of the above apply, then the program simply continues until either the user pauses the program or a breakpoint is hit. Use this to save a breakpoint used for
runToEntryPoint.
After this, it is all normal operation.
Restart or Reset
Differences: Restart is something VSCode controls, and its behavior has been changing, and may invoke your preLaunchTask which typically does a build if you have one. Reset is something added by Cortex-Debug which as the name suggests simply does a reset. After VSCode is done with its thing, it lets Cortex-Debug finish the Restart. For Cortex-Debug, they mean the same thing. Most people prefer the Reset button as it is generally faster and more meaningful. The Reset process is as follows
Collect gdb+gdb-server commands for Reset/Restart
-
preRestartCommands: A user-defined set of commands that should be used before a reset -
Built-in launch/attach commands or
overrideRestartCommands: The built-in commands look like the followingmonitor reset haltThe objective is to halt and reset, the PC should be at the reset handler. You can override this with a set of your own commands. Even an empty set.
-
postResetCommands: A user-defined set of commands that should be used after a reset
Session Termination
This depends on the kind of termination requested. Stop or Disconnect using VSCode language. If you hover on that little red box to stop the session you can see the two types of termination. Stop simply means stop the program, in the embedded world, we leave the program in a halted state. Disconnect in gdb language means detach and this means leave the program in a running state. But to do this, the gdb-server has to co-operate and do its part. We issue the necessary gdb commands but it is really up to the gdb-server to do the right thing. Most gdb-servers are out of spec/convention and don't make the distinction which is unfortunate.
Finally, after some timeout, we kill the gdb-server if we had started it. Note that you can have a server of type external where it was by started someone else. The rule is simple. If we didn't start it we don't kill it. But even killing is not guaranteed as things can go wrong at the OS level or with gdb. This is rare but has been a terrible pain point for us in the past
Run the above commands
These commands are simply executed via gdb. If they all succeed, the same Finish Start Sequence described above is re-executed.
If any chained configurations exist they are also notified to perform their own Reset/Restart sequences.
Hey, Where is the GUI?
Everything mentioned above are non-graphical aspects -- the backend where the bulk of the work happens -- also known as the Debug Adapter in VSCode lingo. This extension Cortex-Debug is actually broken into two parts. The frontend and the backend. Note that VSCode takes care of most of the debugging aspects using its own GUI elements. The front end has the following responsibilities.
Help in launching debug sessions
The frontend sanitizes the contents of part of the launch session before it is passed to the backend that actually uses it.
Peripheral Window
This uses an SVD file to display the state of the peripherals
SWO Windows
You can have text-based windows (also called consoles) or graphs/plots
RTT Windows
These are similar to the SWO windows but the source of the data is different
Managing chained configurations
This part helps coordinate between chained configurations as well as handle multiple un-related sessions. See https://github.com/Marus/cortex-debug/wiki/Multi-core-debugging
Managing settings
When some settings change, the backend is notified of such changes.