The Update Pattern in D3 - MartijnKeesmaat/frontend-data GitHub Wiki
In his video, Curran Kelleher talks about the general update pattern of D3.js. This video served as the base of my interactions.
How does the pattern work?
When you call selectAll() followed by a method you start the data-join pattern. You can then handle these three states: enter(), update and exit().
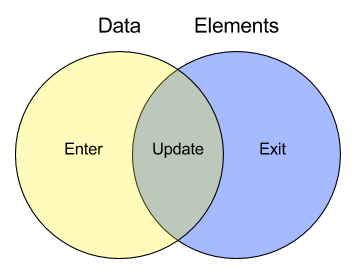
This fan diagram illustrates the data join pattern. It shows the three states enter, update and exit.
Enteris the state when there is data, but no elements. You then create the DOM elements which are linked to the data.- This means that in the
updatephase you can access both the data and DOM elements. In the update phase you populate the DOM-elements with the data and add attributes like classes, styling, positioning, etc. - You can then use
exit()to clear the data and useremove()to clear the DOM elements. These are usually used at the end of the function.
Below I'll explain how I adapted this pattern to interconnect both the bar chart and the donut chart. The bar chart will update the data in the donut chart and vice versa.
Data from bar to donut
In this example, I'll explain how I connect two different charts. The first chart is a horizontal bar chart which, in this case, updates the data of the donut chart. You can see the bar chart as a fancy alternative to a dropdown. Once the user hovers over a bar in the graph, the content will update.
The process
- Get the right data with the selection of the bar chart
- Pass the data to an update function
- Update the donut chart
Disclaimer this explanation is a simplified version of the prototype.
What data do we update here?
There are 19 main categories in total, but for this example, I'll show 2. This is how the objects are structured. In this case, we want to populate the donut chart with materials from the first category and then update it with materials from the second.
0: {name: "communicatie", value: 557474, materials: Array(5)}
1: {name: "kunst", value: 188227, materials: Array(5)}
Each category shows the 5 most common materials. The materials have a name(string) and value(number) which is the number of objects of said material.
0: {name: "papier (vezelproduct)", value: 12411}
1: {name: "papier (vezelproduct)", value: 7792}
2: {name: "inkt", value: 7473}
3: {name: "houtsnede (drukprocedé)", value: 6640}
4: {name: "pigment", value: 6378}
0: {name: "katoen", value: 5059}
1: {name: "katoen", value: 4641}
2: {name: "weefprocedés en -technieken (textiel)", value: 2541}
3: {name: "weefprocedés en -technieken (textiel)", value: 2133}
4: {name: "katoen", value: 2074}
How to update the data?
Retrieving the data is fairly simple. What we do, is first update the donut graph with the data of the first category. To get this then we look at categories[0].
Then we need to update this to the current category. With events like mouseenter you can get the current index of the element you are hovering on. Make sure you pass two arguments. The first one is for the element itself, the second will be your index.
.on('mouseenter', function(d, selectedBar) {
  console.log('current index:', selectedBar);
  console.log('current data:', categories[selectedBar]);
  ...
});
Pass data to the update function
This data will be passed to the update function. This is done inside the event described above.
updateDonutChart(categories[selectedBar]);
Updating the Donut Graph
This is the update function to which we pass the new data.
- Creates the paths(slices) of the donut
- Identifies(enter) any DOM elements that need to be added array is longer than the selection
- Animate the new paths
- Clears data and DOM elements
function updateDonutChart(data) {
  const slice = donutContainer
    .select('.slices')
    .selectAll('path.slice')
    .data(pie(data));

  // enter, update
  slice
    .enter()
    .insert('path')
    .style('fill', (d, i) => color[i])
    .attr('class', 'slice');

  // animate
  slice.transition().duration(500);

  // remove
  slice.exit().remove();
}
Updating the bar chart
The donut chart shows the top 5 materials for each category. To make the prototype more interesting, we also update the bar chart based on those materials.
Once the user hovers over a slice of the donut, it shows which categories also have that material. The width of the bars now indicates how much of the selected material each category has.
Future improvements
Something that could be improved in this prototype is the query. It only retrieves the top 5 materials of each category. If the selected material would be top >6, the materials wouldn't show up.
Reliable data > Visuals
The width of the bars is fairly small when hovered, so I wanted to update the axes. I decided against that since it can confuse the user into thinking the materials are of greater value than they are.
Getting the corresponding data
This is how the update function is called. In this case we only need to update the width of the bar chart. This is because I want to keep the position and data of the categories visible. It makes it more clear to the user which categories contain the selected material and which don't.
.on('mouseover', function(d, i) {
  handleDonutHover(d, i, categories, currentMaterials);
  ...
})
We pass the selected element, index, categories and currentMaterials
Check if the categories contain the selected material
We want to check if any of the categories contain the selected material.
We get the current material by using the index of the selected element as an identifier in the current materials. Like this currentMaterials[i].name.
We'll need to know two things for this:
- Does the category contain the selected material?
- What is the amount of the material within that category?
- How to update the bar chart with this data?
Does the category contain the selected material?
I first, want to check for each element if this condition is true: material.name === currentMaterials[i].name.
Because we don't want to modify the structure(amount, order of the arr), I use a map. Then I want to check if any of the materials are the same. For this, we can use the method some(), which returns true or false is any values match the condition
const categoriesWithClickedMaterial = categories.map(el => {
  return el.materials.some(function(material) {
    return material.name === currentMaterials[i].name;
  });
});
If we check the material papier we see that the first and third categories also have this material.
(5)[(true, false, true, false, false)];
For each bar, we can check if there is a value with
const hasMaterial = categoriesWithClickedMaterial[currentBar];
This simply returns a boolean for each bar.
What is the amount of the material within that category?
We also want to get the material inside the categories that matches the selected material. With a filter method we check if the materials check the selected material.
const material = categories[currentBar].materials.filter(el => el.name === currentMaterials[i].name);
How to update the bar chart with this data?
Now we know if each category contains the selected material, we want to update the width of each bar accordingly.
d3.selectAll('.bar').attr('width', (d, currentBar) => {
  ...
});
We can now use this data to return the correct value for each bar. With a ternary operator, I check if each category has this material. If true, return the material value and scale it. Otherwise, the width of the bar is 0.
There is a bug in the database where are different materials with the same name. Therefore I always get the first value of the materials.
return hasMaterial ? xScale(material[0].value) : 0;
In conclusion
I covered how I know which category contains the selected material from the donut chart. Then I created a new array with the value of the selected material within each category. This array is used to update the width of each bar in the bar graph. This only requires me to update the bar chart.
d3.selectAll('.bar').attr('width', (d, currentBar) => {
  const hasMaterial = categoriesWithClickedMaterial[currentBar];
  const material = categories[currentBar].materials.filter(el => el.name === currentMaterials[i].name);
  return hasMaterial ? xScale(material[0].value) : 0;
});