Nadieh Bremer Skillshare Course - MartijnKeesmaat/frontend-data GitHub Wiki
During the weekly checkup Danny pointed me to the skillshare course of Nadieh Bremer. In her course, Nadieh talks about the concepts she uses to create graphs. It's her goal to show interesting and visually pleasing visualizations. She goes beyond the basics and creates something unique. In my current design, I implemented the techniques she described in her course. An example of this is combining the brusher from a timeline graph with a horizontal bar chart.
#1 Combining charts
- When you have a lot of variables
- 5, 6 or 7 variable
- Take the basic components of charts and combine them
- For example this connected scatted plot
- Scatter plot
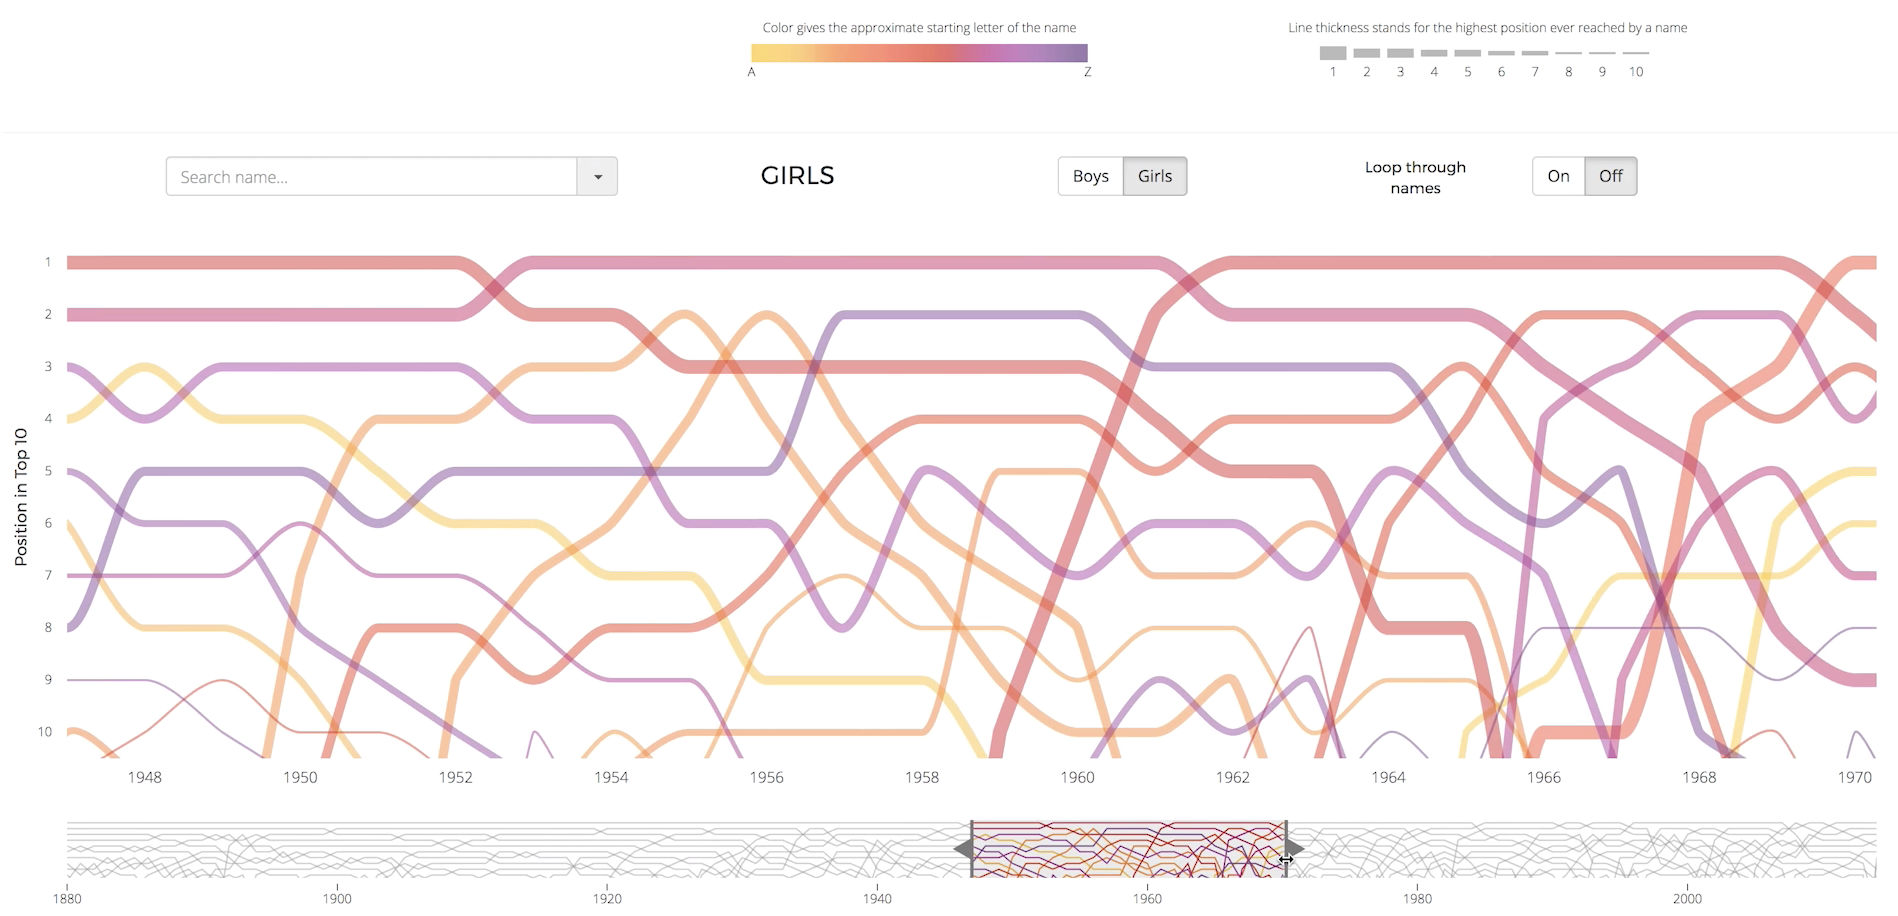
- Timeline
- Beeswarm
- Histogram
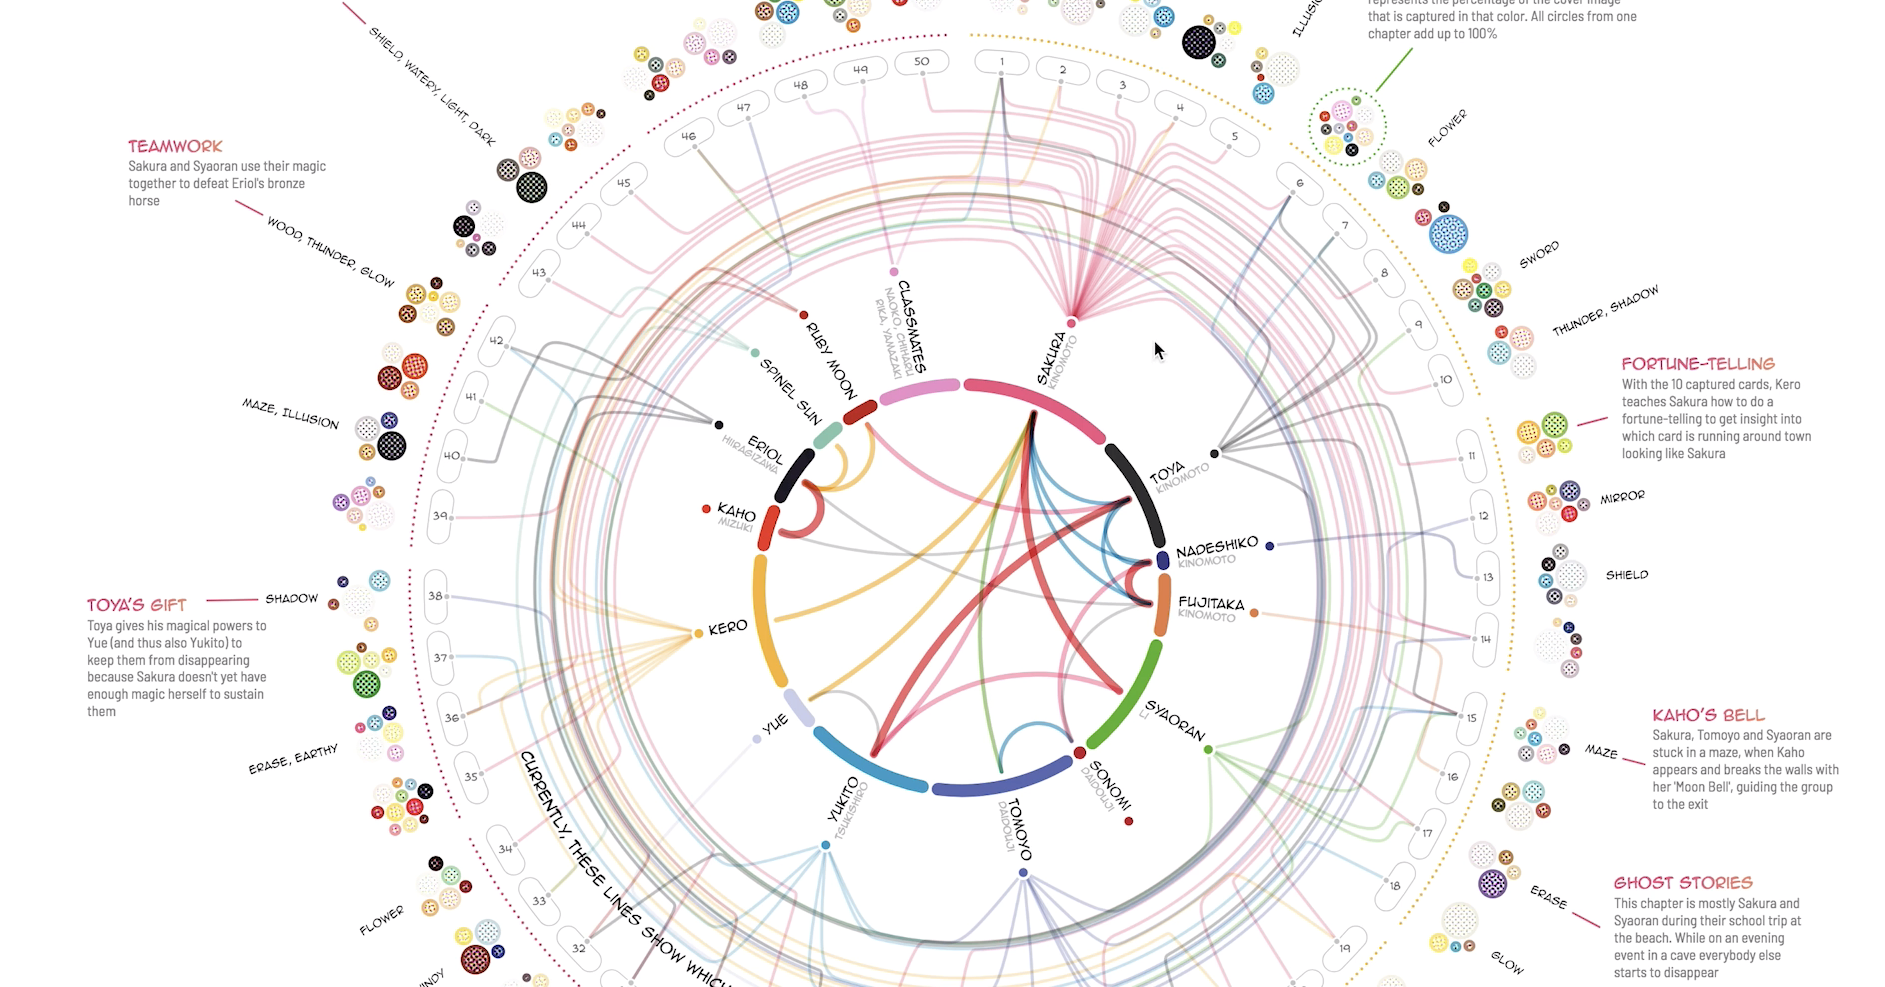
- network chart
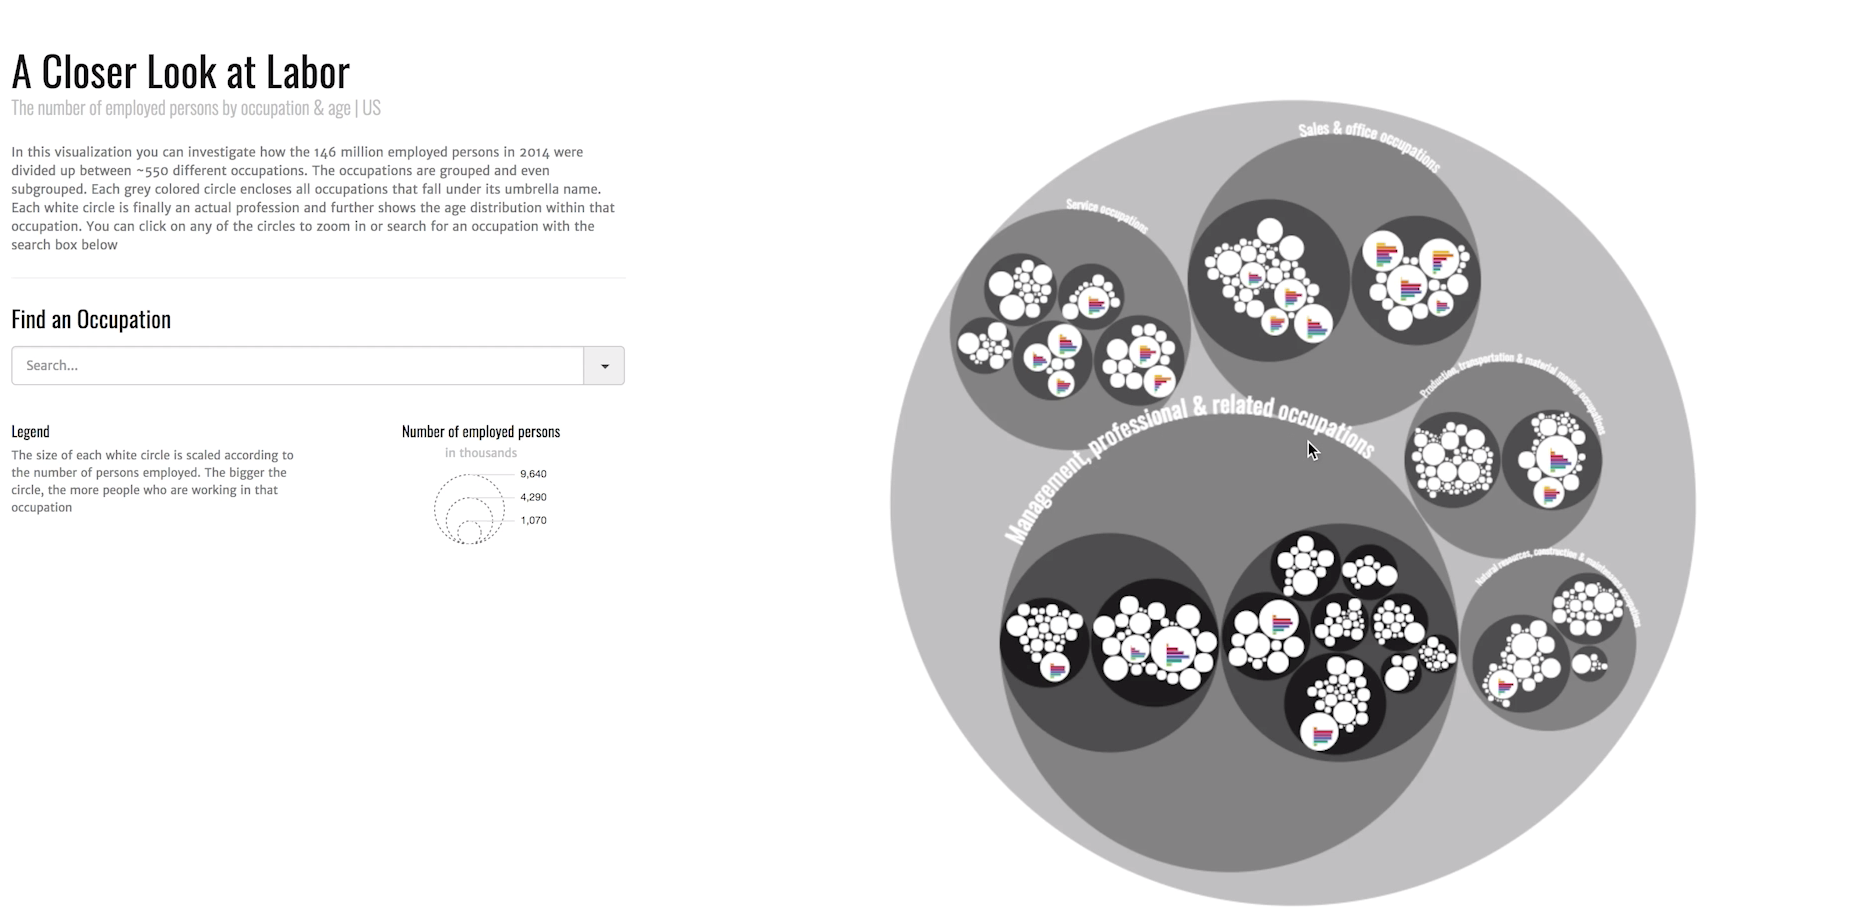
- Circle packing
- Added bar charts in each circle
- Click to zoom
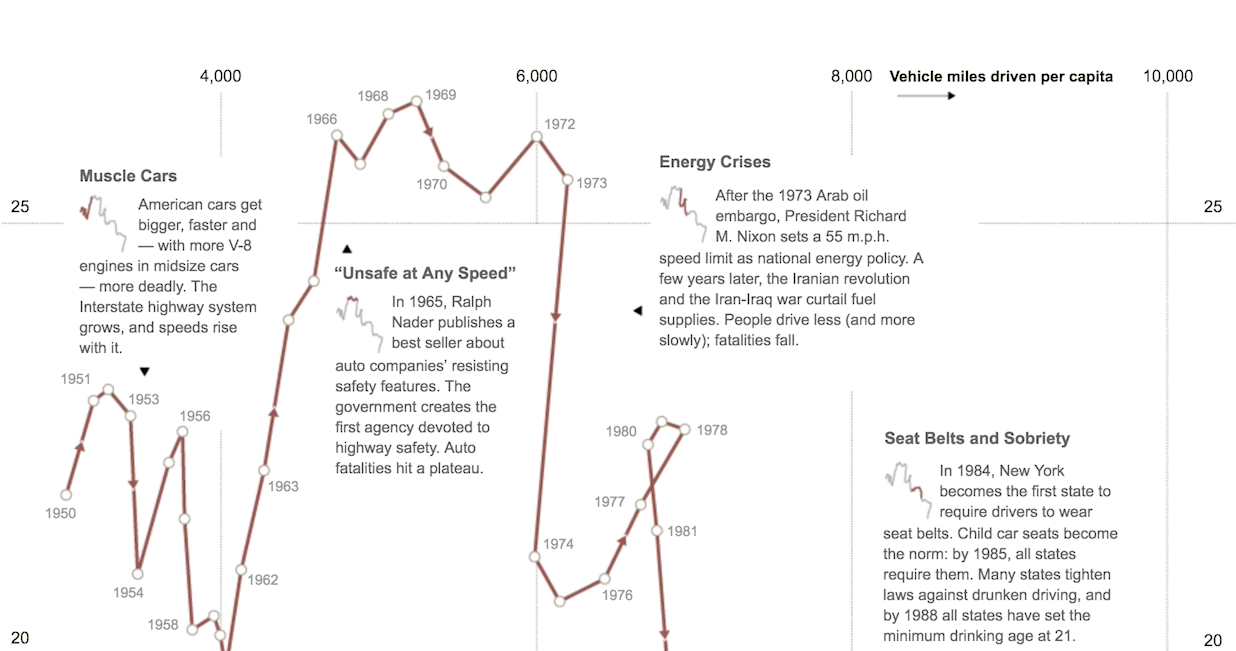
- Multiple graphs into an union shape
- Usually have one thing in common, usually it's time

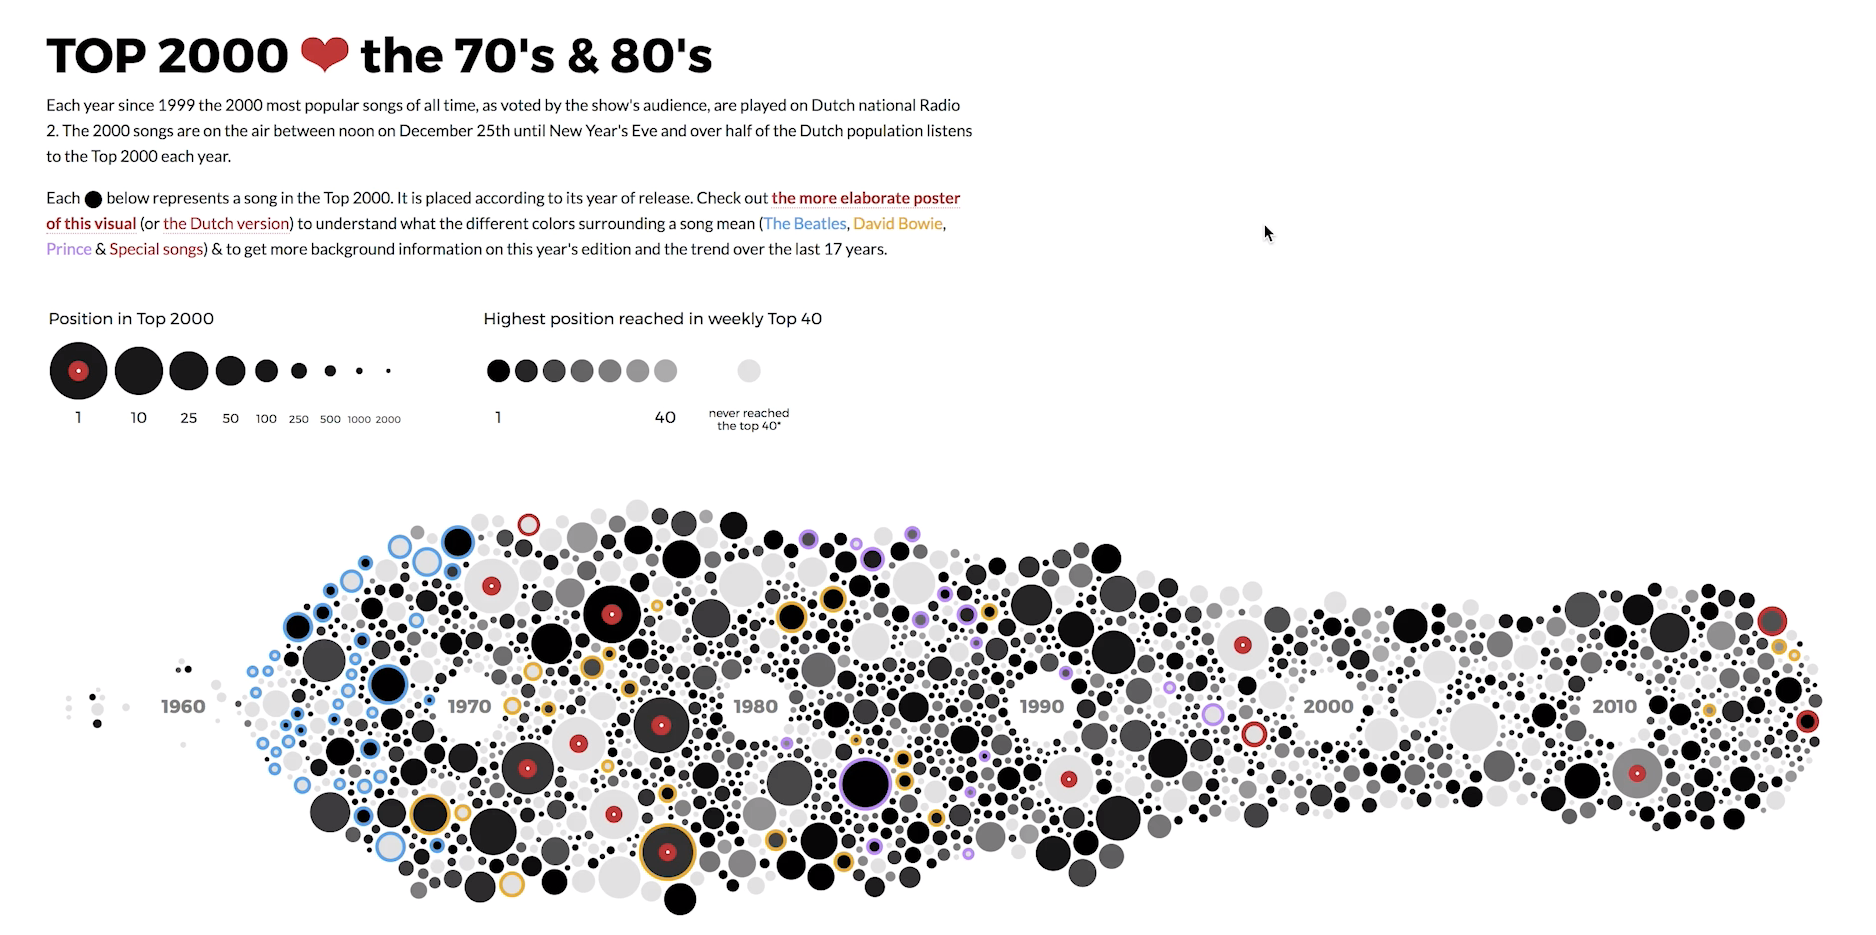
- another example
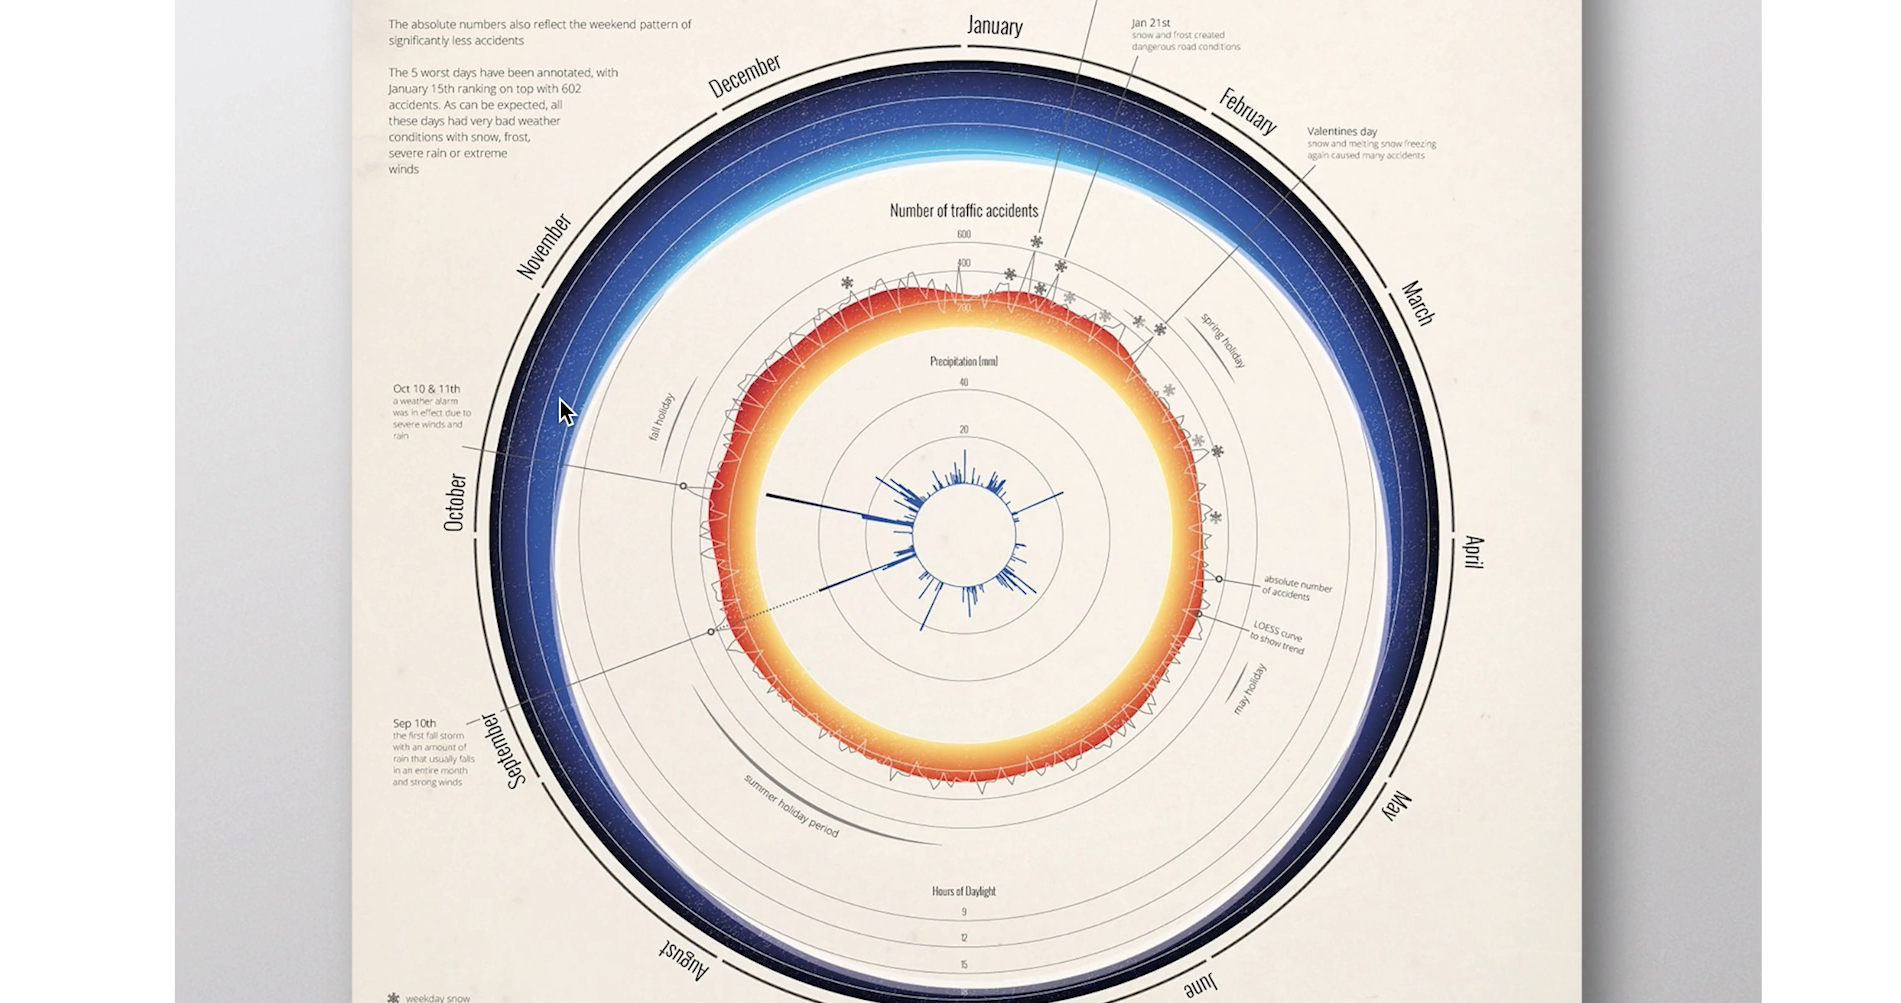

-
example without time
-
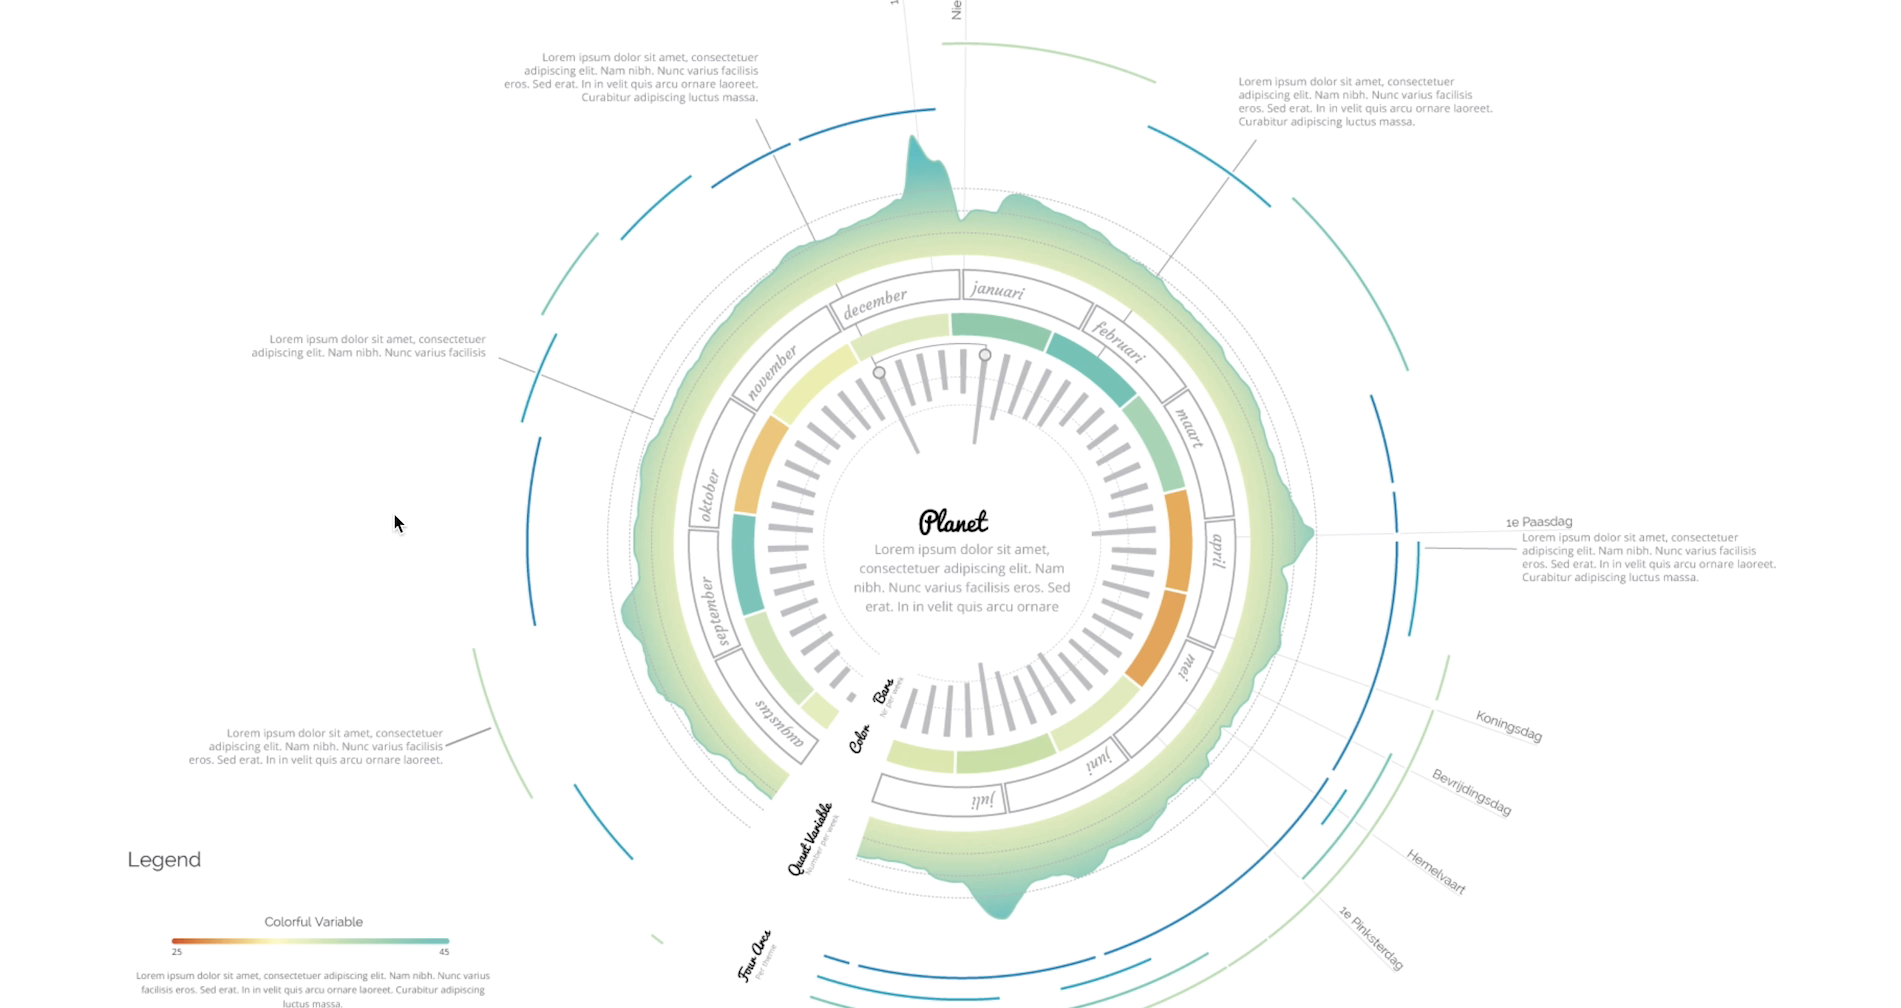
Combine the UI
-
Timeline uses the brush, element below which shows a partial view of the chart which can be scrolled
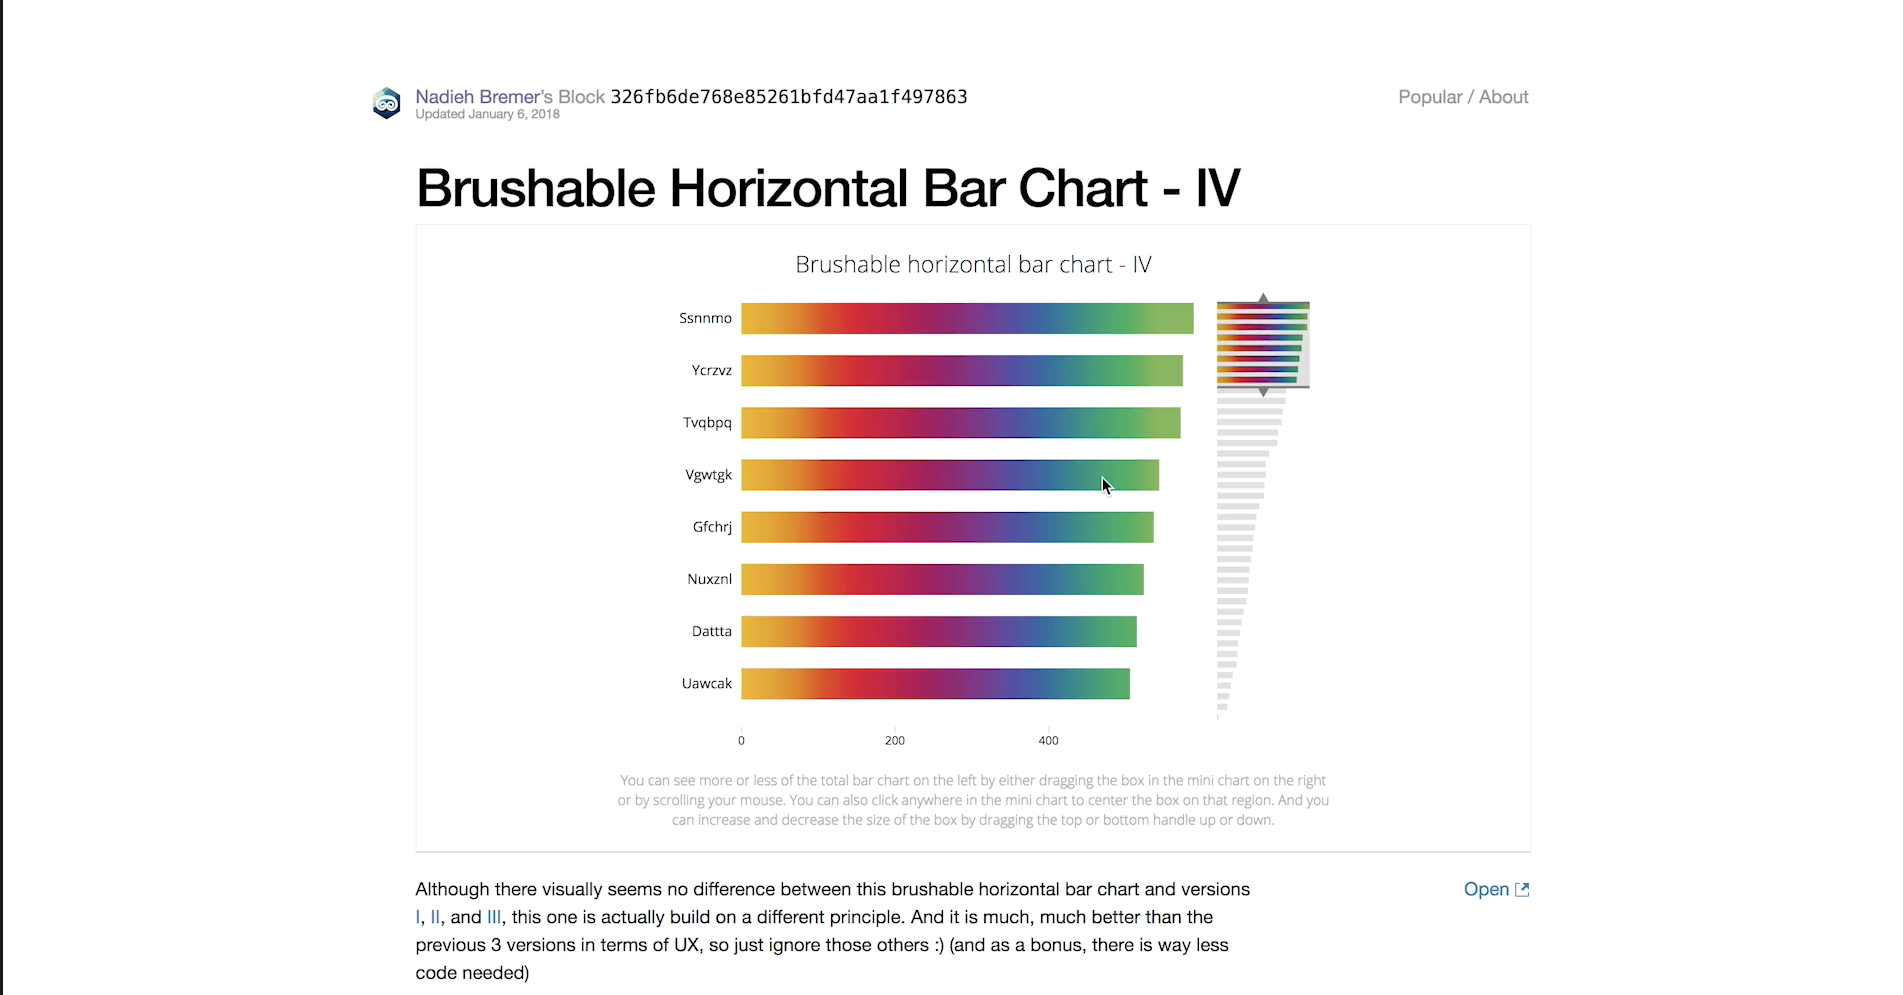
-
She used that here for bar charts The Data Visualisation Catalogue
-
You can use this site for inspiration to combine
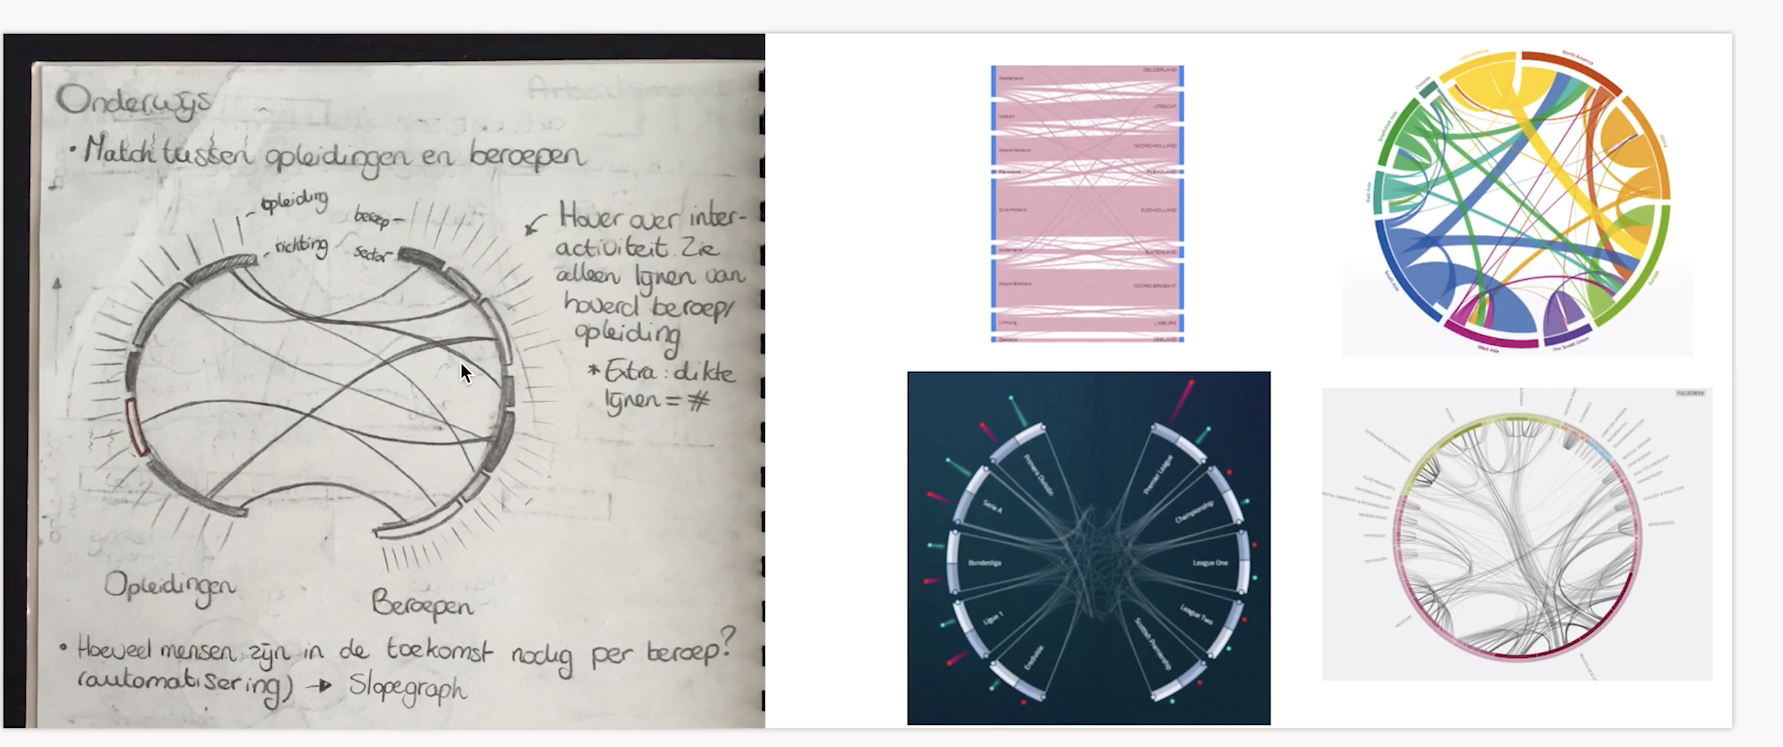
#2 Reusing charts
- She uses Pinterest to collect interesting charts
- Reusing is more advanced than combining
- You need more knowledge about each chart
- This went naturally because she sketches all her charts first
- It's conceptually more advanced, not creating them (it's more difficult to come up with them)
#3 Designing charts
-
Visual elements
- Fonts
- Colours
- Layout
-
Usually the defaults are not that good
-
Don't trust the defaults
-
Remove grid lines if they are not needed
-
Mute the axes if they are not the most important and highlight the actual data
-
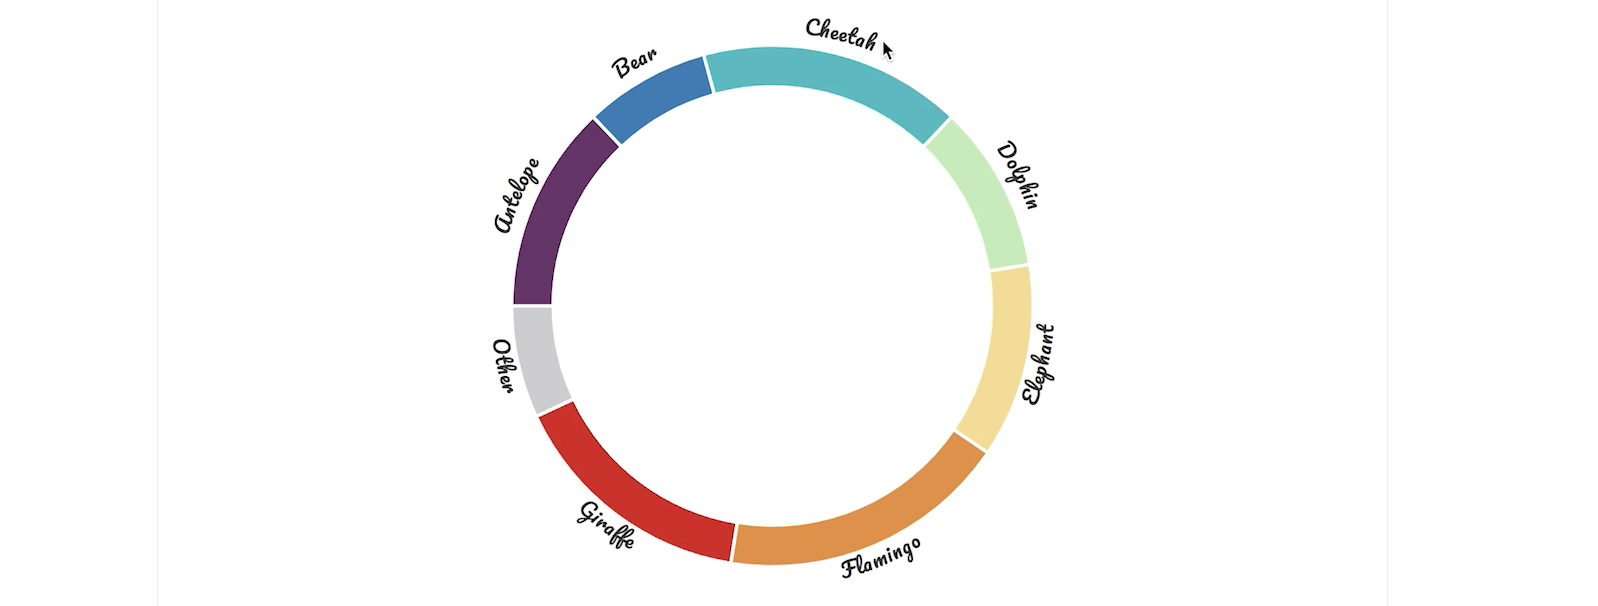
Try out different colour palettes, they have real meaning with charts
-
She usually starts out with a rainbow because it's fun
-
Then look at layout
-
Where do you place the legend, data, axes
-
Hierarchy of charts
- Data
- Title
- Grid lines
- Legend
- Extra annotation
-
West left to right, top to bottom
-
Then look at effects
-
A simple effect is the blend modes
) Color blending - Infinity showcase
Color blending - Infinity showcase- She uses multiply and screen (whiter and darker)
- Use this when you have overlap in charts
- If something is on top it's not fair for the one below
-
Use gradient to make them more interesting
-
Or a gooey effect
-
Or motion blur to symbolise flow
-
Animated gradient to highlight flow
-
Place legend, and extra info as close to the data
- Like here, labels are next to each
#4 Hacking visualisations
- Most advanced level of going beyond the basics
- There is often something close to what you want. So start from their and hack until you got your results
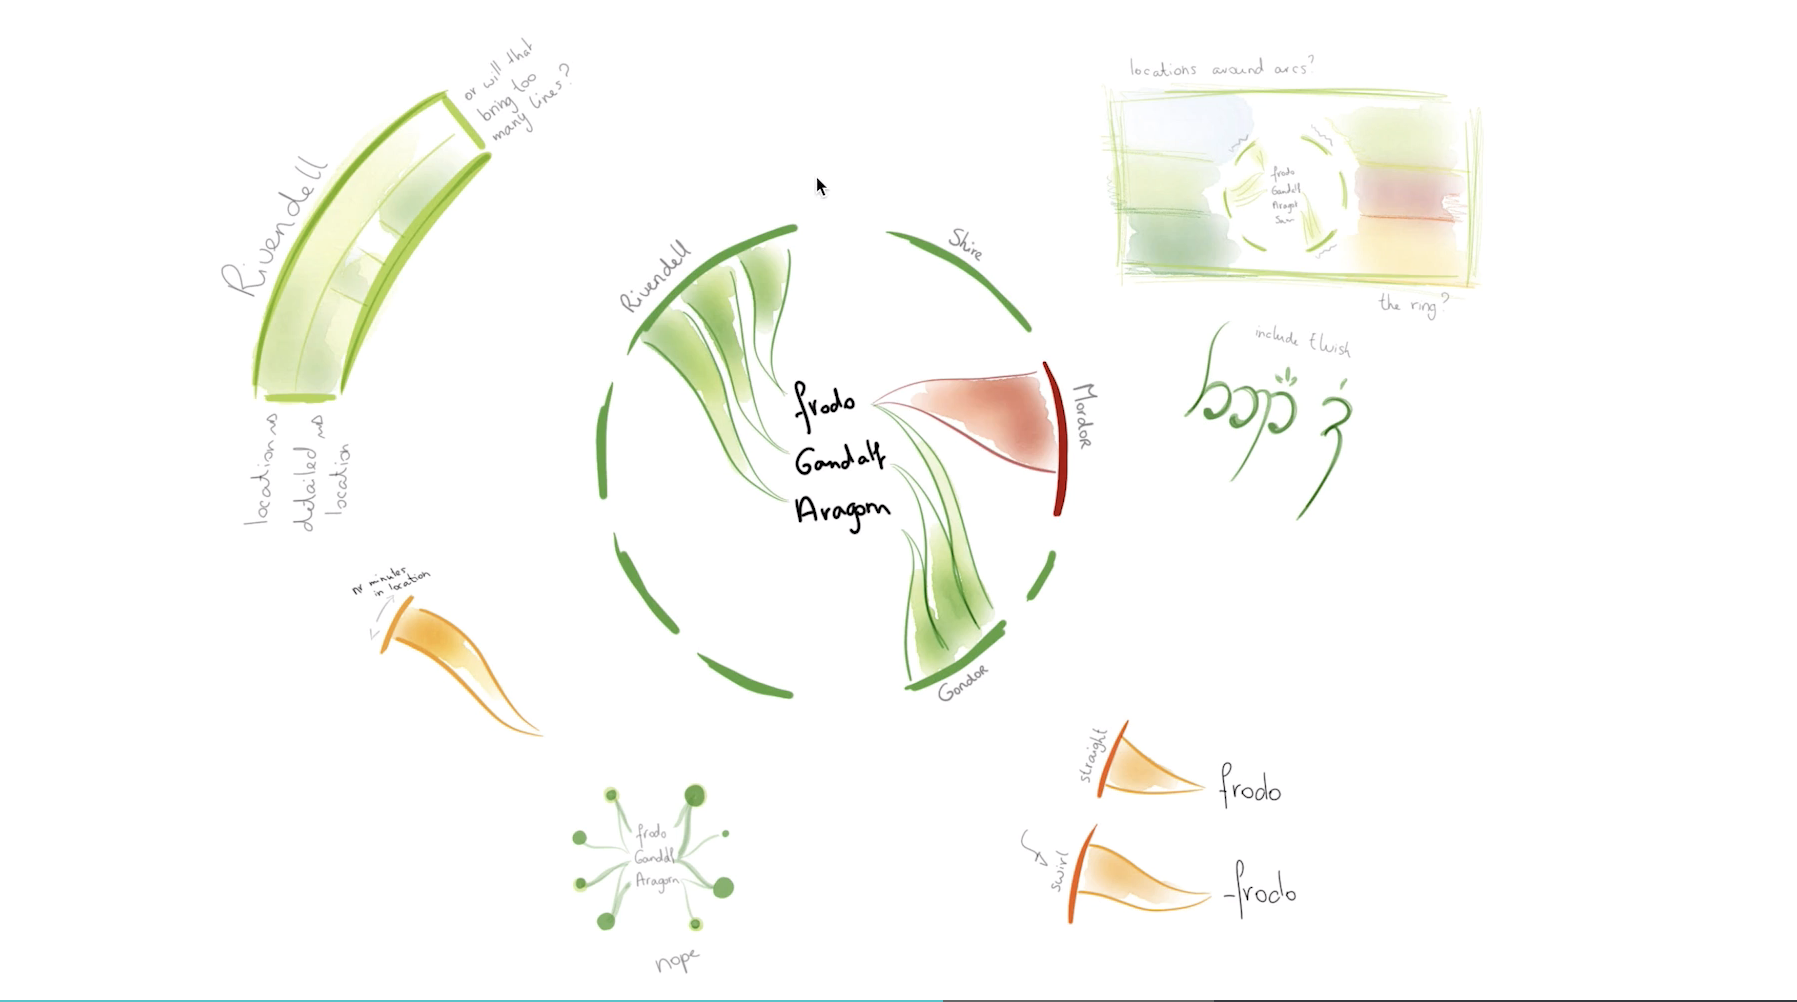
- She makes really cool sketches
- Which makes presenting the process more clear and interesting
- Hacking away is starting with the work from someone else, changing the source code and making it your own
- She recommends D3 for this since you have the most freedom with it, you are less constraint by the tool
#5 Tips for gathering data
- Pick a topic that truly interests you (LOTR for her)
- Google a topic with data or dataset
- They are usually hidden in a Github repo or blog or excel sheet
- Scrape data from websites when data is structured (IMDB works well for this)
- There are tools for this you can use by dragging and dropping
- Use API's
- Combine, she scraped books from Amazon and combined that with the goodreads API
- Ask others
- Create manually