Debugging With VUART - MarkDing/IoT-Developer-Boot-Camp GitHub Wiki
Table of Contents
The VUART is short for Virtual UART. It's actually implemented by the SWD debug interface. To use this interface, you just need to connect the four pins of the SWD interface, which are SWCLK, SWDIO, SWO and the GND. All these four pins are included in the 10-pin Mini-Simplicity Connector. Therefore, it's highly recommended to reserve this connector in your custom board.
In the output direction, debug info will be output through SWO pin from the ITM (Instrumentation Trace Macrocell) module of the ARM Cortex core.
In the input direction, data are write to the device through Segger RTT. This function must be used together with the WSTK (Wireless Starter Kit).
For more details about the debug interface, please refer to AN0043.
There are two approaches to setup the VUART connection.
- Connect your WSTK to PC with USB cable.
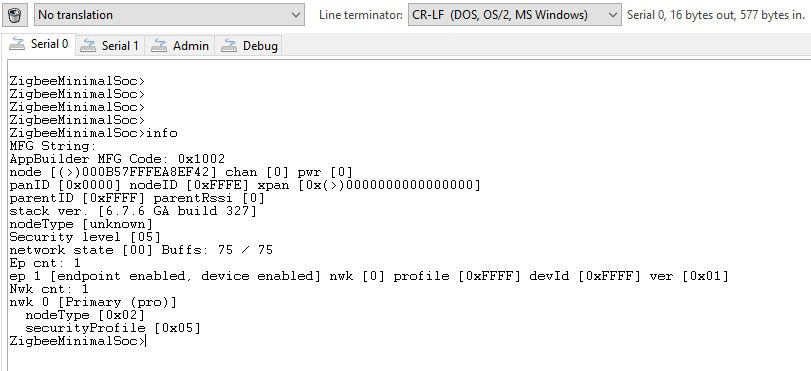
- Select your kit in "Debug Adapters" window, right click and select "Launch Console".
- Turn to "Serial0" tab, press enter, and you will send the command line prompt.
-
On our WSTK, there is a RJ45 ethernet connector on the up-left corner of the main board. You can connect the WSTK to internet with this connector. After that, the main board will get an IP address through DHCP. The IP address will be displayed on the LCD screen.
-
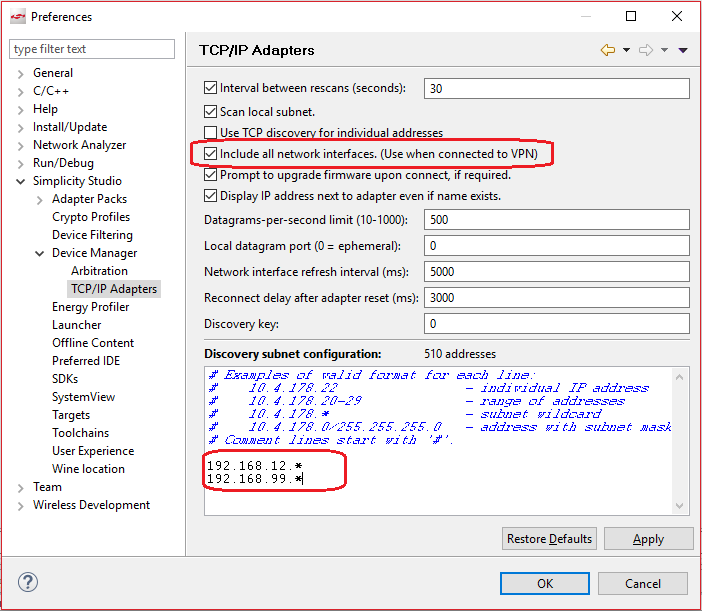
Make sure the WSTK and your PC are in the same subnet. Open Simplicity Studio, then open the preferences through menu "Window"-->"Preferences". Please check the option "Include all network interfaces" if you have multiple network interface. You can also specify the subnet to make the adapter easier to be discovered.
- After that, the WSTK should be discovered automatically.
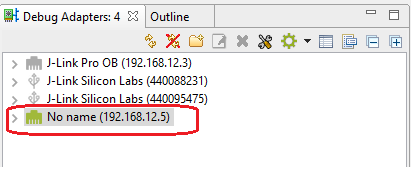
- Select the adapter, right click and then select "Launch console". Choose tab "Serial 0", the debug info from VUART will be displayed here.
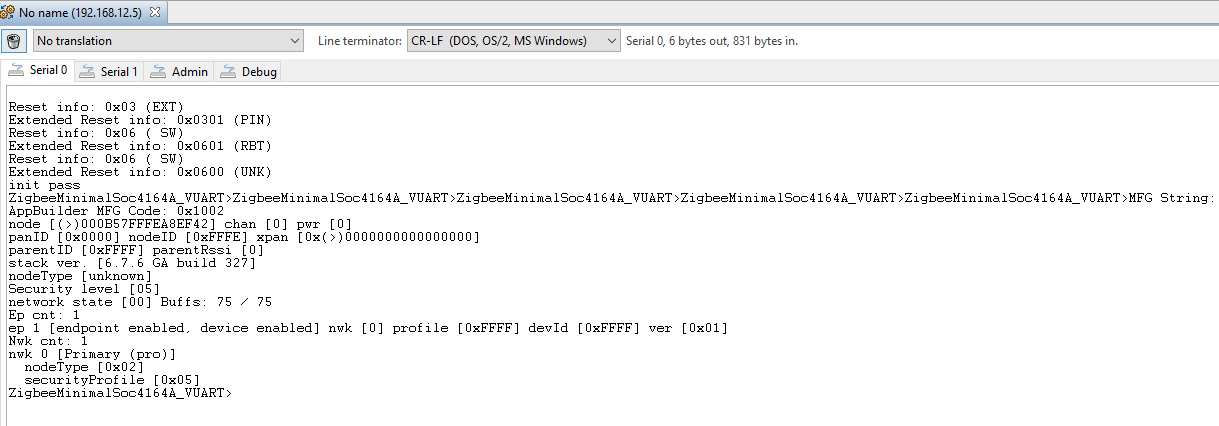
If your application allows input, you can also input commands here.
-
If you don't want to Simplicity Studio built-in console, there is another way.
-
Start a CMD windows, change to C:\SiliconLabs\SimplicityStudio\v4\developer\adapter_packs\silink(This path may differ according to your Simplicity Studio installation).
-
Run the following command to map the J-Link debugger to a TCP port.
silink -sn 440088231 -automap 4900 -trace=false -polldelay=5000
- Use the terminal tool (i.e. Teraterm) to open the TCP port 4900. "File"-->"New Connection".
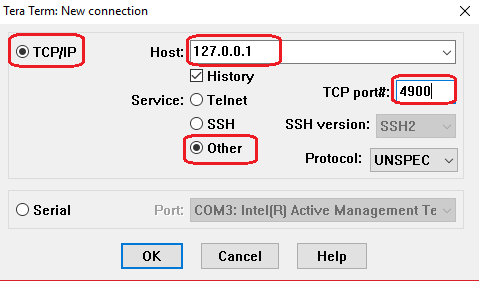
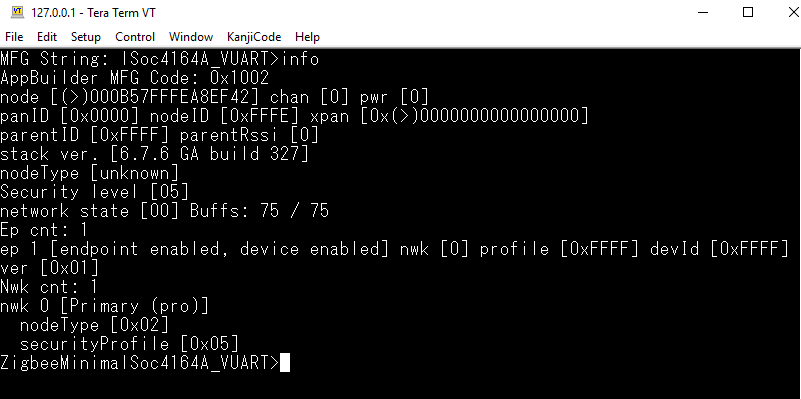
- After that, click OK to open. Then in the terminal, you can input command and also get output.
 Home |
 ![]() Zigbee |
Zigbee | ![]() Bluetooth |
Bluetooth | ![]() ZWave |
ZWave | ![]() Proprietary |
Proprietary | ![]() Hardware |
Hardware | ![]() Common
Common
All resources of this repository are released under license CC BY-NC-ND 4.0 