Dashboard: dashboard - MaksimAbelchuk/RnS_Docs GitHub Wiki
Overview
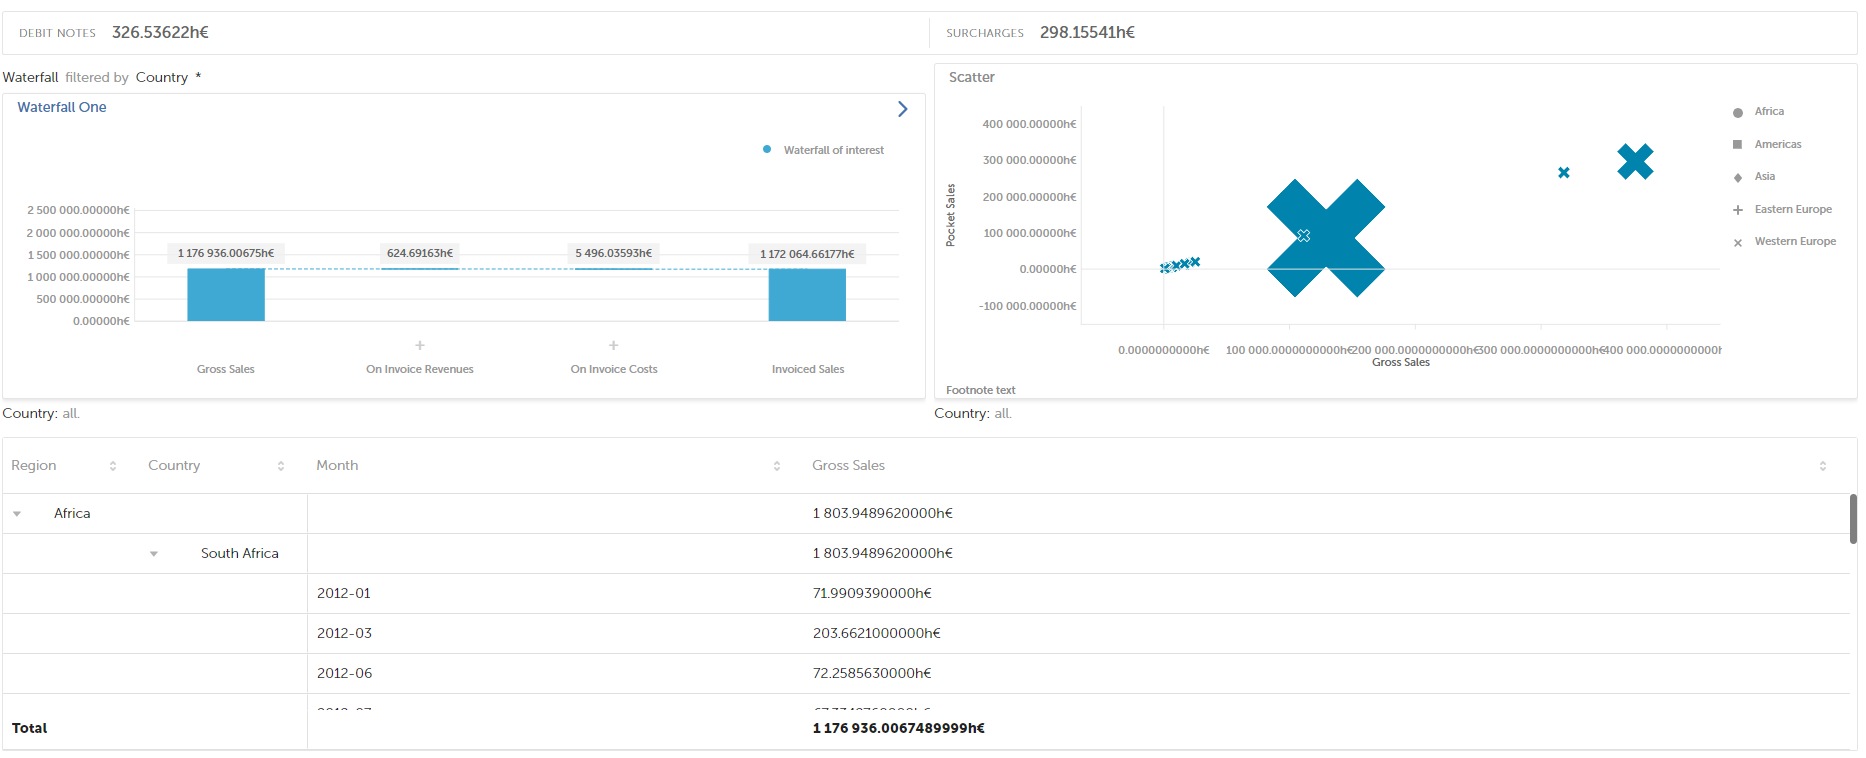
Dashboard is a tool used to combine several reports into one. All the components of the dashboard are configurable and optional. Reports can be placed in rows and in columns. Configuration from the example consists of a KPI panel, 2 waterfall charts, and a data table. Their position relative to each other is configurable and placed in the layout part of the config file, the features of the dashboard control zone are defined in the Control_zone section, each element's configuration is placed in the Chart Config section.
visualization_id: dashboard
The header of the dashboard config
The header of the dashboard config is the same as for any other chart. You start with name, title, dataset, visualization id and connection.
Please, note that even though the dashboard has various
Example of a header for the dashboard:
name: test-chem-dashboard
title: Test Dashboard
connection_name: test-chem
dataset_name: test-chem
visualization_id: dashboard
Setting dashboard widgets
The next important part of the dashboard config is defining the widgets. All these are added into the components section under the chart_config. Each widget config here is a copy of the same chart's config. Please, note that here you can define the widgets in any order as the order of display is defined in the layout section.
chart_config:
  components:
  - name: table
    title: Table
    visualization_id: table
    display_settings:
      title:
        show: false
      header:
        show: false
      footer:
        show: false
In this section:
- components - widgets on the dashboard. Their location is set in layout section, here we just set the widgets.
- name - component name which is to be added to the dashboard;
- title - component title at top of section with navigation functionality to the extended component content;
- visualization_id - ID of the dashboard component;
- type - component type ID used to render the section;
- display settings:
- footnote text - the text in the footer;
- title - shows the title (can be true or false)
- header - the title of the chart is displayed (can be true or false)
- footer - the information in the footer is displayed (can be true or false)
- name - component name which is to be added to the dashboard;
Layout
The layout is the part of the config, where a user can define all the components of the dashboard.
layout:
  columns_sizes:
  - 50%
  - 50%
  rows_sizes:
  - 7%
  - 50%
  - 43%
  rows:
  - components:
    - name: kpi_panel
      horizontal_span: 2
  - components:
    - waterfall_one
    - waterfall_two
  - components:
    - name: table
      horizontal_span: 2
- layout - declaration of layout (css-grid) for dashboard components;
- columns_sizes - declare the amount of columns (split the css-grid vertically) and relative width of available screen;
- 50% - 1st column declaration with relative width 50% of screen;
- 50% - 2nd column declaration with relative width 50% of screen;
- rows_sizes - declare the amount of rows (split the css-grid horizontally) and relative height of available screen;
- 7% - the relarive size of the screen used for the row of KPI panel.
- 50% - 1st row declaration with relative height 50% of screen;
- 43% - 2nd row declaration with relative height 43% of screen;
- rows - fill the layout using components;
- components - fill the 1st row of layout;
- name - component description to insert into 1st row and for the 1st column;
- horizontal_span: 2 - you can use the span properties to set up how many rows (vertical_span) or columns (horizontal_span) the component occupies.
- components - fill the 1st row of layout;
- columns_sizes - declare the amount of columns (split the css-grid vertically) and relative width of available screen;
Rows and columns sizes can be set in percent and in pixels. To set in pixels, add px after the number.
Control zone
control_zone:
    default_merging_mode: merge
    merging_mode:
      controlZone:
        view: split
        filters:
          filters: merge
          comparison-filters: merge
        settings:
          timeInterest: hide
Default merging mode is the way how all the controls are placed:
- split - if this one is chosen, then controls are staying separate, so a user can choose different controls for each chart.
- merge - if this one is chosen, then the user cannot choose the controls for each chart on the dashboard. The controls are chosen for all the charts at a time.
- hide - if this one is chosen, we can choose which controls for a chart to show.
Config Example:
control_zone:
    default_merging_mode: split
    merging_mode:
      controlZone:
        view:
          container_measure: hide
          line_measures: hide
          dot_size: hide
          scatter_shape: hide
        filters: merge
        settings:
          tooltip_measures: merge
          timeInterest: hide
          timeCompareTo: hide
          custom_lines: hide
          labels_switch: hide
To see the difference in UI, please, view the next screenshots:
You can also different merging mode settings to Control Zone. You can hide chart controls and at the same time merge filters and split settings. BUT if no merging mode is set, then default merging mode will be used.
Default merging mode can also be applied to the header and footers of the charts.
- split - all the controls chosen will be shown on the KPI Panel, but they will be separated for each chart by a semicolon.
header:
  show: true
  default_merging_mode: split
footer:
  show: true
  default_merging_mode: split
  merging_mode:
    table: merge
- merge - all dimensions from Series or Color by should never merge with dimensions from grouping. Another header template should be used: <measure_widget_1>, <measure_widget_2>, <measure_widget_3> grouped by <groupings_widget_1>, <groupings_widget_2>, <groupings_widget_3> per <series_widget_1>, <series_widget_2>.
header:
  show: true
  default_merging_mode: merge
footer:
  show: true
  default_merging_mode: merge
  merging_mode:
    table: merge
- hide - the controls will not be displayed in the header (the header will be shown empty)
header:
  show: true
  default_merging_mode: hide
footer:
  show: true
  default_merging_mode: hide
  merging_mode:
    table: merge
Merge-split mode for filters on the dashboard
In case you have a lot of charts on the dashboard and want to quickly filter all of them by any filter, while still having their specific filters turned on, you can use merge-split mode in filters.
This allows to quickly filter all the charts by a filter and add a specific filter to the widgets.
"control_zone": {
  "default_merging_mode": "split",
  "merging_mode": {
    "controlZone": {
      "view": "split",
      "filters": {
        "filters": "merge-split",
        "comparison-filters": "merge"
      },
      "settings": {
        "timeInterest": "hide"
      }
    }
  }
}
Explorers on dashboard
You can set up explorers on the dashboard. Configuration is pretty similar to the usual explorers' configuration but has a few additional moments which are to be considered when configuring.
Config example
explorers_config:
  test-promo-bar:
    control_zone:
    - sources:
      - - controlZone
        - view
        - _components
        - test-rns-promo-effectiveness
        - groupings
      destination:
      - controlZone
      - view
      - groupings
    selections:
    - keys:
      - groupings
      - series
      destination:
      - controlZone
      - filters
      - filters
Config explanation
- explorers_config
- test-promo-bar - a chart we move explorers to.
- control_zone
- sources - define sources on the dashboard
- controlZone
- view - define the tab which sends data
- components - widget which sends data
- test-rns-promo-effectiveness - name of the component to send data from
- groupings - which control we send data from
- destination: - define where we send the data
- ControlZone
- view
- groupings
- selections: - define actions performed when we have selections and explore
- keys: - what from selected dot / bar is explored
- control
- destination: - where on destination chart it is sent
- ControlZone
- filters - filters tab
- filters - 'filters' control
- test-promo-bar - a chart we move explorers to.
Config example
name: test-chem-dashboard
title: Test Dashboard
connection_name: test-chem
dataset_name: test-chem
visualization_id: dashboard
chart_config:
  components:
  - name: kpi_panel
    title: KPI
    visualization_id: kpi
    display_settings:
      title:
        show: false
  - name: waterfall_one
    title: Waterfall One
    visualization_id: waterfall
    display_settings:
      title:
        link: https://example.com
        open_new_tab: true
    chart_config:
    - name: gross_sales
      bucket: total
    - name: on_invoice_revenues
      bucket: delta
      flow: down
      items:
      - name: surcharges
        bucket: delta
        flow: down
      - name: debit_notes
        bucket: delta
        flow: down
    - name: on_invoice_costs
      bucket: delta
      flow: down
      items:
      - name: credit_notes
        bucket: delta
        flow: down
      - name: discounts
        bucket: delta
        flow: down
    - name: invoiced_sales
      bucket: total
  - name: scatter
    title: Scatter
    visualization_id: rns-scatter
    display_settings:
      footnote: Footnote text
      header:
        show: false
  - name: table
    title: Table
    visualization_id: table
    display_settings:
      title:
        show: false
      header:
        show: false
      footer:
        show: false
  layout:
    columns_sizes:
    - 50%
    - 50%
    rows_sizes:
    - 7%
    - 50%
    - 43%
    rows:
    - components:
      - name: kpi_panel
        horizontal_span: 2
    - components:
      - waterfall_one
      - scatter
    - components:
      - name: table
        horizontal_span: 2
  control_zone:
    default_merging_mode: merge
    merging_mode:
      controlZone:
        view: split
        filters:
          filters: merge
          comparison-filters: merge
        settings:
          timeInterest: hide
  header:
    show: true
    default_merging_mode: merge
  footer:
    show: true
    default_merging_mode: merge
    merging_mode:
      table: merge
explorers_config:
  test-chem-bar:
    selections:
    - keys:
      - measures
      destination:
      - controlZone
      - view
      - measures