[WIP] Segmentation Tree: segmentation_tree - MaksimAbelchuk/RnS_Docs GitHub Wiki
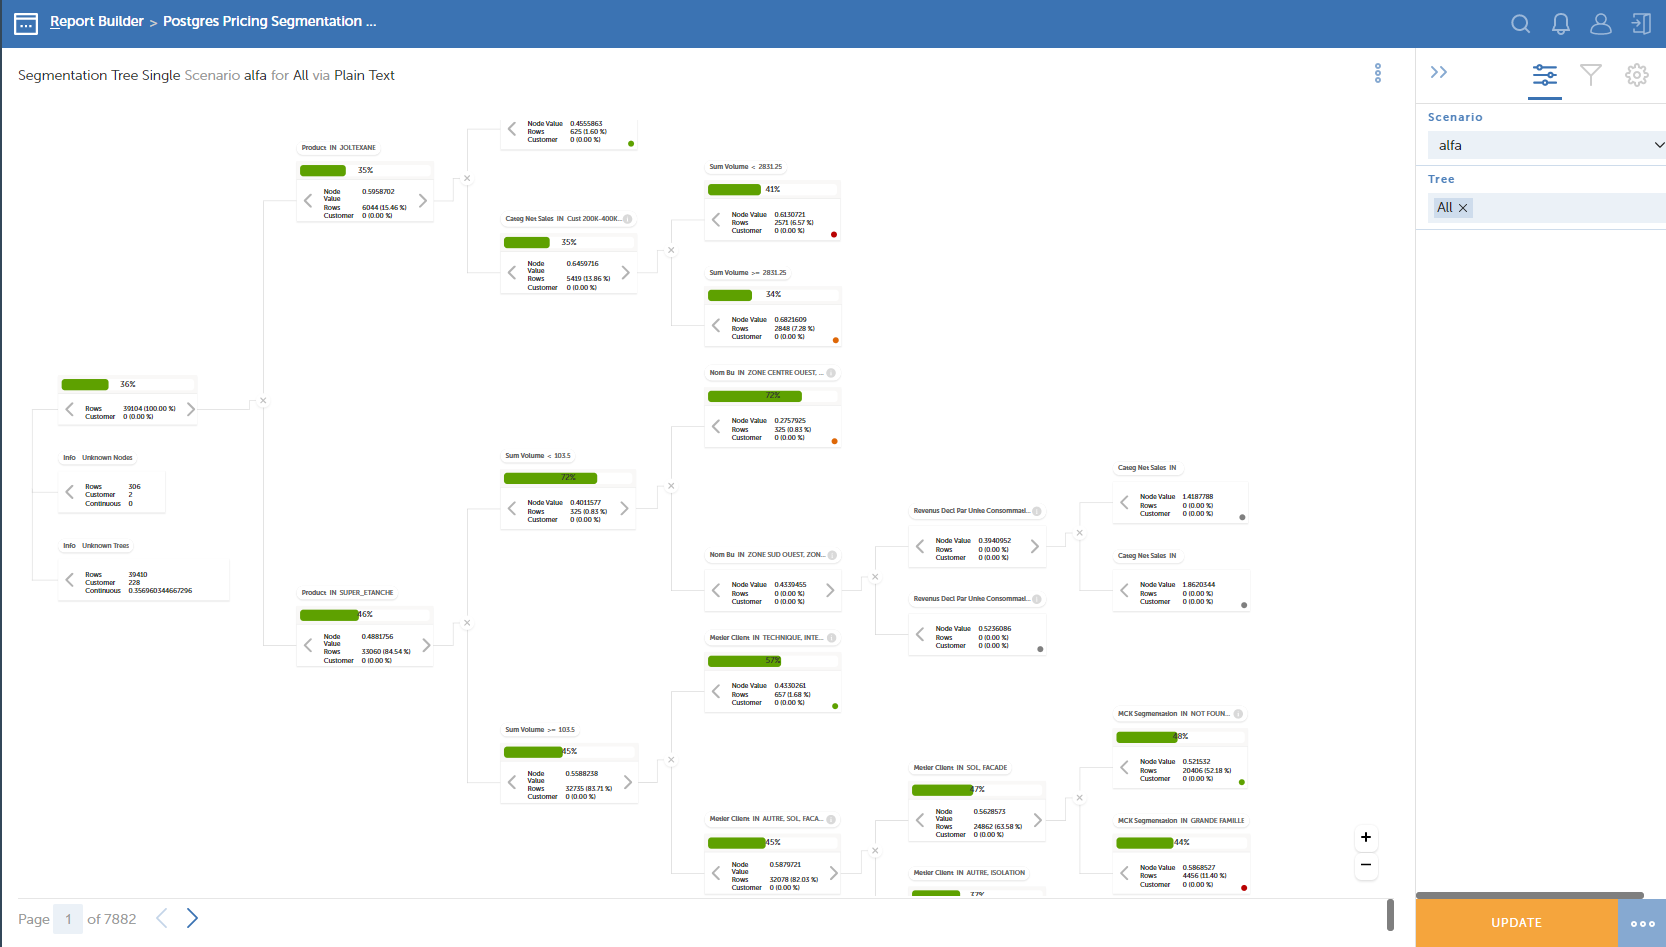
Overview
visualization_id: segmentation_tree
Configuration guide
Basic info
The structure of the basic info is similar to any other chart:
name: segmentation-tree
title: Segmentation Tree
connection_name: test_chem
dataset_name: test-chem
visualization_id: segmentation_tree
Multiple trees
The feature allows building various charts at a moment in one chart.
chart_config:
  multiple: true
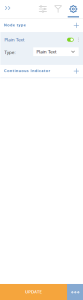
Row type
chart_config:
  row_type: type
Tree
Layout
chart_config:
  tree:
    layout:
      orientation: horizontal
      max_zoom_value: 15
      group_padding: 24
      siblings_padding: 32
      node_levels_padding: 44
Nodes
chart_config:
  tree:
    node:
      value: node_value
      type: node_type
      depth: node_depth
      id: node_id
      variable: node_variable
      relation: node_relation
      condition_value: node_condition_value
Node indicators
chart_config:
  tree:
     node_indicators:
      show_continuous: false
      show_categorical: 0
      show_info_node: false
Node structure
chart_config:
  tree:
    node_struct:
      id: struct_node_id
      leaf_id: struct_leaf_node_id
Variables
chart_config:
  tree:
    vars:
      histogram_stick: recommended_price
      histogram_variable: unit_price
      impact_baseline: target_value
      impact_delta: impact
      plain_text_variable: customer_id
      plain_text_target_variable: unit_price
      tree_selection_variable: product_id
Grid
chart_config:
  grid:
    page_size: 5
    max_column_width: 25
    columns:
    - data_node_id
    - customer_id_orig
    - customer_score
    - volume
    - unit_price
    - margin
    - revenue_orig
    - n_prod
    - avg_price_per_prod
    - revenue_adjusted
    - total_revenue_adj
    - product_share
    - revenue
    - product_id
    - customer_id
    - region
    - payment_terms
    - packaging
    - transport
    - key
    - cluster_level
    - avg_cust_prod_rev_size_num
    - avg_cust_prod_vol_size_num
    - distinct_cust_per_prod_num
    - total_cust_prod_trans_counts_num
    - total_cust_trans_counts_num
    - volume_average_num
    - predicted_values
    - train_flag
    - percentile
    - target_value
    - recommended_target_value
    - recommended_price
    - impact
    - value_at_stake
    row:
      node_id: data_node_id
- multiple - can be true or false. If true, then you can use multiple scenarios (datasets).
- row_type - define the type of the row.
- scenario - dimension used to distinguish scenarios.
- tree - dimension used to distinguish trees.
- node_indicator
- show_continuous - can be true or false. If true, then the continuous indicator will be shown on the chart.
- show_categorical: 1
- histogram_bars_default - default number of bars in histogram (in each node).
- histogram_bars_variants - number of bars in histogram (Can be 4, 5, 10, 20).
- layout:
- orientation - how the tree is placed. Can be horizontal and vertical.
- group_padding - padding between groups in pixels.
- siblings_padding - padding between nodes in one group in pixels
- node_levels_padding - adding between levels in pixels.
- node_struct:
- id - a dimension where the node is stored
- leaf_id - a dimension where leaf-node id is stored
- vars:
- variable - a dimension where the variable is stored
- value - a dimension where the value is stored
- grid:
- max_column_width - maximal width of a column.
- columns - names which will be listed in the footer of the chart.
- row:
- node_id - a dimension where node id stored
- types:
- other:
-
- PlainTextType
-
- LocalHistogramType
-
- GlobalHistogramType
-
- GlobalPercentileHistogramType
-
- NodeImpactType
-
- TreeImpactType
-
- settings:
- scales_id: numbers
- histogram_bars_default: 10
- histogram_bars_variants:
-
- 4
-
- 5
-
- 10
-
- 20
-
- node_indicator
- row_type - define the type of the row.
Other features
Remove 'Rows' on a leaf node
You can remove 'Rows' from a leaf node by using this property in the config:
chart_config:
  plain_text_show_rows: false