OpenTelemetry Agent using Kubernetes - MLKEREN/SOFTWARE-DOC-DEV-MIYA-KEREN GitHub Wiki
OpenTelemetry is a vendor-neutral, open-source observability framework for instrumenting, generating, collecting and exporting telemetry data such as traces, metrics and logs. Use OTel's collection of APIs, SDKs and tools to collect and export observability data from your environment to Coralogix.
This guide shows you how to run the OTel Collector in Kubernetes to export your data to Coralogix. It assumes that you have already instrumented your application with OTel SDKs and set up a receiver for your data.
-
Sign up for a Coralogix account and access your private key.
-
Install any open-source text editor.
-
Install Kubernetes. This should include installation of the command-line tool kubectl, designed to operate on your Kubernetes cluster.
-
Install and configure Helm. We suggest you use this guide to familiarize yourself with the basics of using Helm to manage packages on your Kubernetes cluster.
Coralogix has an exporter available for the OpenTelemetry Collector which allows you to forward trace and metric data from OpenTelemetry SDKs to Coralogix. The following section shows you how to easily install the exporter by adding it your to your OpenTelemetry Collector configuration.
1. Install the Coralogix Helm Chart Repository
Using your text editor, open a new terminal and install the Coralogix Helm chart repository:
helm repo add coralogix-charts-virtual https://open-telemetry.github.io/opentelemetry-helm-chartshelm repo update2. Create a Secret Private Key
Create a secret with your Coralogix private key under a secret key called PRIVATE_KEY, inside the same namespace in which the helm chart is installed:
export PRIVATE_KEY=<private-key>export NAMESPACE=<namespace>kubectl create secret generic coralogix-keys -n $NAMESPACE --from-literal=PRIVATE_KEY=$PRIVATE_KEYHint: If you are interested in seeing the details of your
secretcalledcoralogix-keys, run:kubectl get secret coralogix-keys -o yaml -n <namespace>The created secret should look like this:
apiVersion: v1
data:
  PRIVATE_KEY: <encrypted-private-key>
kind: Secret
metadata:
  name: coralogix-keys
  namespace: <the-release-namespace>
type: Opaque
1. Create YAML-Formatted Override File
Create a new YAML-formatted file that defines certain values for opentelemetry-collector to be used as an override file when installing the associated OTel collector chart.
In order to send your data to Coralogix, you are required to declare particular variables into your template:mode, extraEnvs and config.
-
mode: There are multiple ways to deploy the OpenTelemetry Collector in a Kubernetes infrastructure. Given its flexibility and resource optimization, the most common and recommended mode for deployment is daemonset. Alternative modes such as deployment and statefulset should be used for small clusters with minimal resources. -
extraEnvs: Insert your Coralogix private key, as demonstrated in the example below. Insert APP_NAME of your choice, which should be identical to the Application name in theconfigsection. -
config: You have the option of sending traces, metrics and / or logs to Coralogix. The example below includes all three. For each, you will need to include your Coralogix endpoint, as displayed in the table below, which derives from the cluster URL associated with your Coralogix account. The example below adopts a EUROPE1 endpoint. In addition, choose the Application and Subsystem names that suit you. Find out more about the importance of organizing your data with Coralogix using Application and Subsystem names.
Region **Traces Endpoint ** **Metrics Endpoint ** **Logs Endpoint ** USA1 tracing-ingress.coralogix.us:9443 otel-metrics.coralogix.us:443 otel-logs.coralogix.us:443 APAC1 tracing-ingress.app.coralogix.in:9443 otel-metrics.coralogix.in:443 otel-logs.app.coralogix.in:443 APAC2 tracing-ingress.coralogixsg.com:9443 otel-metrics.coralogixsg.com:443 otel-logs.coralogixsg.com:443 EUROPE1 tracing-ingress.coralogix.com:9443 otel-metrics.coralogix.com:443 otel-logs.coralogix.com:443 EUROPE2 tracing-ingress.eu2.coralogix.com:9443 otel-metrics.eu2.coralogix.com:443 otel-logs.eu2.coralogix.com:443
mode: daemonset

extraEnvs:
  - name: CORALOGIX_PRIVATE_KEY
    valueFrom:
      secretKeyRef:
        name: coralogix-keys
        key: PRIVATE_KEY
  - name: APP_NAME
    value: production # Can be any other static value
  - name: KUBE_NODE_NAME
    valueFrom:
      fieldRef:
        apiVersion: v1
        fieldPath: spec.nodeName
config:
  exporters:
    coralogix:
      # The Coralogix traces ingress endpoint
      traces:
        endpoint: "otel-traces.coralogix.com:443"
      metrics:
        endpoint: "otel-metrics.coralogix.com:443"
      logs:
        endpoint: "otel-logs.coralogix.com:443"

      # Your Coralogix private key is sensitive
      private_key: "${CORALOGIX_PRIVATE_KEY}"

      # (Optional) Ordered list of Resource attributes that are used for Coralogix
      # AppName and SubSystem values. The first non-empty Resource attribute is used.
      # Example: application_name_attributes: ["k8s.namespace.name", "service.namespace"]
      # Example: subsystem_name_attributes: ["k8s.deployment.name", "k8s.daemonset.name", "service.name"]
      application_name_attributes:
      - "service.namespace"
      subsystem_name_attributes:
      - "service.name"

      # Traces, Metrics and Logs emitted by this OpenTelemetry exporter
      # are tagged in Coralogix with the default application and subsystem constants.
      application_name: "MyBusinessEnvironment"
      subsystem_name: "MyBusinessSystem"

      # (Optional) Timeout is the timeout for every attempt to send data to the backend.
      timeout: 30s
  service:
    pipelines:
      logs:
        exporters:
        - coralogix
      metrics:
        exporters:
        - coralogix
      traces:
        exporters:
        - coralogix
Save this file.
2. Install the Associated OpenTelemetry Chart
Install the associated Otel chart with the release name of your choice:
helm upgrade otel-coralogix-agent open-telemetry/opentelemetry-collector --install --namespace=$NAMESPACE --create-namespace -f <insert full path of values yaml file here>Hint: Installing a new package requires two arguments: a release name that you pick and the name of the chart you want to install. You may choose any name that suits you; the example above adopts the release name
otel-coralogix-agent.
Hint: The
upgradecommand will both install the Otel Chart, then upgrade it to the latest version.
Run a demo to validate your installation.
Once you have installed and deployed OTel agent, run a demo. In order to do this, you will need to create an account on dockerhub as a prerequisite.
- Create a new YAML override file as follows:
opentelemetry-collector:
  mode: daemonset

  # fullnameOverride: otel-coralogix
  nameOverride: otelcol

  extraEnvs:
  - name: CORALOGIX_PRIVATE_KEY
    valueFrom:
      secretKeyRef:
        name: coralogix-keys
        key: PRIVATE_KEY

  - name: APP_NAME
    value: production # Can be any static value
  - name: KUBE_NODE_NAME
    valueFrom:
      fieldRef:
        apiVersion: v1
        fieldPath: spec.nodeName
  - name: CORALOGIX_TRACES_ENDPOINT
    value: otel-traces.coralogix.com:443
  - name: CORALOGIX_METRICS_ENDPOINT
    value: otel-metrics.coralogix.com:443

  config:
    exporters:
      coralogix:
        private_key: "${CORALOGIX_PRIVATE_KEY}"
        application_name: "${APP_NAME}"
        traces:
          endpoint: "${CORALOGIX_TRACES_ENDPOINT}"
        metrics:
          endpoint: "${CORALOGIX_METRICS_ENDPOINT}"
    processors:
      memory_limiter: null # Will get the k8s resource limits
      k8sattributes:
        passthrough: false
        filter:
          node_from_env_var: KUBE_NODE_NAME # The agent only discovers pods from the same host that it is running on
        extract:
          labels:
          - key_regex: '(.*)'
    receivers:
      jaeger:
        protocols:
          thrift_binary:
            endpoint: 0.0.0.0:6832
    service:
      pipelines:
        traces:
          exporters:
            - coralogix
            - logging
          processors:
            - k8sattributes
            - memory_limiter
            - batch
          receivers:
            - otlp
            - zipkin
            - jaeger
        metrics:
          exporters:
            - coralogix
          processors:
            - memory_limiter
            - batch
          receivers:
            - prometheus # The receiver configuration is coming from the open-telemetry dependency chart
            - otlp
        logs: null

  tolerations:
    - operator: Exists

  resources:
    limits:
      cpu: 900m
      memory: 900Mi

  # Creating a clusterrole for the k8sattributes filter
  clusterRole:
    create: true
    rules:
    - apiGroups: [""]
      resources: ["pods", "namespaces"]
      verbs: ["get", "watch", "list"]

  hostNetwork: true
Save this file.
- In the same namespace in which the override file is saved, install the associated demo chart with the release name of your choice:
helm install my-otel-demo open-telemetry/opentelemetry-demo -f <insert full path of values yaml file here>- Ensure all associated pods are running:
kubectl get pods -o wide |grep otelThe STATUS of these pods should appear "Running".
- Enable port forwarding so you can access the demo application from your browser:
kubectl port-forward svc/my-otel-demo-frontend 8080:8080- Open the following address in your browser:
http://localhost:8080- As you shop on the website, traces, logs and/or metrics will be sent to Coralogix, depending on which data you have chosen to send to us.
I've deployed the integration, but I still don't see my data on my Coralogix dashboard. What is the problem?
Once the installation process is complete, you may not see your telemetry data appear in your Coralogix account. This may indicate either that the installation has failed due to some error or that your installation is successful, but your application has not been configured to send data to Coralogix via this container. In order to find the source of the problem, we recommend you take a number of steps, including troubleshooting your Otel logs and running a demo. If the demo works successfully, the problem lies in the configuration of your application. If the demo fails to work, the problem lies in the configuration of the collector. You will find tools to solve both of these issues below.
- Following installation, expect Kubernetes to run a pod with your chosen installation name. Ensure this is the case by running the following command:
kubectl get pods- Locate and copy the full name of the OTel collector agent in your list of pods. The pod should appear exactly once with the STATUS "Running." If the STATUS is "Pending", rerun the command. The AGE appearing should be the time that has elapsed since your last helm upgrade.
Hint: If the status of OTel collector agent appears as "CreateContainerConfigError", as seen in the example below, this may be an indication that you have configured your private key improperly.

- Once you have located this specific pod, use the default logging tool command
kubectl logsfor retrieving its logs. Running this command with the--followflag streams logs from the specified resource, allowing you to live tail its logs from your terminal.
kubectl logs --follow <paste full name of opentelemtry collector agent pod here>- Rerun this set of commands at any later stage as necessary.
- In order to ensure that you have configured your Coralogix private key properly, run the following command:
kubectl get secrets- If you receive the following error, your key has not been recorded.

- Delete your private key by running the following command:
kubectl delete secret coralogix-keys- Repeat Step 2 in the Installation section above.
Now that I have set up my collector and tested it with a demo, how can I ensure that I am properly generating traces or other data from my application?
- Run a demo which generates traces from your application to ensure that you've properly set up your receiver.
Below you will find a simple example in javascript using node.js to get you started with OpenTelemetry. This includes installing the required Otel libraries and initializing a global tracer.
-
Follow the instructions to create the application file
app.jsand the traces generatortracing.js. -
Check the IP address of my Otel collector pod to update
tracing.js:
kubectl get pods -o wide |grep otelHere is an example:
otel-coralogix-agent-opentelemetry-collector-654d45fb7d-kfgj4 1/1 Running 0 42s 172.17.0.3 minikube <none> <none>
The string of numbers separated by periods - 172.17.0.3 in the example - is known as the IP address.
- Update and save the
tracing.jsfile with the IP address:
tracing.js
const sdk = new opentelemetry.NodeSDK({
  traceExporter: new OTLPTraceExporter({
    // optional - url default value is http://localhost:4318/v1/traces
    url: "http://172.17.0.3:4318/v1/traces",
    // optional - collection of custom headers to be sent with each request, empty by default
    headers: {},
  }),
  instrumentations: [getNodeAutoInstrumentations()],
});- Create a Docker file to create a docker image for your application and build the image. Here is an example:
- Run the following command:
docker build . -t <docker file path>Hint: The docker file path in the example above is mayakeren/otel-test-app.
- Push the image to your repository to make the file accessible from Kubernetes:
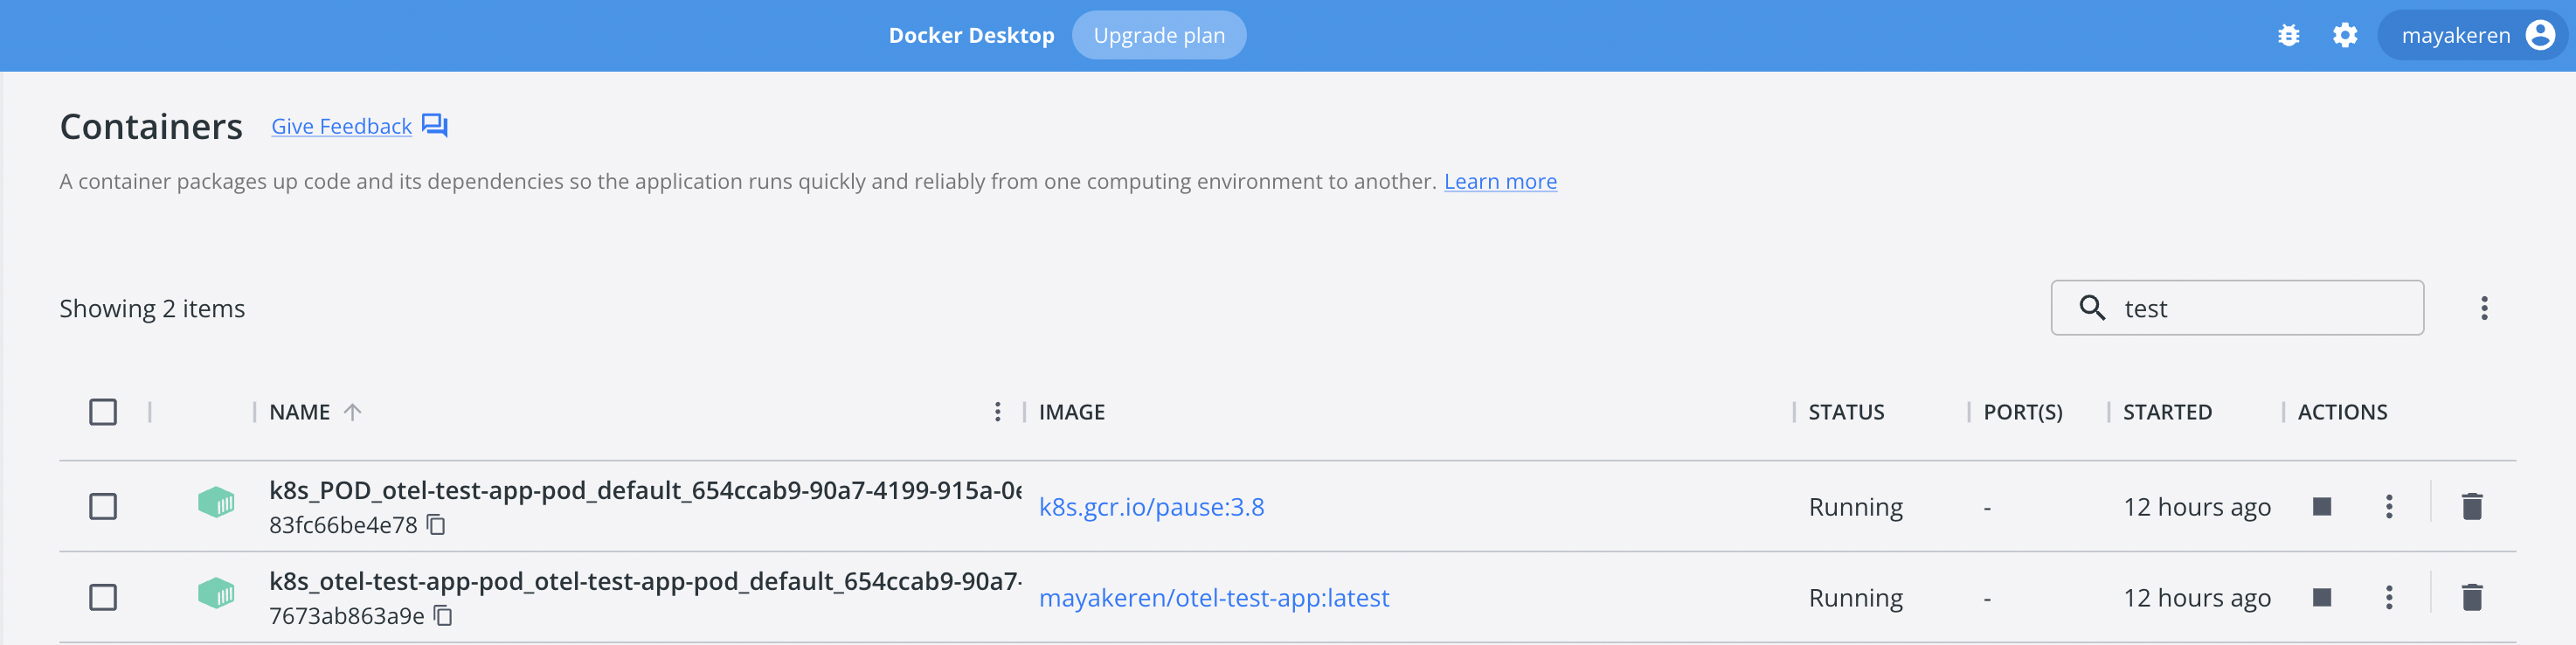
docker push <Docker image address>- Deploy your application by running the following command:
kubectl run otel-test-app-pod --image <Docker image address> --port 8080- Set the port forwarding:
kubectl port-forward otel-test-app-pod 8081:8080- Open http://localhost:8081/ on your browser. "Hello World" text should appear.
Now that I have completed the installation process and my data is being sent to Coralogix, where should I the see the data in my account?
Access your Coralogix dashboard after logging in to your account. Click on the Explore tab, then logs, tracing and/or metrics in the dropdown tab. In either dropdown tab, you have the option of refreshing. Your telemetry data should appear.
[Please add visual here]
[Internal note: This can be integrated into the "Getting Started" Section of the Coralogix website]
If you saw your telemetry data on your Coralogix dashboard recently, but now it no longer appears, you may have data retention settings that store data for only 24 hours. In order to determine how long the data sent will be retained, click on the tab Data Flow > TCO Quota Optimizer.
[Internal note: This can be integrated into the "Getting Started" Section of the Coralogix website]
Video: How to integrate metrics into Coralogix using OpenTelemetry, Kubernetes & Helm
Video: How to integrate traces into Coralogix using OpenTelemetry, Kubernetes & Helm
Video: How to integrate logs into Coralogix using OpenTelemetry, Kubernetes & Helm
Video: How to capture Kubernetes logs, transform with Logs2Metrics and render with DataMap
Github: Official OpenTelemetry Collector with Coralogix Exporter
Need help? Contact Coralogix support.
If you have any questions, feel free to reach out to us 24/7 via our in-app chat!