Wiki - MATF-RG19/RG43-crtanje-trodimenzionalnih-grafika GitHub Wiki
Graphing 3D Wiki
Description
Graph 3D plotter inspired by Desmos 2D graphing calculator. Program can plot any function with two parameters, surface areas or 3D predicates.
Week 1
This week:
-
Created template for main file;
-
Created Makefile;
-
Implemented support classes: utility::Vector (3D vector);
-
Implemented camera that moves on pressed keys 'A', 'W', 'S', 'D', zooms in on pressed key 'Z' and zooms out on pressed key 'X'. Camera movement is implemented using sphere parameterization:
-
Created colors header file with list of macro colors.
-
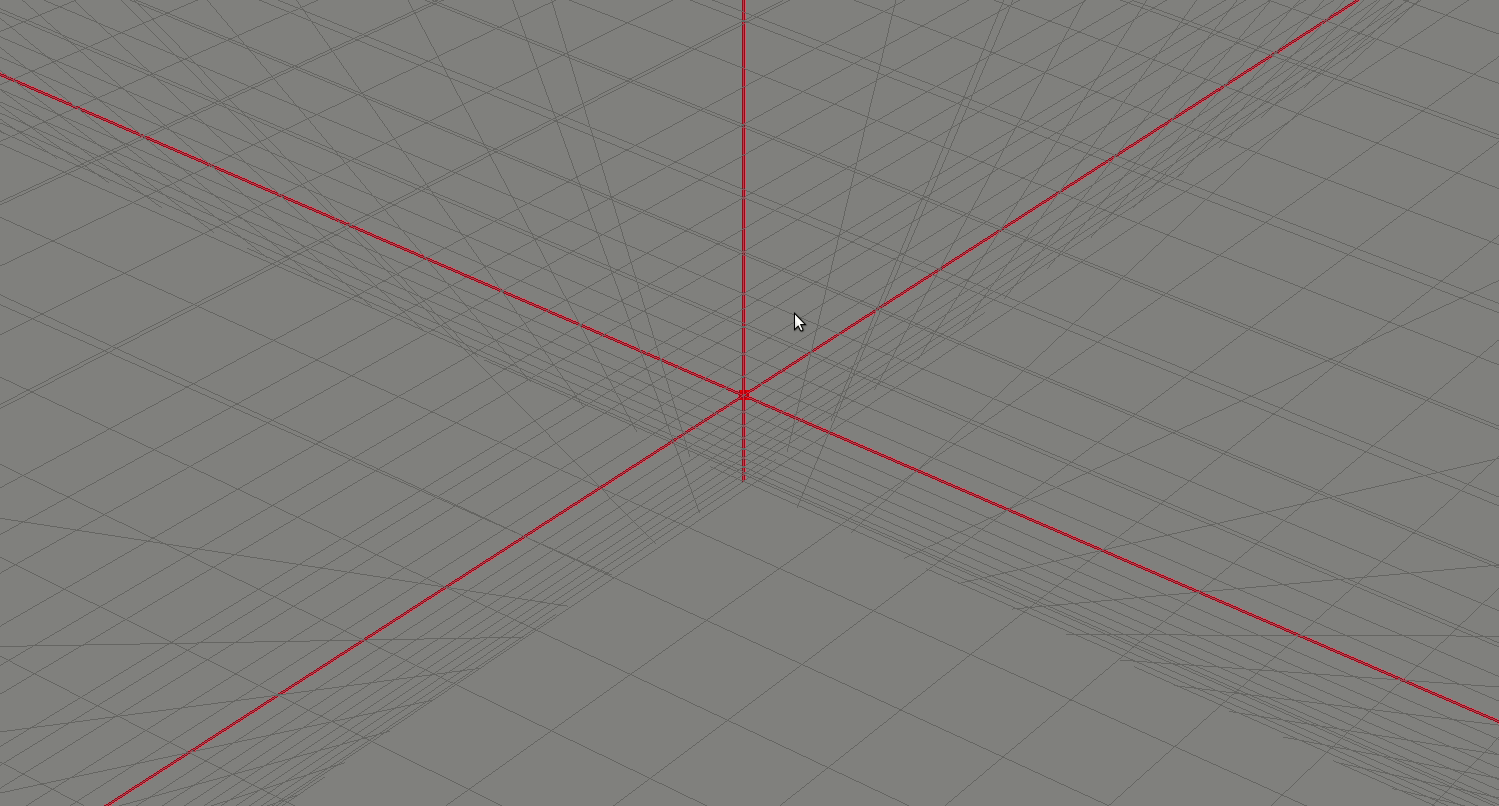
Implemented axis and grid draw functions.
Next week:
- Reorganize and refactored files;
- Implement simple function plotter.
Week 2
This week:
- Implemented simple function plotter that plots function grid:
- Function grid is plotted using consecutive lines (GL_LINES),
- Points are generated using double for loop for x-coordinates and y-coordinates where z-coordinate is calculated using x-coordinate and y-coordinate: ,
- Points are sorted by x axis (points_by_x) and by y axis (points_by_y),
- Sorted points are divided in sets by calculating their y-coordinate position distance for lines parallel to x-axis and calculating their x-coordinate position distance for lines parallel to y-axis. Two points belong to the same line if and only if they have same x-coordinate or if they have same y-coordinate;
- Only one function can be plotted.

Next Week:
- Implement Function struct;
- Implement composite function plotter;
- Add time parameter to function plotter.
Week 3
Delayed to week 4.
This Week:
- Implemented Composite Function plotter. Each Function class is defined by its function and plot interval range.
- Didn't add time parameter to function plotter.
Next Week:
- Add time parameter to function plotter.
Week 4
This week:
- Implemented window reshaping;
- Implemented timer;
- Modified plotter to plot functions using array of lambda functions;
- Added time parameter to function plotter:
- ,
- ;
- Fixed some camera bugs.


Next week:
- Implement function graph triangulation.
- Add light and materials.
Week 5
This week:
- Replaced old plotter with new plotter that is based on lesson 5. This makes function graph triangulation easier. No changes to plotter grid except color of grid;
- Grid can now be turned on/off using key 'g';
- Implemented light and materials:
- Graph points have color based on z-coordinate value where high value has red color and low value has blue color using formula:
- This formula converts R to [0, 1]
- red = p and blue = 1 - p;

- Implemented new type of plotter, predicate plotter:
- Predicate function takes three parameters and plots small cube if result is 1 (True);
- Uses three for loops (for x, y, and z).
- Implemented plotter swap on key 'K'.

Next week:
- Implement parameterization plotter.
Week 6
- Optimized code (Predicate plotter is more precise now);
- Fixed window scaling;
- Refactored main file;
- Implemented parameterization plotter:
- Instead of calculating z-coordinate like function plotter, parameterization plotter calculates points(utility::Vector) using parameterization parameters u, v and time parameter t;
- Implemented new feature: Change plotters using key 'K' (cyclic swap);
- Implemented function plot swap using key 'N'.

Next week:
- Implement simple user interface;
- Implement parser(maybe).
Week 7
This week:
- Implemented user interface;
- Created 'img' folder with images for user interface;
- Implemented fullscreen feature;
- Added new functions for plotters.


- Added green color to function plotter color fading:
- Red and blue color values from week 5 remain unchanged
