Lab 6 Refrigeration Heat Pump Cycle - MAE221/Thermodynamics-Lab GitHub Wiki
- To measure the coefficient of performance of a refrigeration/heat pump cycle
- To plot the state points and the cycle on Pressure-Enthalpy and Temperature-Entropy diagrams
- To determine the effect of refrigerant mass flow rate on coefficient of performance
- Measure the electric consumption of the compressor motor and compare that with the power consumed by the compressor.
Refrigeration and heat pump cycles are used to provide cooling or heating. In this lab, students will take measurements of fluid properties at various points throughout a heat pump cycle. They will plot results and use them to calculate important heat pump properties, including power usage and coefficient of performance (COP). Students will present their findings in a lab report.
When a system at a given initial state goes through a sequence of thermodynamic processes and finally returns to the initial state, the system has executed a thermodynamic cycle. A heat engine is a device which uses a thermodynamic cycle to convert the natural flow of heat energy from a hot reservoir to a cold reservoir into useful work. Most energy conversion systems used in today's society, including internal combustion engines, jet engines, and thermal power plants (coal, gas, nuclear, biomass, and geothermal) are examples of heat engines. Conversely, a heat pump takes work as input and uses this work to move heat "upstream" from a cold reservoir to a hot reservoir. Air conditioners, refrigerators, and ground- or air-source heat pumps are all examples of such a system.
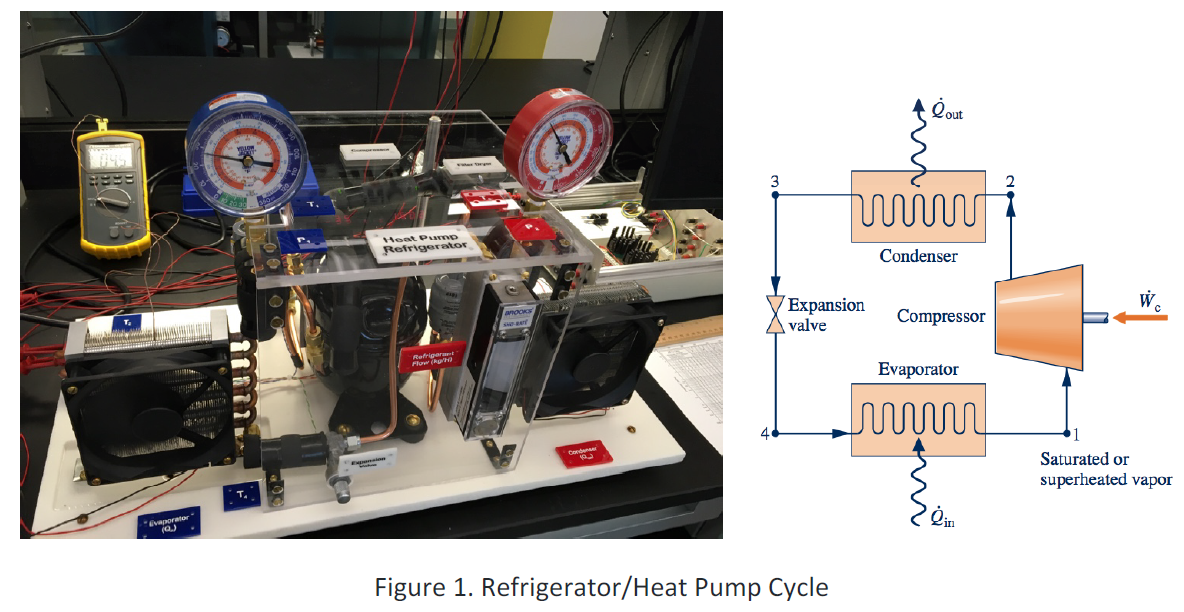
In this lab, we will measure the performance of a heat pump based on the vapor-compression refrigeration cycle shown in Figure 1. The cycle consists of a compressor, condenser, throttle, and evaporator. In this experiment, R-134a is used as the working fluid. A compressor raises the pressure of the vapor and hence its temperature. The vapor then passes through a condenser where it releases heat to the surroundings and condenses (the heat rejected in the condenser is a measure of the performance of a heat pump). The liquid leaving the condenser is throttled to the lower pressure and then passes through the evaporator where it is heated to form a vapor (the heat absorbed in the evaporator is a measure of the performance of a refrigerator). The vapor at the exit of the evaporator enters the compressor and the cycle repeats.
For a heat engine, efficiency is defined at the ratio of useful work produced to heat energy used. Because heat pumps do more than just convert energy, we instead use the coefficient of performance (COP) as a measure of how well a heat pump does its job. If Qin is the heat transferred into the system from the cold reservoir by the heat pump, and Qout is the heat transferred from the system to the warm reservoir, then Wcycle = Qout - Qin is the total work put into the system (in this case by our compressor). If the heat pump is acting in its normal mode (i.e. its purpose is to heat the hot reservoir), then we define the COP to be the amount of heat added to the hot reservoir per unit of input work:
Qin and Qout can be calculated based on observed changes in working fluid temperature, entropy, pressure, and enthalpy between different points in the thermodynamic cycle:
In many cases, a heat pump can have a COP greater than 1. This is possible because the pump does not just convert work into heat, but also moves heat from one environment to another. It is perfectly possible for the amount of heat moved to be greater than the amount of work put in.
- A refrigeration/heat pump apparatus instrumented to measure temperatures and pressures of the cycle. Throttle allows adjustment of mass flow rate of refrigerant.
- An electric meter measures the Watts consumed by the motor driving the compressor.
- Breadboard
- Photon
There are four thermistors located at different points on the heat pump. The color identifiers are:
- T1, after the evaporator: blue
- T2, after the compressor: brown
- T3, after the condenser: orange
- T4, after the expansion valve: green
The built-in thermistor circuits will be powered by the photon 3.3V power supply. Connect the thermistor array to the photon '3V3' port and the photon ground. Connect the four thermistor outputs for pins T1, T2, T3, and T4 (large red cables) to pins A0, A1, A2, and A7, respectively. Pin A7 is labeled 'WKP' on the photon.
Measure key heat pump parameters at three different mass flow rates, following the descriptions given below. Note that every time there is a change to the mass flow rate, the system will take time to reach a new thermal equilibrium. Take care to only take new measurements once you are satisfied that the system has reached this state.
For each measurement:
- Adjust the throttle valve to the desired mass flow rate, keeping it between 2 and 6 kg/h.
- Run the HeatPump.m MATLAB script to capture the temperatures. Wait until the plotted temperature lines flatten out, indicating that the system has reached thermal equilibrium. Close the plot, and read final temperatures from the command line. At the same time, record the pressures from the pressure gauges. Record the mass flow rate and the wattage on the motor.
- Save your workspace, in case you need your data later.
- Adjust the throttle valve to the next mass flow rate. Repeat measurements, waiting for equilibrium. Repeat once more. You should have three data sets at three distinct refrigerant mass flow rates.
- For each test case: plot the four states on a P-h diagram, then on a T-s diagram.
- Calculate the refrigerator coefficient of performance and the heat pump coefficient of performance. How does it vary with mass flow rate?
- Compare wattage measured in the motor to the power required by the compressor (based on measured states). How do they compare?
- Perform an error analysis.
- Discuss results.