Using the IDE - LorinczMate1990/FluidControlSim GitHub Wiki
In this wiki-page, there is a quick introduction into the usage of the IDE.
The IDE displays a hybrid plan view - side view, where the shape and the fluid level of the containers are displayed from the side, but the pipes, connections and the topology is displayed from above.
First, you have to install the Python 2.7 to use this program. Because it only uses standard Python libraries, you won't have to install any other prerequisite.
After that, you have to download the source directory from GitHub and you have to run the fluidsim_client.py script. This script starts the IDE and also starts a local server on port 8883. The usage of this server is described by an other tutorial.
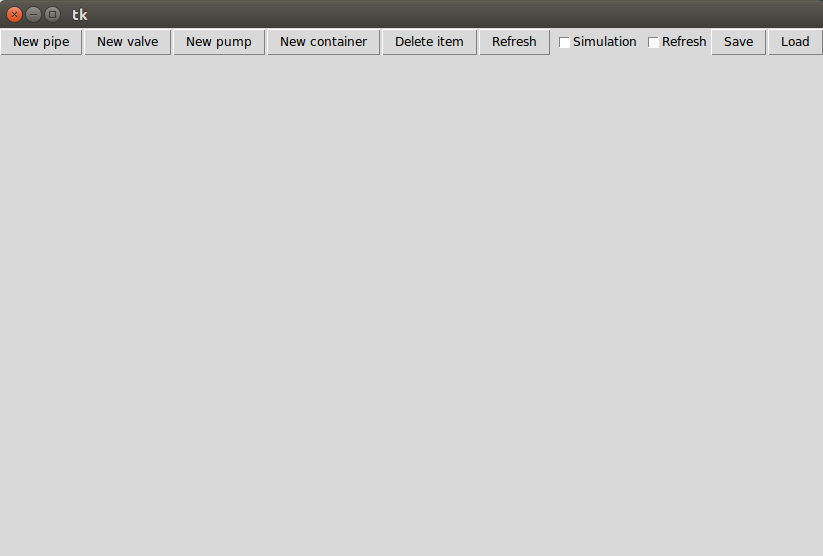
On the fallowing picture, you can see the freshly opened client window.
Adding new container
On the upper part there is a menu bar with all functionalities. To start a new model, you have to add firstly a new container by clicking on the "New container" button. By clicking on it, the fallowing window will appear.
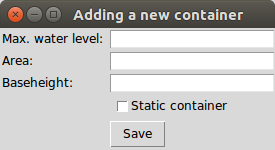
The Max. water level and Area will determine the max capacity and shape of the container. The Baseheight is currently ignored, but in the future, it will mean the distance between the bottom of the container and the ground. If the Static container checkbox is set, the fluid level won't change during simulation. The static containers can act as fluid source or sink. (Of course you can set the fluid level manually during the simulation.)
After you press the Save button, nothing visible will happen, but inside the simulation, the new container is existing. After pressing the button "Refresh", the newly created container will appear on the top left corner. You can move it by the mouse.
The newly created container is empty but with double click, you can open a window where you can set the fluid level and temperature of the container.
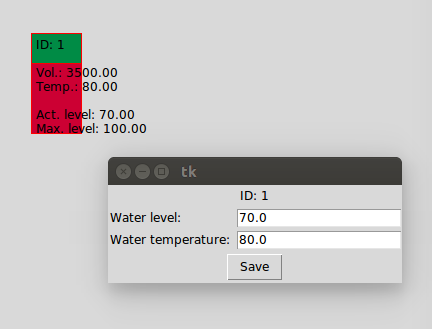
After saving and refreshing the simulation, the modified container will appear. On the graphical scene, you can see the water level and the temperature both by text and by shape/color.
Adding active elements (pipe, valve, pump)
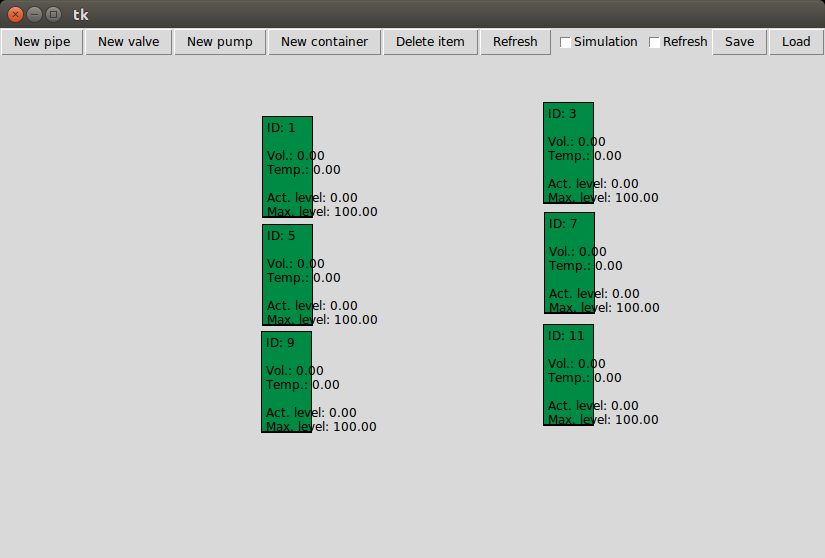
For testing the active elements, you will need an other container. I put six containers on my simulation scene to demonstrate all active elements.
Adding new pipe
First, click on the New Pipe button. The fallowing window will appear:
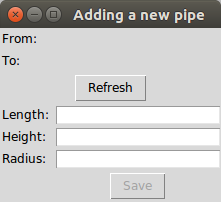
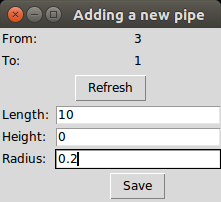
First, you have to select the two containers you would like to connect by the new pipe. For this, just click on the desired containers. (The order is not important in this case.) You will see red frame around the selected containers. After that, click on the Refresh button on the Adding a new pipe window. You will see the IDs of the selected containers appearing after the From: and To: lines.
After that, you have to specify the properties of this pipe. All of them are in meter. The Length and the Radius is the physical dimensions of the pipe. (The pipe is circular.) The height is the position of the center of the pipe from the floor. The simulation can only work with horizontal pipes. (To model pipes with falling, you have to put a container between two pipes with different height.) The fallowing picture shows the meaning of the different parameters. Please keep in mind that Baseheight of containers is ignored yet. (It's zero for every container.)

After you filled every values as you wanted, press the Save button! Please keep it in mind that until a refresh, the simulation scene won't change!
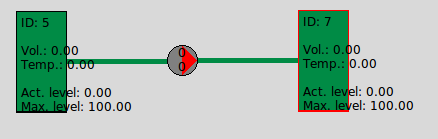
I connected the container 1 and container 3 with the new pipe. Let's test it! Please make a double click on container with ID 1 and fill some fluid inside it! After a double click, a small window appears with two entries, the Water level and the Water temperature. By default, both of them are zero. Lets set the water level to 70 meter and the water temperature to 30 degree! (I know that a 100 meter high container is very unrealistic, but the purpose of this simulation tool is not to simulate real environment but to test different control algorithms and equipment.) After we press the Save button and the Refresh button on the main screen, our container will show the new fluid level and the color symbolizes its temperature.
Testing the new pipe
To test it, we have to check the Simulation and the Refresh checkbox, and after that, we can press the Refresh button.

- Pressing the Refresh button without checking any checkbox, a single refresh occurs. The client downloads every information from the server (the server started automatically), but the simulation scene doesn't change.
- By pressing the Refresh button with Simulation checked, the simulation time is running 25 times by 0.01 second. (The simulator uses linear approximation in every time stepping. Stepping 25 times by 0.01 is more accurate than stepping once by 0.25 second.)
- By pressing the Refresh button with Simulation and Refresh checked, the simulation is running continuously until you uncheck the Refresh checkbox.
- By pressing the Refresh button only with Refresh checked, the client will reload the simulation scene as fast as it can, but it won't move the simulation time. It's useful when a third-party application handles the simulation time, but we would like to monitor its work. (Connecting to the simulation)
Adding and testing the new pump
Addig a new pump is the same as adding a new pipe, but the order of selecting the containers is important and we have to set the Max pressure. In the case of the pipe, the direction and the flow speed of the fluid are calculated from the fluid pressure difference on the two ends of the pipe. If you use a pump instead of a pipe, the pressure difference can be modified by the pump. The Max pressure is the maximum difference can caused by this pump. If the pump is completely turned off, it behaves the same way as a pipe.
To test it, please create a pump between ID5 and ID7 with length 10, Height 0, Radius 0.2 and Max Pressure 1000. You will see the fallowing picture:
The red triangle shows the direction of the pump and also it turns green when something (from a third-party application of from the client) turns it on. To turn the pump on, please double click on the pump icon!
You will get 3 entry boxes, but the first one (Maximum pressure) is a readonly property, you can't save its change. The performance can be vary from -100 to 100 and the ramping parameter describes the characteristic of the pump. Please set the Performance to 100% and see what happens after you press the Save and the Refresh button without checked Simulation and Refresh checkbox! The lower number on the pictograph turns into 100 but the upper number remains zero. The lower number is the setpoint. The upper number is the actual performance. If you check the Refresh and the Simulation checkboxes and you press the Refresh button, you will see, how the actual performance reaches the setpoint. It's dynamic is described by the fallowing second order differential equation:
By default, alpha is 10 and beta is zero, but you can change it on the property window on Ramping parameters. The ramping parameters must be a two-element tuple, the first element is the alpha, and the second element is the beta.
BUG ALERT You must not currently set alpha to zero!
Now, you can test your pump like your pipe.
Adding and testing the new valve
Pipes are simular to pumps, but they have different pictograph and instead of may pressure, you have to set the minimum and maximum radius for them. The actual radius will calculated from the permeability:
The valve with given permeability will act as a pipe with the same parameters and the same radius.
Deleting items
You can delete any container by selecting it and clicking on Delete item button. For delete an active element, you have to delete one of its endpoints.
Save and load the scene
With the Save button, you can save your current scene in the current folder. The saved scene is stored in a file named dump.txt. Currently, you can't rename this file from the IDE. By pressing the Load button, the IDE will load the content of the dump.txt.
Logging
Every log appears in the ./logs directory. The log files contain every gathered data with a timestamp, like fluid level, temperature or volume. They are stored in CSV format with header, so you can analyze them with Excel or a custom program.