Deconvolution - LeonSaal/TGA-FTIR-hyphenation-tool-kit GitHub Wiki
The release rates of gases can be deconvoluted in order to estimate the contribution of different entities. For samples of activated carbons e.g. this could be different oxygenated surface complexes, that decompose in overlapping temperature ranges, releasing the same gas(es).
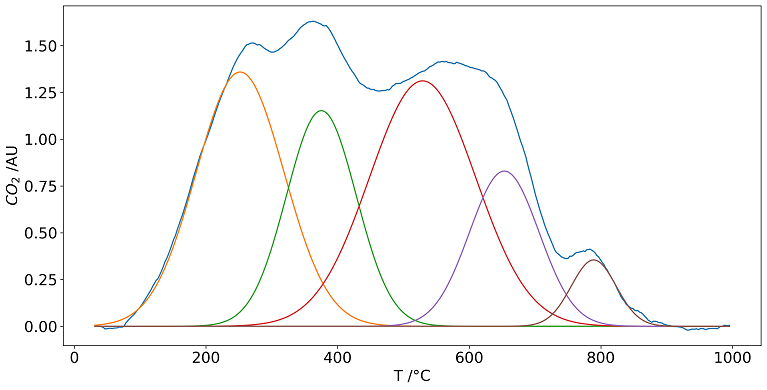
The deconvolution is performed using the Scipy curve_fit function and the Trust Region Reflective algorithm. By default the sum of gaussian functions is used to represent the gas profiles. Each gaussian function can be characterized with three parameters:
- center (T_m) in °C, the mode of the function
- height in arbitrary units, depending on FTIR. The maximum height at peak center
- width in °C (commonly, the Half Width at Half Maximum, HWHM is used)

Initial values and bounds
Initial values and bounds for the optimization can be defined in the file Fitting parameter.xlsx. For a proper functionality, solely the sheet with the name 'center_0' must be filled in. In the first column, the name of the parameter sets are listed that can be used as 'reference' for the fitting functions of the package.
The first two rows specify the name and released gas of the different entities. More entities can be appended in new columns. In your 'reference' row, the initial position of the peaks can be defined. Only entities with supplied value are used for the deconvolution.
The other sheets of the file can be used to define individual initial values as well as upper and lower boundaries for center, HWHM and height for each entity. Blank cells are internally filled with the default values supplied in the settings.ini file.
-
The initial values for HWHM and height are defined as a fraction of the upper bounds.
E.g. supplying HWHM_0: 0.5 and HWHM_max: 95 results in an initial value for HWHM of 0.5 * HWHM_max = 47.5.
-
Default for height_max is 'max' which represents the maximum value of the relese rate.
-
The Boundaries for 'center' are set as an symmetric interval with the width 2 * tol_center around the initial values.
E.g. supplying center_0 = 300, tol_center: 30 results in the interval [center_0 - tol_center, center_0 + tol_center] = [270, 330]
For all manually supplied parameters, _min < _0 < _max must hold!
Fits
To perform the .fit operation on several objects and calculate statistical values for samples of the same type, the fits() fuction is used.
the objs-list may contain different samples, as they are sorted internally according to following mask: sample_number where number has up to three digits.
E.g. calcium-oxalate-monohydrate_01 is recognized as calcium-oxalate-monohydrate with the number 01.
For all samples in the objs list, the mean and standard deviation (stddev) are calculated for the center, height, hwhm, area and mmol for each group (gaussian function). For the mmol_per_mg, q, the deviation, Δq (dev), is calculated according to error propagation with Δn = LOD and Δm = mass resolution of thermo balance. For multiple measurements, the mean deviation is used.


Eq: deviation of molar amount

Eq: mean deviation
Robustness
To test the robustness of the fitting procedure by varying the fitting parameters center, center tolerance, initial height and HWHM as well as maximum HWHM, the robustness() funtion is used.
For each parameter, initial center (center_0), center tolerance (tolerance_center), maximum HWHM (hwhm_max), initial height (height_0) and initial HWHM (hwhm_0) it was raised and lowered by the respective variance (var_T for center and tolerance center and maximum HWHM and var_rel for initial height and HWHM relative to maximum height and HWHM). For center, the initial center is varied separately for each gaussian function.
For each obj in objs, this results in 1 + 2 * (4 + N(gaussian functions)) individual fits.
1 [initial fit] + 2 [due to raising and lowering] * (4 [tolerance_center, hwhm_max, height_0, hwhm_0] + N(gaussian functions))
For each of the five parameters, there are now two results for q in addition to the initial results, 11 in total. For a better overview these results are further summarized:
- mean: mean of all mean values for each sample
- meanstddev: standard deviation of all mean values for each sample
- stddev: standard deviation for all individual measurement of each sample
- min: minimum q from all 11 fitting results
- max: maximum q from all 11 fitting results