Development Guidelines - Learning-Dashboard/LD-learning-dashboard GitHub Wiki
In order to document the REST services of the Learning Dashboard API, the approach followed is one known as Test Driven Documentation. Following this method, the documentation is produced directly by the automated tests that execute and validate the part of the system managing the REST services. Every time the tests are executed, the documentation is updated and, if any of the tests fail, the developer is informed of the error and no new documentation is produced until the error is fixed. The key benefit granted by this approach is the fact that, as long as the tests are maintained and executed regularly, the documentation cannot be outdated and always represents the reality of the system. The tool used to document the endpoints inside the tests is Spring REST Docs.
In the Learning Dashboard, the tests which produce the documentation can be found in the src/test/java/com/upc/gessi/qrapids/app/presentation/rest/services directory. For every test, the internal structure is as follows: first of all, the behaviour of the mocked dependencies is defined, as well as the objects that they return. Next, the call to the endpoint is performed and the returning status code and body is checked. Following this, every part of the call and response is documented inside the test, giving descriptions of each parameter and field involved. Finally, the interactions with the mock dependencies are checked and verified.
@Test
    public void getAllAlerts() throws Exception {
        // Defining mock behaviour
        Project project = domainObjectsBuilder.buildProject();
        when(projectsDomainController.findProjectByExternalId(project.getExternalId())).thenReturn(project);

        Alert alert = domainObjectsBuilder.buildAlert(project);
        List<Alert> alertList = new ArrayList<>();
        alertList.add(alert);
        when(alertsDomainController.getAlerts(project)).thenReturn(alertList);

        // Perform request
        RequestBuilder requestBuilder = MockMvcRequestBuilders
                .get("/api/alerts")
                .param("prj", project.getExternalId());

        // Check response values
        this.mockMvc.perform(requestBuilder)
                .andExpect(status().isOk())
                .andExpect(jsonPath("$", hasSize(1)))
                .andExpect(jsonPath("$[0].id", is(alert.getId().intValue())))
                .andExpect(jsonPath("$[0].id_element", is(alert.getId_element())))
                .andExpect(jsonPath("$[0].name", is(alert.getName())))
                .andExpect(jsonPath("$[0].type", is(alert.getType().toString())))
                .andExpect(jsonPath("$[0].value", is(HelperFunctions.getFloatAsDouble(alert.getValue()))))
                .andExpect(jsonPath("$[0].threshold", is(HelperFunctions.getFloatAsDouble(alert.getThreshold()))))
                .andExpect(jsonPath("$[0].category", is(alert.getCategory())))
                .andExpect(jsonPath("$[0].date", is(alert.getDate().getTime())))
                .andExpect(jsonPath("$[0].status", is(alert.getStatus().toString())))
                .andExpect(jsonPath("$[0].reqAssociat", is(alert.isReqAssociat())))
                .andExpect(jsonPath("$[0].artefacts", is(nullValue())))

                // Document fields and parameters
                .andDo(document("alerts/get-all",
                        preprocessRequest(prettyPrint()),
                        preprocessResponse(prettyPrint()),
                        requestParameters(
                                parameterWithName("prj")
                                        .description("Project external identifier")),
                        responseFields(
                                fieldWithPath("[].id")
                                        .description("Alert identifier"),
                                fieldWithPath("[].id_element")
                                        .description("Identifier of the element causing the alert"),
                                fieldWithPath("[].name")
                                        .description("Name of the element causing the alert"),
                                fieldWithPath("[].type")
                                        .description("Type of element causing the alert (METRIC or FACTOR)"),
                                fieldWithPath("[].value")
                                        .description("Current value of the element causing the alert"),
                                fieldWithPath("[].threshold")
                                        .description("Minimum acceptable value for the element"),
                                fieldWithPath("[].category")
                                        .description("Identifier of the element causing the alert"),
                                fieldWithPath("[].date")
                                        .description("Generation date of the alert"),
                                fieldWithPath("[].status")
                                        .description("Status of the alert (NEW, VIEWED or RESOLVED)"),
                                fieldWithPath("[].reqAssociat")
                                        .description("The alert has or hasn't an associated quality requirement"),
                                fieldWithPath("[].artefacts")
                                        .description("Alert artefacts")
                        )
                ));

        // Verify mock interactions
        verify(alertsDomainController, times(1)).getAlerts(project);
        verify(alertsDomainController, times(1)).setViewedStatusForAlerts(alertList);
        verifyNoMoreInteractions(alertsDomainController);
    }
Every test produces snippets of the different parts of the documented request and response in Asciidoc format, which are later joined together in a single Asciidoc file named index.adoc, located in the folder docs/asciidoc. In order to produce the full documentation, the developer must update this file manually including the new snippets every time a new documented test is added, and execute the gradle task gradle asciidoctor in order to transform this Asciidoc file into an HTML one. The current Github configuration deploys automatically this HTML every time it is updated.
The git workflow used in this project is a relaxed variation of Gitflow. We have two main branches: master and develop. The master branch contains the last stable version of the Dashboard, and the develop branch contains the finished features added in every sprint. In order to develop each feature, a new branch feature/XXX is created from develop, and once the feature is finished the branch is merged. When an error is detected, it can be solved directly in a new commit in the develop branch or by creating a fix/XXX branch and merging it later, if the error is more complex.
Two tools are integrated with this project in order to enhance the development process: Travis CI and SonarCloud. Travis CI is a continuous integration tool which is configured to build the project and execute the automated tests for every new commit in the repository. SonarCloud is a static code analysis tool which is in charge of detecting issues in the quality of the new code added in every commit and in the whole project.
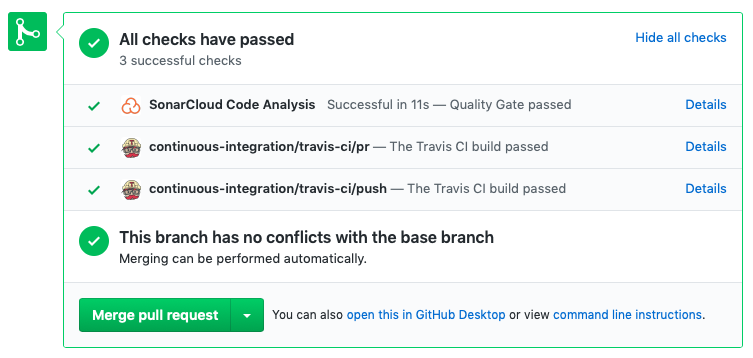
The best way to take advantage of the tools is by using Pull Requests for every new branch created in the repository. For example, once a feature branch is created, a new Pull Request must be opened. For every new commit that the developer adds to the feature branch, the Pull Request will show three different checks provided by the tools, with useful information about the new code. Two of the checks are provided by Travis CI, showing one check representing the build status of the new commit in the existing branch and also one check representing the build status of the simulated merge with the base branch. The last check is provided by SonarCloud, showing if the quality of the new code meets the standards of the project. By clicking in the checks, the developer can visualize more information by going to the project page inside the tool.

In order to close and merge a Pull Request, we have to differentiate between long living branches and short living branches. In the Learning Dashboard repository, the long living branches are master and develop, and everything else is considered a short living branch. When a short living branch has to be merged with a long living branch (for example, a feature branch merged with develop), the most appropriate way to do it is by selecting the merging options “Squash and merge” inside the Pull Request. By doing so, all the commits are fitted into a single one, and the history of commits of the base branch becomes much clearer. The feature branch has to be deleted afterwards, since the history of commits is altered and the branch cannot be used anymore. With the long living branches, since we want to keep using them after the merge, the correct option when merging a Pull Request is “Create a merge commit”. With this option, the history is preserved and a new merge commit is added to the base branch.